Figure 1.
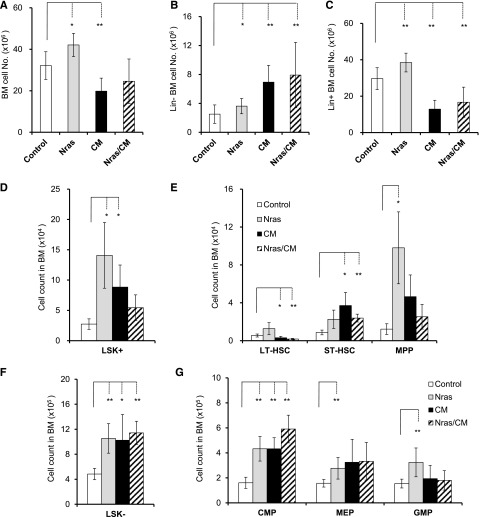
Cbfβ-SMMHC and NrasG12D expand preleukemic stem and progenitor cells. Quantification of BM cells from Mx1Cre (control, white), Nras+/LSL-G12D/Mx1Cre (Nras, gray), Cbfb+/56M/Mx1Cre (CM, black), and Nras+/LSL-G12D/Cbfb+/56M/Mx1Cre (Nras/CM, diagonal) mice by flow cytometry, 20 days after Cre activation. (A-C) n = 8-14 mice per group: (A) BM cell numbers (per mouse) in each group; (B) lineage-negative (Lin–) BM cell numbers in each group; (C) Lineage-positive (Lin+) BM cell numbers in each group. (D-E) n = 4-8 mice per group: (D) LSK+ cell numbers in BM; (E) long-term (LT-HSCs, LSK+CD34–FLT3–), short-term (ST-HSCs, LSK+CD34+FLT3–) hematopoietic stem, and multipotential progenitor (MPPs, LSK+CD34+FLT3+) cell numbers in each group. (F-G) n = 5-12 mice per group: (F) LSK– cell numbers; (G) common myeloid progenitor (CMP, LSK–CD34+FcγRII/III–), megakaryocyte-erythroid progenitor (MEP, LSK–CD34–FcγRII/III–), and granulocyte-monocyte progenitor (GMP, LSK–CD34+FcγRII/III+) cell numbers in each group. *P < .05, **P < .01.

