. 2014 Jun 14;3:e03005. doi: 10.7554/eLife.03005

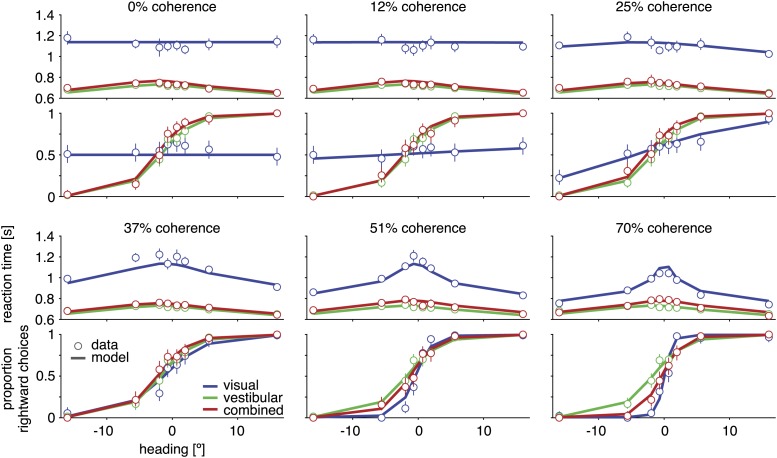
Figure 3. Discrimination performance and reaction times for subject D2.

Behavioral data (symbols with error bars) and model fits (lines) are shown separately for each motion coherence. Top plot: reaction times as a function of heading; bottom plot: proportion of rightward choices as a function of heading. Mean reaction times are shown for correct trials, with error bars representing two SEM (in some cases smaller than the symbols). Error bars on the proportion rightward choice data are 95% confidence intervals. Although reaction times are only shown for correct trials, the model is fit to data from both correct and incorrect trials. See Figure 3—figure supplement 1 for behavioral data and model fits for all subjects. Figure 3—figure supplement 2 shows the fitted model parameters per subject.

DOI: http://dx.doi.org/10.7554/eLife.03005.006

Figure 3.

Figure 3—figure supplement 1. Psychometric functions, chronometric functions, and model fits for all subjects.

Figure 3—figure supplement 1.

Behavioral data (symbols with error bars) and model fits (lines) are, for clarity, shown separately for each different coherence of the visual motion stimulus. The reaction time shown is the mean reaction time for correct trials, with error bars showing two SEMs (sometimes smaller than the symbols). Error bars on the proportion of rightward choices are 95% confidence intervals. Note that reaction times are shown only for correct trials, while the model is fit to both correct and incorrect trials.
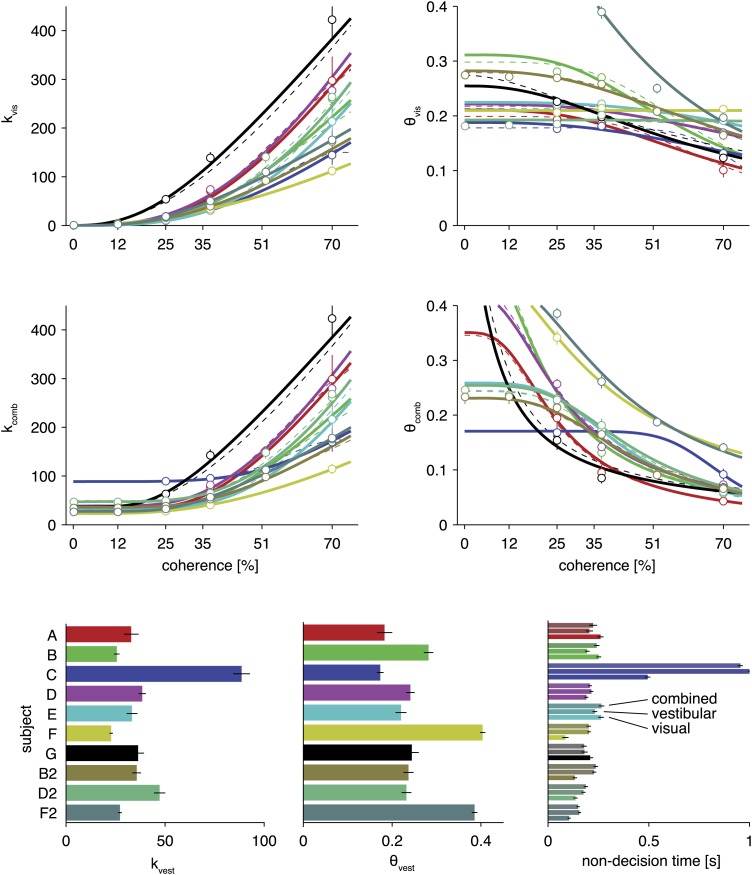
Figure 3—figure supplement 2. Model parameters for fits of the optimal model and two alternative parameterizations.

Figure 3—figure supplement 2.

Based on the maximum likelihood parameters of full model fits for each subject, the four top plots show how drift rate and normalized bounds are assumed to depend on visual motion coherence. The solid lines show fits for the model described in the main text. The dashed lines show fits for an alternative parameterization with one additional parameter (see Supplementary file 1). The circles show the fits of a model that, instead of linking them by a parametric function, fits these drifts and bounds for each coherence separately. As can be seen, the parametric functions qualitatively match these independent fits. The bottom bar graphs show drift rate and bound for the vestibular modalities and fitted non-decision times for each subject, all for the model parameterization described in the text. All error bars show ±1 SD of the parameter posterior. Each color corresponds to a separate subject, with color scheme given by the bottom left bar graph.