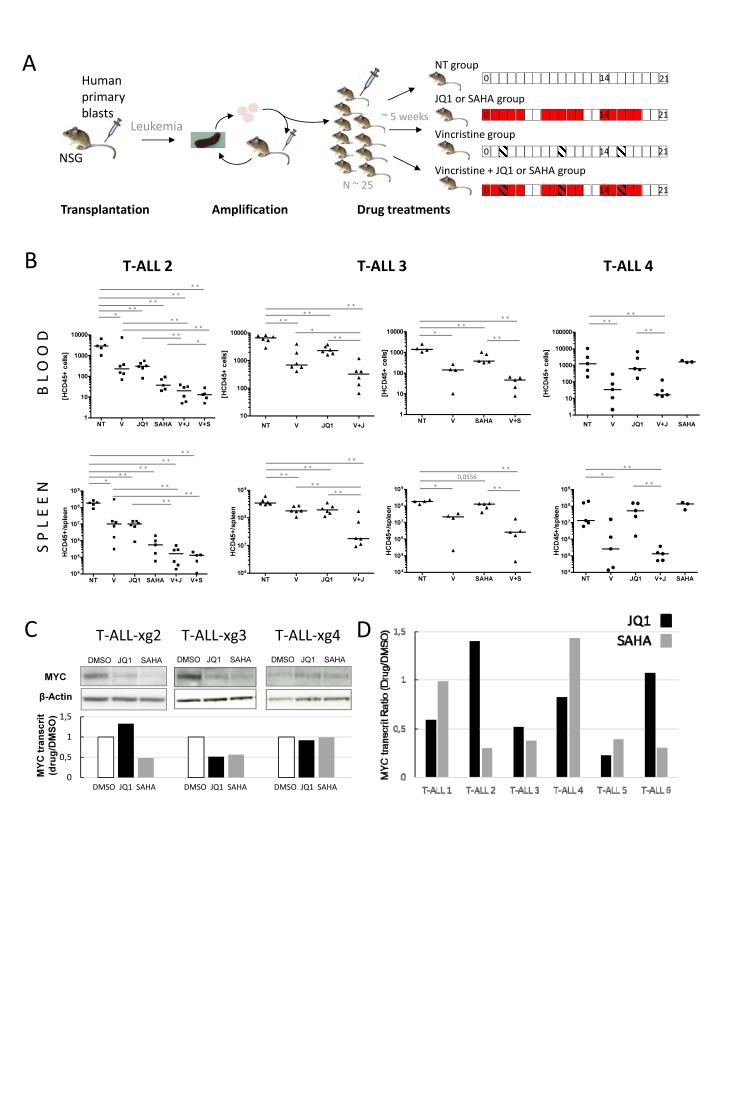
Figure 2. In vivo analysis of JQ1/SAHA efficiencies in xenografts of human primary T-ALL.
(A) Design of xenografts and in vivo drug treatment assays. NOD/SCID/γc (NSG) mice are grafted with human primary blasts. Following leukemia development, mice are sacrificed, and blasts from spleens are transplanted in secondary recipient mice for amplification (1-2 rounds). For drug treatments, a set of ~25 NSG mice are engrafted with 1.106 cells issued from the same tumor bulk (from amplification step). Upon appearance of hCD45+ human blasts in blood (1-25/µl), mice are divided into pools of 5-6 for drug treatments. Treatments were run over 21 days with indicated schedules: SAHA and JQ1 were injected (ip) 5 days weekly (red boxes); Vincristine was injected (ip) 1 day weekly (hatched boxes); NT: control mice, not treated; Blood samples were drawn at days d0, d14 and d21 post-treatment; mice were sacrificed at d21, and spleens harvested. (B) hCD45+ blasts were quantified by FACS; concentrations of hCD45+ cells/µl of blood (top plots) and numbers of hCD45+ cells per spleen (bottom plots) are shown for T-ALL#2 (■, left plots) T-ALL#3 (▲, middle plots) and T-ALL#4 (●, right plots) xenografted mice. Median values are indicated by horizontal bars. The non-parametric Mann-Whitney test was used to calculate P values, differences statistically significant are indicated; * P < 0.05, ** P < 0.001. V: treated with Vincristine; V+J: treated with Vincristine+JQ1; V+S: treated with Vincristine+SAHA. (C) Western blot analysis of MYC protein expression in xenograft T-ALL#2, T-ALL#3 and T-ALL#4 cells following ex vivo treatments by JQ1, SAHA or DMSO; the relative MYC transcript ratio is indicated. (D) Histograms: relative MYC transcript levels of 6 human primary T-ALL cells incubated with 1µM JQ1 (black) or 1µM SAHA (grey). Transcripts are reported as the ratio of MYC transcripts (relative to ABL) from drug-treated cells versus control.

