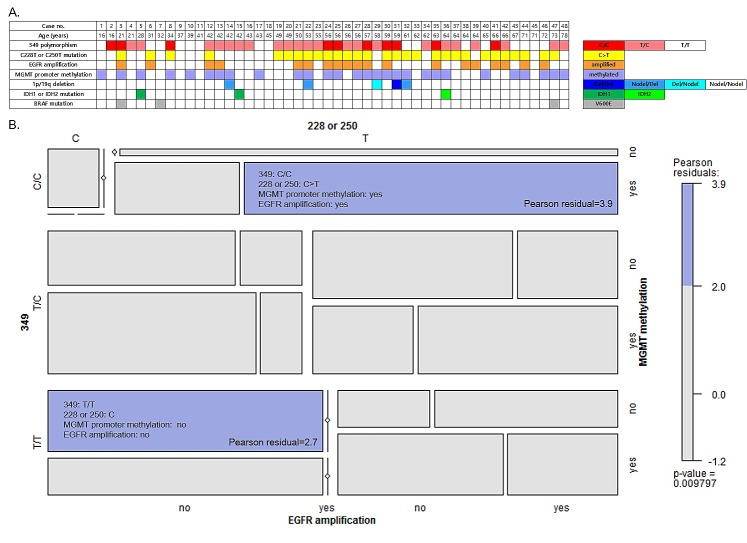
Figure 1.
A. Distribution of hTERT promoter genetic events and other molecular characteristics in 48 glioblastoma patients. The cases are ordered by priority of age. B. Mosaic plot for somatic mutation (C228T or C250T) and common polymorphism (T349C) in the hTERT promoter region, MGMT promoter methylation and EGFR amplification. The colored cells show significant magnitude of the Pearson residuals (≥ 2.0) obtained from an independence model.

