Abstract
Photoacoustic imaging (PAI) of biological tissue has seen immense growth in the past decade, providing unprecedented spatial resolution and functional information at depths in the optical diffusive regime. PAI uniquely combines the advantages of optical excitation and acoustic detection. The hybrid imaging modality features high sensitivity to optical absorption and wide scalability of spatial resolution with the desired imaging depth. Here we first summarize the fundamental principles underpinning the technology, then highlight its practical implementation, and finally discuss recent advances towards clinical translation.
Keywords: biomedical imaging, label-free imaging, small animal imaging, cancer diagnosis, human imaging
1. Introduction
The photoacoustic (PA) effect refers to a phenomenon of generating acoustic waves from an object being illuminated by pulsed or intensity-modulated continuous-wave (CW) electromagnetic waves, especially light. Although its first demonstration by A. G. Bell dates back to 1880 (1), the PA effect has been widely exploited only recently in a number of fields, ranging from basic sciences to engineering (2; 3). In biomedicine, the application of the PA effect started in the 1970s (4); however, not until the last decade of the 20th century were breakthroughs achieved in demonstrating the PA effect in optically scattering media and biological tissue (5; 6). In particular, the demonstration of functional PA imaging (PAI) propelled the field into a fast developing stage (7). PAI has now become one of the largest research areas in the field of biomedical optics.
PAI combines the advantages of optical excitation and acoustic detection, resulting in a hybrid imaging modality that has high sensitivity to optical absorption (8) and the capability for deep imaging in soft tissue. Although pure optical imaging methods can also detect optical absorption by measuring the intensity variation in transmitted or reflected light, they are generally two orders of magnitude less sensitive than PAI (9). Additionally, since an acoustic wave has a much lower scattering coefficient in biological tissue than light, PAI offers high spatial resolution imaging at a greater depth than conventional optical imaging methods, thereby ultrasonically breaking through the optical diffusion limit.
Cross-sectional or three-dimensional PAI is referred to as photoacoustic tomography (PAT). The spatial resolution and imaging depth within the reach of diffusive photons in PAT is highly scalable. In the diffusive regime, the spatial resolution of PAT is derived from ultrasonic detection. As the ultrasonic center frequency and bandwidth increase, the spatial resolution improves at the expense of a decreased imaging depth because higher frequency ultrasound experiences more attenuation, and vice versa. The depth-to-resolution ratio is determined by the space-bandwidth product a modality can measure in volumetric imaging. In PAT, the depth-to-resolution ratio is ~ 200 (10), nearly two orders of magnitude higher than that in diffuse optical tomography (11).
In this review, we introduce the fundamental principles of PAI in the time and frequency domains, and theoretically compare their signal-to-noise ratios (SNR) based on laser safety standards. Then we discuss multi-scale PAT and its major implementation. The subsequent section focuses on the role of PAT in quantitative measurements. After that, current technical advances towards translational PAT are reviewed. Finally, the field is summarized, and future directions are discussed.
2. Principles
Upon absorbing a photon, the molecule transitions from the ground state to an excited state. The energy is released primarily via two paths: radiative decay, i.e., fluorescence, or non-radiative decay, i.e., thermal dissipation. If the excitation light is a short pulse (time domain) or intensity-modulated (frequency domain), the generated heat during non-radiative decay produces an ultrasonic wave via thermoelastic expansion, referred to as the PA wave. The fundamental principles of PAI in the time domain and frequency domain are addressed in this section.
2.1 Time-domain photoacoustics
There are two important time scales associated with pulsed laser heating: thermal relaxation time and stress relaxation time. The excitation is defined as being thermally or stress confined if the laser pulse duration is much shorter than the corresponding relaxation time.
The thermal relaxation time characterizes the thermal diffusion over a region and is estimated by , where αth is the thermal diffusivity (m2/s) and dc is the characteristic dimension of the heated region or the desired spatial resolution. The stress relaxation time describes the pressure propagation and is given by τs = dc/vs, where vs is the speed of sound (m/s).
Upon excitation, the fractional volume expansion dV/V can be expressed as
| (1) |
Here κ is the isothermal compressibility (Pa−1) and β is the thermal coefficient of volume expansion (K−1). p and T denote the pressure (Pa) and temperature (K), respectively. Provided that the thermal and stress confinements are both satisfied, the fractional volume expansion is negligible and the pressure immediately builds up within the heated region. The initial pressure rise p0 can be derived from Eq. 3:
| (2) |
which can be rewritten as
| (3) |
Here Ae is the specific optical absorption (J/m3), ηth is the percentage of absorbed energy that is converted to heat, ρ is the mass density (kg/m3), and CV is the specific heat capacity at constant volume (J/(kg.K)). To simplify Eq. 3, a dimensionless quantity, the Grueneisen parameter, is defined as
| (4) |
Substituting Γ into Eq. 3 yields
| (5) |
In case of linear optical absorption, i.e., Ae is proportional to the local optical fluence F (J/cm2), Eq. 5 becomes
| (6) |
where μa is the optical absorption coefficient (cm−1).
The rapid deposition of laser energy causes an immediate increase in pressure within the heated region. Under conditions of thermal linearity (12) and thermal confinement, the release of this pressure through the thermoelastic expansion gives rise to an ultrasonic wave. The acoustic pressure p of the ultrasonic wave is governed by the following wave equation (13):
| (7) |
Here H is the heating function defined as the heat deposited per unit volume and per unit time, and H is related to the specific optical absorption Ae by .
The spatial and temporal profiles of pressure p(r⃑,t) derived from Eq. 7 are affected by the geometry of an absorber (14), the laser pulse duration (14), the mass density ratio ρ̂ and sound speed ratio v̂s of the absorber to surrounding media (13), and the ultrasonic attenuation (15). Under conditions of delta-pulse excitation, ρ̂ = 1, v̂s = 1, and zero ultrasonic attenuation loss, a forward solution to Eq. 7 is (16)
| (8) |
where p0(r⃑′) is the initial pressure rise at position r⃑′. If the pulsed excitation has a finite duration, the pressure waveform can be computed by a convolution with the delta-pulse response:
| (9) |
where H(t) is the temporal profile of the excitation pulse. For monopole radiation—i.e., radiation from a point absorber at r⃑′ = 0 (12), Eq. 8 becomes
| (10) |
Substituting Eq. 10 into Eq. 9 yields
| (11) |
Equation 11 implies that, in time-domain PAI, the monopole PA amplitude is proportional to the product of the initial pressure rise p0 at the origin and the first time derivative of excitation pulse temporal profile H(t).
Equations 8–11 are based on the hypothesis of no ultrasonic loss during propagation; however, since most time-domain PAI methods collect broadband ultrasonic signals, the frequency-dependent ultrasonic attenuation becomes a dominating factor when one calculates the pressure in the far field (15). Consequently, the pressure waveform p(r⃑,t)is subject to filtering with the ultrasonic attenuation function U(ω) of the medium:
| (12) |
where F denotes Fourier transformation. For water and muscle, U(ω) has a form of and , respectively (17), where α denotes the ultrasonic attenuation coefficient (Hz−2/m or Hz−1/m). Equation 12 implies that the ultrasonic attenuation not only reduces the PA amplitude, but also broadens the PA wave temporal profile, thereby degrading the spatial resolution in acquired images (15). To improve image quality, the ultrasonic attenuation can be accounted for mathematically (18; 19).
2.2 Frequency-domain photoacoustics
The analytical description of frequency-domain PAI is most conveniently formulated by utilizing the Fourier transformation. Below, tilde above a variable denotes the Fourier transform of the variable. Eq. 7 is Fourier transformed into an inhomogeneous Helmholtz equation:
| (13) |
where k = ω/vs is the acoustic wave number. Note that heat diffusion is ignored even when the sinusoidal excitation lasts longer than the thermal relaxation time. A general Green’s function solution of Eq. 13 for unbounded media is
| (14) |
Equation 14 implies that, in frequency-domain PAI, the PA amplitude is proportional to the modulation frequency ω at the origin.
In the far field where |r⃑| ≫ |r⃑′|, we have |r⃑ − r⃑′| ≈ |r⃑| − r̂ · r⃑′. Equation 14 becomes
| (15) |
In case of monopole radiation, we have H̃(r⃑′,ω) = μaĪηthδ(r⃑′), where Ī is the average laser fluence rate. Accordingly, Eq. 15 becomes
| (16) |
The harmonic PA signal (Eq. 16) can be measured with a high SNR by lock-in detection (20). However, it is not suitable for depth-resolved imaging due to phase wrapping at a single frequency. In order to achieve sectioning capability, chirped optical excitation has been exploited (21–23), with a typical form as a linear frequency sweep
| (17) |
where ωc is the central frequency of the chirp, Bch and Tch are the frequency bandwidth and duration of the chirp. Because the temperature oscillation follows the laser-heating oscillation, the received pressure is also chirped, with a time lag τ dependent on the depth of the absorber. The frequency-modulated acoustic wave can be detected by a single transducer or a transducer array (24), provided that the transducer’s frequency response is consistent with the chirp’s bandwidth. Signal processing methods, such as frequency-domain cross-correlation or spectral analyzer technique (21), have been employed to recover the time lag τ and the corresponding absorber’s depth.
2.3 Signal-to-noise ratios in the time and frequency domains
In both time-domain and frequency-domain PAI, the detected PA response voltage from a transducer equals
| (18) |
where Qtr(ω) is the normalized transfer function of the transducer and ξ is the sensitivity of the transducer at its peak frequency. A typical sensitivity range of polymer film transducers is 6–10 μV/Pa (25; 26).
In case of monopole radiation, combining Eq. 11, 16, and 18 gives PA response voltages in the time-domain and frequency-domain, respectively
| (19) |
| (20) |
where Fpul is the laser fluence in pulsed mode and Īcw is the average laser fluence rate in CW mode. The ratio of peak PA response voltage in the time-domain to that in the frequency-domain is calculated as
| (21) |
If the temporal profile for pulse excitation is Gaussian, i.e., , Eq. 21 becomes
| (22) |
We can estimate the ratio in Eq. 22 based on the ANSI laser safety standards (27), which regulate the maximum permissible Fpul and Īcw for pulsed and CW radiations. In the visible spectral range (400 nm–700 nm), the maximum permissible exposure of skin to pulsed laser radiation (1 ns to 0.1 μs pulse duration) and CW laser radiation (> 10 s exposure time) is 20 mJ/cm2 and 200 mW/cm2, respectively. With a duration of 10 ns for pulsed excitation and a modulation frequency of 100 MHz for CW excitation, Eq. 22 gives |Vtr,TD|max/|Vtr,FD|max ~106.
The signal-to-noise ratio (SNR) in PAI is defined as
| (23) |
Here is normally dominated by the thermal noise, which is governed by the equation — where kB is the Boltzmann constant, T is the absolute temperature, R is the loading resistor, and Δf is the detection bandwidth. Assuming that in the frequency domain the PA signals are detected by a phase-sensitive detector with an equivalent noise bandwidth as narrow as 1 Hz (time constant: 0.125 s, 12 dB/octave rolloff), and in the time domain they are detected by a broadband detector with 100 MHz bandwidth, we have
| (24) |
Equation 24 implies that, with typical excitation and detection parameters, the SNR in the time-domain is about four orders of magnitude (40 dB) higher than that in the frequency-domain despite the different data acquisition times. The SNR in the frequency domain may become comparable to that in the time domain by choosing a much longer time constant during lock-in detection. This process, however, compromises data acquisition speed. In addition, the flicker noise becomes significant when the bandwidth is less than 1 Hz, limiting the usage of extremely narrow bandwidth during lock-in detection. Despite a lower SNR, it is worth noting that, compared to pulsed lasers, CW lasers have an advantage of being compact and less costly, a fact that lends credence to frequency-domain PAI in point-of-care applications (28).
3. Multi-scale photoacoustic tomography and major implementations
The primary embodiment of PAI in biomedicine is PAT. PAT can image multi-scale living biological structures, ranging from organelles to organs. Depending on application fields and achievable spatial resolution, PAT is divided into optical-resolution photoacoustic microscopy (OR-PAM), acoustic-resolution microscopy (AR-PAM), photoacoustic computed tomography (PACT) and photoacoustic endoscopy (PAE). Additionally, although ultrasonic transducers are widely used as detectors in PAT, optical detection photoacoustic tomography (OD-PAT) emerges as a promising alternative. In this section, we review the state-of-art implementation of PAT in biomedicine.
3.1 Optical-resolution photoacoustic microscopy (OR-PAM)
To achieve high ultrasonic resolution requires collecting high-frequency acoustic waves. However, as described in Eq. 12, high frequency acoustic waves experience strong attenuation in soft tissue. Within the optical quasi-ballistic regime—depths less than ~1 mm in most biological tissue (16), light can be focused more tightly than ultrasound. To release the dependence of resolution on acoustic frequency, OR-PAM utilizes focused light to spatially confine the excitation, resulting in an optical diffraction-limited resolution in the lateral direction (29).
Unlike x-ray imaging, OR-PAM can either work in back-reflection (29–33) or transmission mode (34; 35), with typical setups shown in Fig. 1 (a) and (b), respectively. In both cases, the excitation laser is focused onto an object to excite acoustic waves. To maximize detection sensitivity, a focused ultrasonic transducer is adopted and aligned confocally with the optical lens. The lateral resolution of OR-PAM is optically determined by the laser wavelength in vacuo and the numerical aperture (NA) of the lens:
| (25) |
Fig. 1.
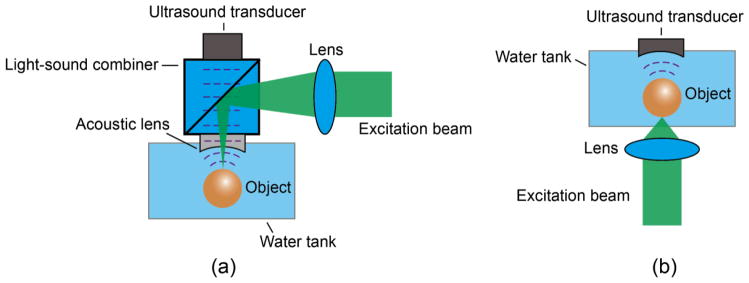
Optical setups of OR-PAM working in a (a) back-reflection and (b) transmission mode.
The axial resolution of OR-PAM is still acoustically determined by the bandwidth B of a ultrasonic transducer (36)
| (26) |
Ultimately, the choice of the acoustic bandwidth is based on the desired imaging depths.
To achieve volumetric imaging, the object is normally raster-scanned in the transverse plane. The depth information is encoded into the time of flight of the PA wave, and can be recovered by d = vst. Here vs is the speed of sound in the media and t is the arrival time of the PA wave at the ultrasonic transducer. Since one laser pulse must be fired at each scanning position, the imaging speed of OR-PAM is limited by the laser repetition rate. By utilizing a high repetition rate laser (e.g., 100 kHz) and a water-immersible microelectromechanical systems (MEMS) scanning mirror, a B-scan rate up to 400 Hz over a 3-mm scanning range was reported (32).
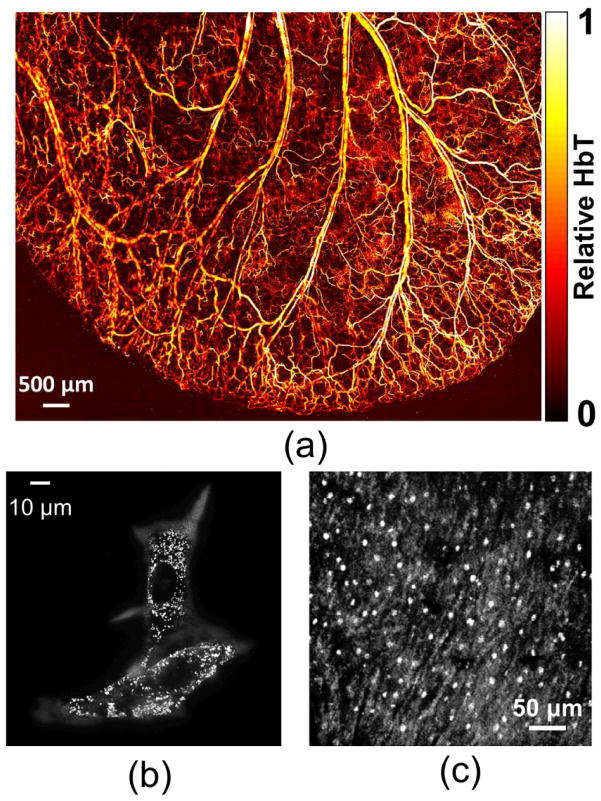
OR-PAM works within the optical ballistic or quasi-ballistic regime. Due to light scattering, the imaging depth of OR-PAM is limited to around one transport mean free path (~1 mm) in biological tissue (16). Beyond this depth, the lateral resolution is degraded quickly and becomes acoustically limited (37). Compared to conventional optical microscopy technologies, OR-PAM has an advantage in providing high contrasts for endogenous chromophores without staining, enabling label-free imaging of biological tissue or cells in vivo and in transitioning into the diffusive regime smoothly. Representative images in Fig. 2 show the imaging capability of OR-PAM at different scales: vasculature structure in a nude mouse ear (Fig. 2(a)), melanin in melanoma cells (Fig. 2(b)), and cell nuclei (Fig. 2(c)).
Fig. 2.
Photoacoustic maximum amplitude projection (MAP) images of (a) vasculature structure in a mouse ear, (b) melanin in melanoma cells, and (c) cell nuclei. Reprint with permission from Refs (30; 34; 38).
Optical ballistic regime refers to depths in scattering media within which photons have undergone negligible scattering. Quasi-ballistic refers to regime depths within which photons have sustained a few scattering events but retain a strong memory of the original incidence direction. Diffusive regime refers to depths within which photons have sustained a sufficient number of scattering events and lost nearly all memory of the original incidence direction.
3.2 Acoustic-resolution photoacoustic microscopy (AR-PAM)
In AR-PAM, rather than focus light to an optically diffraction-limited spot, a relative large area is illuminated. As a result, more laser energy is allowed by the ANSI laser safety standards (27) in AR-PAM than in OR-PAM, boosting the chance of photons reaching a much greater depth.
The illumination in AR-PAM can be either bright- (Fig. 3 (a) (39)) or dark-field (Fig. 3 (b) (40)). While the bright-field approach can deliver higher fluence to a targeted volume (39), the dark-field method has an edge on reducing surface interference to deeper PA signals (41). The spatial resolution of AR-PAM is acoustically limited along all axes. For a focused ultrasonic transducer with a aperture of diameter D, and focal length l, the lateral resolution is computed as (42)
Fig. 3.
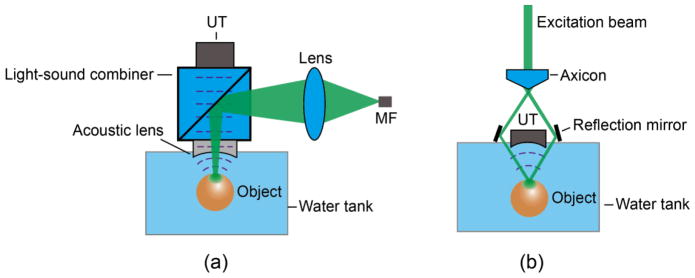
Optical setups of AR-PAM under (a) bright-field and (b) dark-field illumination. Note the light diffusion inside the objects. MF: multimodal fiber. UT: ultrasonic transducer.
| (27) |
where λ0 is the acoustic wavelength, while the axial resolution can still be calculated by the same equation (Eq. 26) as in OR-PAM. The only difference in the pre-factor between this equation and Eq. 25 lies in the fact that optical illumination is intensity-based and acoustic detection is amplitude-based. The ratio between the two pre-factors is approximately square root of 2.
In contrast to OR-PAM, AR-PAM can work in an optical diffusive regime. The achievable imaging depth is highly scalable with image resolution, and depends on the central frequency and bandwidth of an ultrasonic transducer. For example, a 44 μm lateral resolution was measured at a depth of 4.8 mm with a 50 MHz ultrasonic transducer (39), while a lateral resolution of 560 μm was reported at a depth of 38 mm by using a 5 MHz ultrasonic transducer (43).
3.3 Photoacoustic computed tomography (PACT)
Rather than relying on raster scanning as in PAM, PACT uses an array of ultrasonic transducers to detect PA waves emitted from an object at multiple view angles simultaneously, allowing a much faster cross-sectional or volumetric imaging speed at the expense of system and computational costs (44–46).
To accurately render an object’s boundaries, at least a π-arc directional view is required to be covered by a detector array in 2D PACT (44). Ultrasonic transducer arrays with various populating patterns, such as line (47), half ring (48; 49), full-ring (50; 51) and hemisphere (52), have been employed and demonstrated in both animal and clinical applications.
The imaging speed of PACT is normally limited by the data acquisition system. A current state-of-art PACT system can achieve a rate up to 8 frames/second with a lateral resolution < 200 microns over a 2 cm disk-shaped region (50). Fig. 4 shows a variety of mouse organs measured by a PACT system equipped with a full-ring transducer array of 512 elements (51).
Fig. 4.

PACT images of athymic mice acquired noninvasively at various anatomical locations: (a) the brain, (b) the liver, (c) the kidneys, and (d) the bladder. BL, bladder; BM, backbone muscle; CV, cortical vessels; EY, eyes; GI, GI tract; KN, kidney; LV, liver; PV, portal vein; SC, spinal cord; SP, spleen; and VC, vena cava. Reprint with permission from Ref. (51).
3.4 Photoacoustic endoscopy (PAE)
PAT of internal organs through endoscopy is referred to as PAE (53). Compared to routinely used clinical ultrasound endoscopy, PAE offers the same strength in spatial resolution while providing additional functional information at physiological sites.
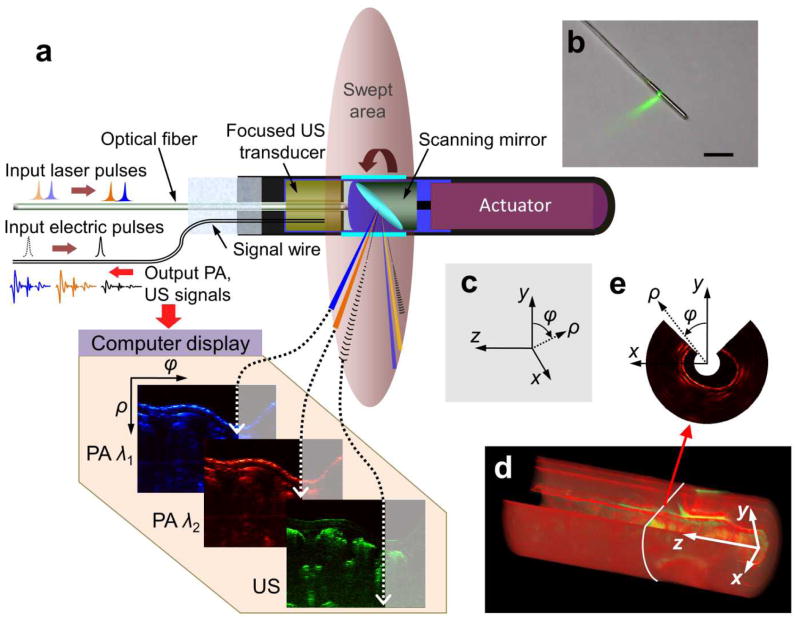
PAE features the miniaturization of both optical illumination and acoustic detection components, allowing them to be assembled in a compact package. Fig. 5 shows a typical setup of a PAE probe, which has an outside diameter of 3.8 mm. This probe integrates ultrasonography with PAE, and is designed for gastrointestinal tract imaging (54). Circumferential sector scanning is accomplished by rotating a scanning mirror, which reflects both ultrasonic waves and illumination laser pulses to a physiological site. The ultrasonic wave and pulsed laser are fired sequentially, and the ensuing ultrasound echoes and PA signals are collected by the same ultrasonic transducer after being reflected by the mirror. By using this PAE probe, an angular field-of-view of 270 degrees and a depth of over 5 mm were achieved in a rabbit esophagus imaging experiment (54).
Fig. 5.
Simultaneous, multi-wavelength PA and ultrasonic endoscopy. (a) The endoscope carries out circumferential sector scanning by rotating a scanning mirror, reflecting both ultrasonic waves and laser pulses. At each angular step of the mirror (~1.42°), both the first (wavelength λ1) and second (wavelength λ2) pulsed laser beams are independently fired through an optical fiber and the acoustic pulse is generated by an ultrasonic transducer. The ensuing PA and ultrasonic echo waves are detected by the same ultrasonic transducer. (b) Photograph of the PAE probe. (c) Definition of Cartesian and cylindrical coordinate systems. (d) A volumetric image comprising consecutive B-scan slices. (e) A representative cross-section of (d) along the x-y plane, which shows the 270° angular FOV of the endoscope. Reprint with permission from Ref. (54).
3.5 Optical-detection photoacoustic tomography (OD-PAT)
Instead of using piezoelectric detection in conventional ultrasonic transducers, the PA signals can also be detected by optical approaches. There are two strategies: One probes PA-induced refractive index changes of the medium (55–59), and the other senses the deformation of the pressure sensor (60–62).
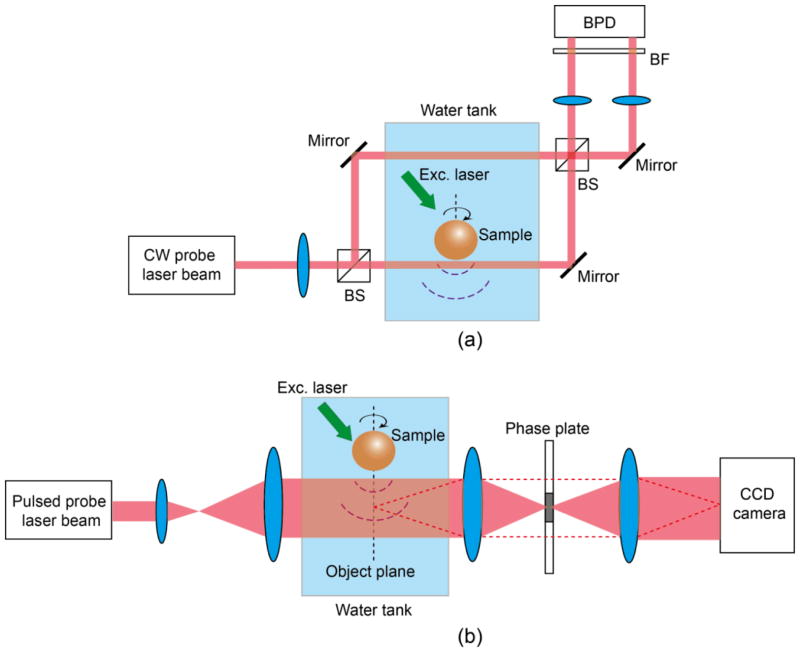
To measure PA-induced refractive index changes, phase imaging techniques, such as Mach–Zehnder interferometry (55) or phase contrast microscopy (59), were exploited, with typical setups shown in Fig. 6 (a) and (b), respectively. In a Mach–Zehnder-interferometry-based setup (Fig. 6a), the sample is close to one arm of the interferometer. The acoustic waves change the refractive index of the medium along this arm (sample arm) while leaving the other arm (reference arm) unaffected. A phase difference is thus introduced between the beams from these two arms, and can be recovered by recording their interference. To reconstruct a three-dimensional (3D) image, the pressure field is measured at multiple positions by rotating and translating the sample.
Fig. 6.
Optical setups of OD-PAT using (a) Mach–Zehnder interferometry and (b) phase contrast detection. BF, bandpass filter; BFD, balanced photodetector; BS, beam splitter.
In a phase-contrast-microscopy-based setup (Fig. 6(b)), upon PA excitation, the local medium’s refractive index change splits the probe light into perturbed (dashed line) and unperturbed (solid line) beams. A π/2 phase difference is added to the perturbed beam by a phase plate located at the Fourier plane of the sample. The two light beams are then combined to produce an interfere fringe on a CCD camera. A full 2D pressure field is recovered by the phase unwrapping of the interferogram. Due to its 2D parallel acquisition, phase contrast microscopy is superior to Mach–Zehnder interferometry in terms of imaging speed for OD-PAT (59).
The problem of measuring PA signals through sensing refractive index changes resides in the low piezo-optical conversion ratio, e.g., ∂n/∂p = 1.47 × 10⁻¹⁰ Pa−1 for water (63). State-of-the-art phase imaging techniques can recover an optical path length (OPL) change as small as 0.5 nm (64). For a PA wave with a bandwidth of 20 MHz, its envelope L spans ~ 66 μm in space. If we treat L as the interaction distance between the pressure field and coupling water, the minimum measurable refractive index change in water can be approximated as Δn = OPL/L = 7.6 × 10⁻⁶, which corresponds to a pressure amplitude of Δp = Δn × ∂p/∂n = 5.2 × 10⁴ Pa. The noise-equivalent pressure (NEP) of this detection scheme thus equals (20 MHz bandwidth), which is four orders of magnitude higher than a typical NEP of a broadband piezoelectric transducer ( , Ferroperm, Denmark).
Noise-equivalent pressure (NEP) is a measure of the sensitivity of an acoustic detector. It is defined as the pressure that gives a signal-to-noise ratio of unity in a one hertz output bandwidth.
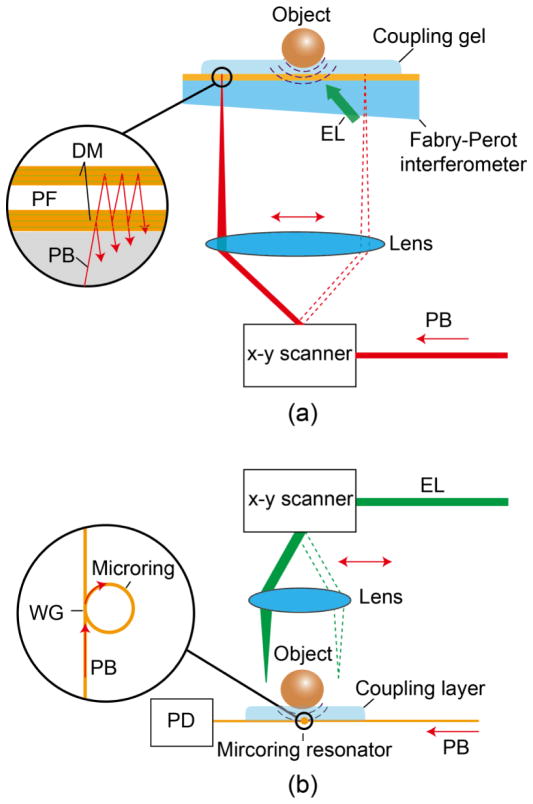
To improve the sensitivity, the second strategy directly measures the deformation of pressure-sensitive materials using optical resonance. Two successful implementations are high Q polymer microring resonators (Fig. 7(a)) (65; 66) and Fabry-Perot interferometer (FPI) (Fig. 7(b)) (60–62). When PA waves impinge on a pressure sensor, the pressure modulates the resonance wavelength and thereby the output probe laser power. The minimum NEPs reported for microring resonator-based systems and FPIs are (25 MHz bandwidth) (67) and (20 MHz bandwidth) (68), respectively. Currently, FPI stands out among OD-PAT methods due to its superior imaging performance. Two representative images of a mouse embryo and colorectal tumor captured by a FPI are shown in Fig. 8 (a) and (b), respectively.
Fig. 7.
Optical setups of OD-PAT, with (a) a high Q polymer microring resonator and (b) a Fabry-Perot polymer film as the pressure sensor. DM, dichroic mirror; EL: excitation laser; PB, probe beam; PD, photodiode; PF, polymer film; WG, wave guide.
Fig. 8.
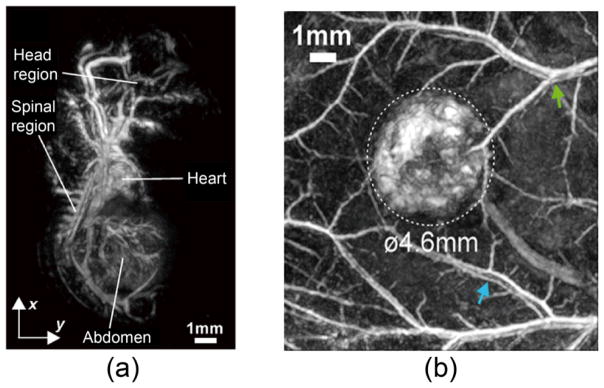
Photoacoustic maximum amplitude projection (MAP) images of vasculature structures in (a) a mouse embryo and (b) colorectal tumor (LS174T) acquired by a FPI-based PACT system. Reprint with permission from Ref. (60; 61).
4. Quantitative photoacoustic sensing and imaging
4.1 Photoacoustic oxymetry
The blood oxygenation can potentially be used to measure hypermetabolism, a hallmark of cancer (69). The key measure of blood oxygenation is oxygen saturation of hemoglobin (sO2), which is defined as the ratio of oxy-hemoglobin concentration to the total hemoglobin concentration:
| (28) |
where CHbO2 and CHHb refer to the concentrations of oxy-hemoglobin and deoxy-hemoglobin, respectively. Since oxy-hemoglobin and deoxy-hemoglobin have different absorption spectra μa(λ), PAT can discriminate these two chromophores and quantifying their concentrations in vivo without labeling.
As indicated in Eq. 8, in time-domain PAT, the initial pressure rise after pulsed laser excitation is proportional to the product of the absorption coefficient, μa, and the local fluence, F. Provided that the dependence of the fluence F on the optical wavelength λ is known, the sample’s absorption spectrum μa(λ) is estimated as
| (29) |
where p(λ) is the PA amplitude. After that, one can derive the concentrations of oxy-hemoglobin and deoxy-hemoglobin by applying a spectral unmixing algorithm (70), and calculate sO2 distribution by using Eq. 28. As a representative image, Fig. 9 shows a dual-wavelength measurement of sO2 in a nude mouse ear by OR-PAM.
Fig. 9.
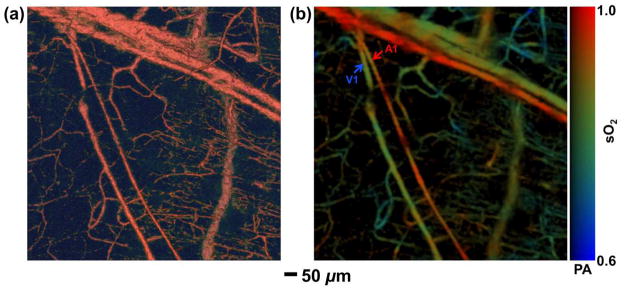
Structural and functional microvascular imaging by OR-PAM in a nude mouse ear in vivo. (a) Structural image acquired at 570 nm. (b) Vessel-by-vessel sO2 mapping based on dual-wavelength (570 nm and 578 nm) measurements. The calculated sO2 values are shown in the color bar. A1: a representative arteriole; V1: a representative venule. Reprint with permission from Ref. (80).
The accuracy of recovered sO2 relies on the SNR of each spectral channel and the condition number of the spectral component matrix (71). While increasing the number of spectral channels and optimizing the spectral component matrix are usually restricted by available laser wavelengths, a recent study showed that improving channel SNR is more effective and can be easily achieved by employing a spectrally coded illumination (72).
However, due to light scattering and absorption, the fluence F in deep tissue is usually heterogeneous and its dependency on wavelength is unknown. The correction of PA signals for fluence variations, referred to as quantitative photoacoustic sensing and imaging, has been addressed via various approaches (73–76). Additionally, fluence-independent quantities, including acoustic spectra (77; 78) and molecular lifetime (79), have been used to recover blood sO2.
4.2 Photoacoustic thermometry
PA thermometry refers to the method of deriving the temperature distribution within a sample from measuring PA signals. The PA thermometry has been implemented both at cellular (81; 82) and tissue levels (83–85). In time-domain PAT, the initial pressure rise p0 is proportional to the Grueneisen parameter Γ, which has a linear relationship with the temperature of the surrounding medium, as given by an empirical relation (16):
| (30) |
where A and B are constants, and T is the local temperature. In a non-scattering absorbing medium, Eq. 30 can be rewritten for the detected pressure amplitude as
| (31) |
where μa is the absorption coefficient, F0 is the laser fluence at the sample surface, and z is the depth. If the absorbing medium is optically thin, such as a biological cell, Eq. 31 is simplified to
| (32) |
With fluence correction and system calibration, the following quantity S is recovered:
| (33) |
where k is the system’s pressure sensitivity. Rearranging Eq. 33 gives
| (34) |
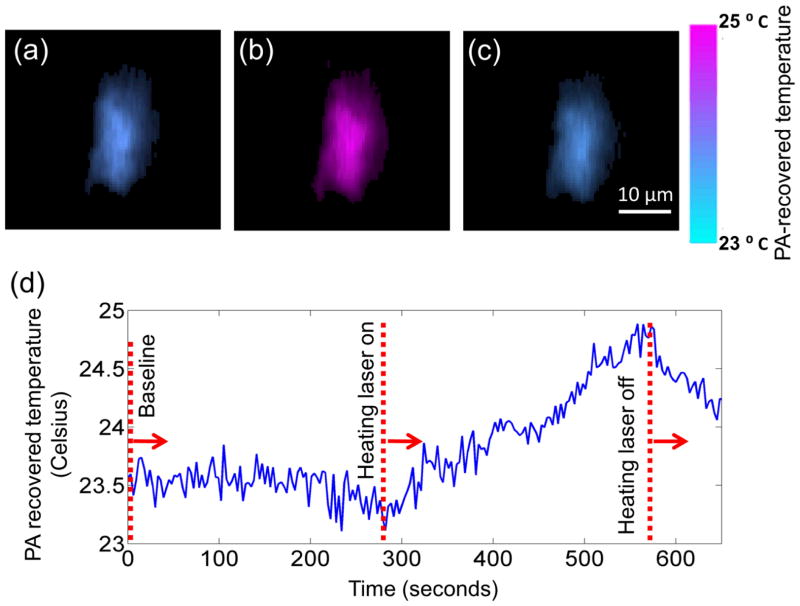
Since the coefficients 1/kμaB and A/B can be calibrated for, Eq. 34 can be used to reconstruct a temperature map. Fig. 10 shows temperature images of a cell during a photothermal heating process measured by OR-PAM (81). A temperature resolution of 0.2 °C was achieved with an acquisition time of 3 seconds/C-scan.
Fig. 10.
Single-cell temperature imaging with photo-thermal heating. The cell was loaded with metal particles and heated by a CW laser. (a) through (c) show the cell temperature images before, during, and after heating, respectively. The cell is pseudo-colored based on its PA-recovered temperatures. Reprint with permission from Ref. (81).
In the case that the sample is optically thick, such as in biological tissue, the fluence varies with the depth. Herein the PA amplitude cannot be simply corrected with the surface fluence F0. Instead, a baseline PA image at a reference temperature T0 is required (83). Dividing the PA amplitude measured at temperature T with that measured at T0, and rearranging the equation gives
| (35) |
Equation 35 indicates that, by acquiring two PA signals, the temperature can be recovered at various depths.
It is worth noting that, to image absolute temperatures, the calibration must be done at the same environment as that in real temperature imaging. However, inserting a thermocouple into tissue is invasive, an operation that limits PA thermometry for in vivo studies. Calibration-free temperature imaging remains a challenge in PA thermometry.
4.3 In vivo photoacoustic flowmetry
PA flowmetry refers to the method of measuring flow speed based on PA imaging. Compared to ultrasonic flowmetry (86), PA flowmetry has an advantage in low flow speed (<1 mm/s) measurement.
The flow velocity vector is decomposed into two components: axial speed (along the ultrasonic transducer axis), and transverse speed (perpendicular to the transducer axis). Analogous to the ultrasonic Doppler effect, the PA Doppler (PAD) effect was observed and utilized in axial speed measurement (87; 88). The PAD shift in a clear medium is expressed as
| (36) |
where f0 denotes the optical modulation frequency, vp is the flow speed of the particles, vs is the speed of sound in the medium, and θ is the angle between the flow direction and the acoustic wave propagation direction. This frequency shift equals half of that in pulse-echo Doppler ultrasound and does not depend on the direction of laser illumination.
Due to the CW excitation, the single-frequency PAD approach cannot readily provide the depth resolution. To overcome this problem, a recent study proposed a pulsed PA Doppler (PPAD) flowmetry method (89), measuring the change in the time-of-arrival of successive PA waves emitted by a moving cluster of absorbers by using time-domain cross-correlation of PA waveform pairs generated within the acoustic focus using pairs of light pulses. PPAD is analogous to the CW PAD method except that the flow speed is now proportional to a fractional time shift rather than a frequency shift. Owing to the adoption of pulsed excitation, PPAD offers depth-resolved measurements with high spatial resolution.
However, in the case that the transverse flow speed component dominates, the original PAD method fails because the transverse speed component does not contribute to the frequency shift. An alternative is based on the Doppler broadening of bandwidth, an effect due to the frequency difference between the extremities of the received acoustic wavefront from an absorber moving orthogonal to the transducer axis (90). The broadening parameter BD can be derived from the autocorrelation function of sequential A-scans, which were captured when the same type of absorbers passed through the laser focus:
| (37) |
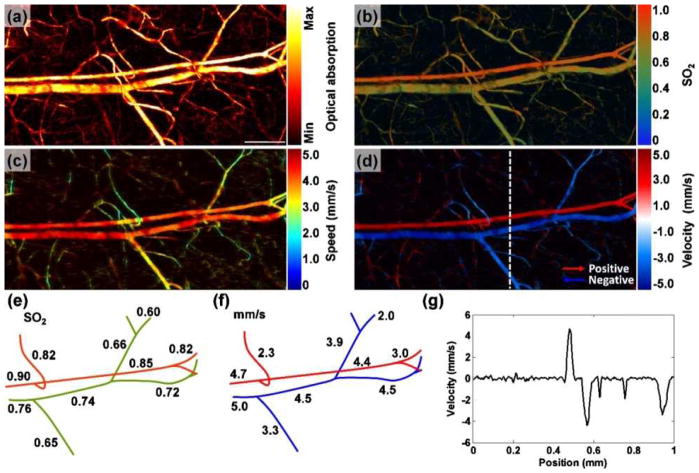
where t is the flight time in the A-scan signal, Aj is the jth A-scan signal, T is the time interval between adjacent A-scans, n is the number of sequential A-scans used for Doppler calculation, and K is a calibration factor. A linear dependence of the broadening parameter on the flow speed was validated, and the compatibility of this method with high-resolution PAM was demonstrated in vivo (Fig. 11). The maximum detectable flow speed was 7.4 mm/s, limited by the laser repetition rate; while the minimum detectable flow speed was 0.1 mm/s, limited by the SNR (90).
Fig. 11.
PA imaging of sO2 and blood flow in a mouse ear. Maximum amplitude projection (MAP) image of (a) a structure and (b) sO2. Scale bar, 250 μm. MAP image of blood flow (c) speed and (d) velocity with directions. (e) Trace of sO2 and (f) blood flow speeds along the main vascular trunk. (g) Velocity profile indicated by the dashed line in (d). Reprint with permission from Ref. (90).
The PA flowmetry is superior to other Doppler-effect-based methods, such as functional OCT (91) or Doppler ultrasonography (92), in blood flow measurement because PA provides unique 100% optical absorption contrast (8) while purely optical or ultrasonic approaches depend on optical or ultrasonic scattering, respectively. Functional OCT and Doppler ultrasonography thus suffer from a lack of sensitivity to red blood cells (RBC), especially in measuring slow blood flow (<1 mm/s). Slowly flowing RBCs yield small Doppler shifts or bandwidth broadening, which are easily obscured by the phase noise as in OCT (93) or motion of surrounding tissue as in ultrasonography (94). In Doppler ultrasonography, to some extent one could improve by employing high frequency ultrasound to increase scattering at the expense of penetration. For these reasons, the PA flowmetry is particularly advantageous in the measurement of low blood flow velocities in the microvasculature (89).
For extremely slow flow measurement, PA correlation spectroscopy (PCS) was exploited due to its high detection sensitivity (95; 96). PCS was inspired by its optical counterpart — fluorescence correlation spectroscopy, and measures PA signal fluctuations within the laser focus volume. The autocorrelation function is defined as
| (38) |
where δp(t) = p(t) − 〈p(t)〉 is the fluctuation of PA signal p(t), and 〈p(t)〉 denotes an ensemble average. The temporal decay profile of the autocorrelation function reveals absorbers’ dwell time, which is inversely proportional to the flow speed. The measurable flow speed range was from 14.9 μm/s to 249 μm/s (95).
4.4. In vivo photoacoustic flow cytometry
PA flow cytometry (PAFC) refers to the time-resolved detection of circulating absorbing objects, e.g., tumor cells, by means of photoacoustic sensing (97–99). Compared to conventional flow cytometry using scattering or fluorescent detection, PAFC has an advantage of not requiring extraction of cells from a living system, thereby allowing a long-term study of cells in their natural biological environment.
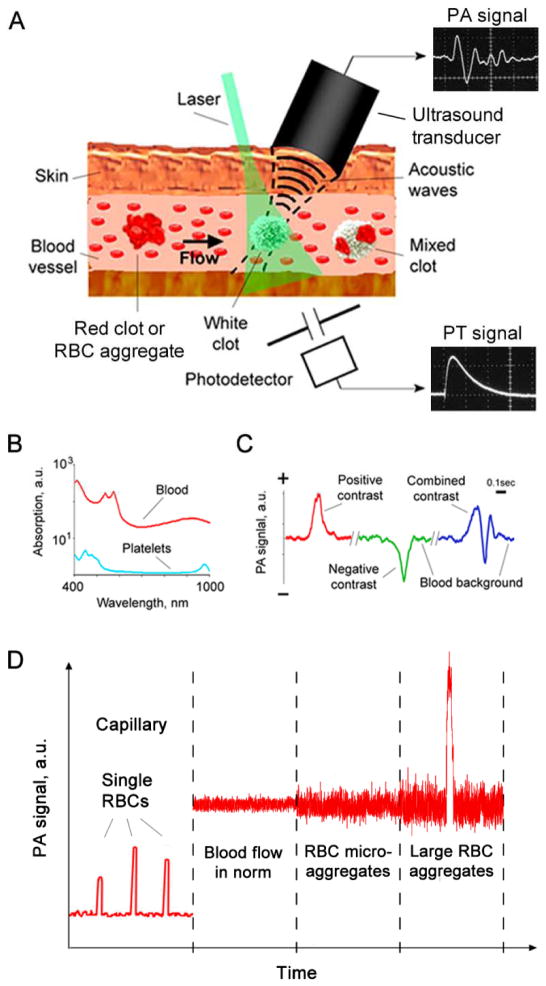
The operation principle of in vivo PAFC is based on the excitation of selected vessels with a pulsed laser, followed by the time-resolved measurement of PA signals with an ultrasonic transducer gently held against the skin (Fig. 1). Analogous to the laminar flow chamber in in vitro flow cytometry, here the blood or lymph vessels function as natural tubes with cell flow. As shown in Fig. 1(b), since the irradiation of blood vessels creates a constant PA background, the contrasts in PAFC can be either positive or negative. The positive contrast in PAFC can be used to detect higher absorption targets than red blood cells (RBCs) such as melanoma cells (100) or cells labeled with nanoparticles (99), while the negative contrast can be used to sense lower absorption targets as in the case of platelets or white blood cells.
A potential application of PAFC is in vivo detection of circulating tumor cells (CTCs). The spread of cancer among organs, a process known as metastasis, is the primary factor that causes cancer death. Detection of CTCs plays a critical role in evaluating metastasis as well as cancer recurrence and therapeutic efficacy (101). However, conventional in vitro diagnosis is not sensitive enough due to the limited volumes of blood samples. In contrast, PAFC has a capability of measuring a blood volume up to a patient’s entire blood volume in vivo, resulting in a significant improvement in sensitivity (102).
The major challenge of using PAFC in detecting CTCs is the suppression of strong PA background from blood, which can easily mask the signals from rare cell types. A recently developed imaging technique, magnetomotive PAFC, provided a solution through the magnetic accumulation and manipulation of cells targeted with magneto-sensitive contrast agents (103–105). With an effective magnetic trapping system, the targeted cells were accumulated, manipulated, and then differentiated from the non-magnetic background by motion filtering. This approach is of particular interest for clinical applications because it can sample large blood volumes in a short time while providing real-time readout.
4.5 Forster resonance energy transfer photoacoustic microscopy
Forster resonance energy transfer (FRET) microscopy (106) is routinely used in modern biological research. However, due to light scattering, the achievable penetration depth of FRET in biological tissue is usually less than 1 mm, limiting their application for in vivo studies. To realize deep tissue FRET imaging, a recent study combined FRET with PAT, yielding a new imaging modality– FRET-PAM (107; 108).
FRET-PAM utilizes a donor fluorophore and a non-fluorescent acceptor chromophore as a FRET pair. The emission spectrum of the donor overlaps considerably with the absorption spectrum of the acceptor, resulting in a non-radiative energy transfer when their distance is within 10 nm. Since the acceptor is non-fluorescent, the energy of the acceptor is released primarily via thermal dissipation, generating PA signals which are then detected by an ultrasonic transducer in the far field. Phantom results showed that PAM can be used to image FRET efficiencies through 1-cm-thick skin tissue (108).
4.6 Stimulated Raman photoacoustic microscopy
Akin to FRET microscopy, the imaging depth of conventional stimulated Raman (SR) microscopy is also limited by light diffusion (109). The recent marriage of SR with PAM offers an ideal solution to this problem (110). In SR-PAM, by utilizing two excitation laser pulses (pump, ωp and Stokes, ωs), separated in frequency by the vibrational frequency of a targeted molecule, only a specific vibrational band is excited. The energy of this excitation state is partially transferred into heat, yielding PA signals which are then detected by an ultrasonic transducer. Benefit from low acoustic scattering, one millimeter penetration depth has been reported in an in vivo SR imaging experiment (111).
5. Technical advances from bench to bedside
Translational PAT has attracted growing interest in the past decade. The major applications are breast cancer imaging (52; 112–114), brain imaging (115), and sentinel lymph node mapping (116; 117). In this section, the recent technical developments in these three areas are reviewed, and the current progress towards other clinical use is discussed.
5.1 Breast imaging
Breast cancer is the most common cancer in women and the second leading cause of cancer death in women. Early diagnosis is crucial for the cure and survival of breast cancer. Conventional screening methods rely on x-ray mammography and ultrasonography; however, x-ray mammography suffers ionizing hazard and insensitivity to tumors in dense breasts, while ultrasonography is insensitive to breast cancer at an early stage due to low acoustic contrast.
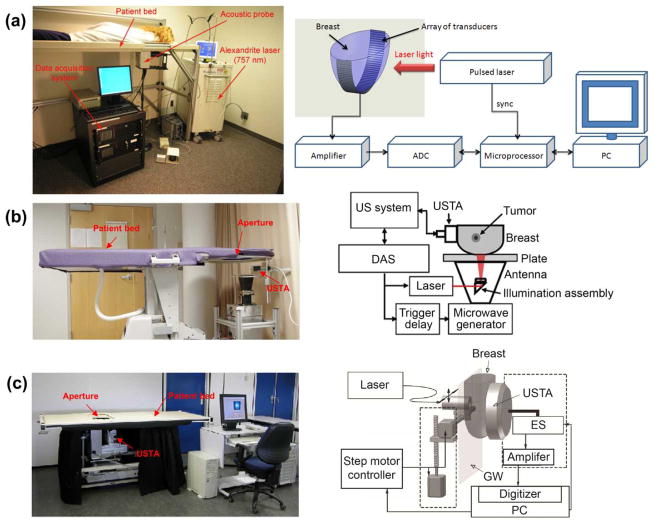
Breast imaging is one of the first niche clinical applications of PAT due to its great potential to overcome the limitations of x-ray mammography and ultrasonography. Three representative instruments, LOIS-64 (112), modified Philips iU22 (118), and Twente PA mammoscope (114; 119) are shown in Fig. 13 (a)–(c), respectively. All three systems have a similar patient-instrument interface — they were built into a hospital bed, and require a patient lying prone on the bed with her breast pendant through the aperture in the bed for imaging.
Fig. 13.
Clinical PAT platforms for human breast imaging. (a) LOIS-64 PAT system (112). (b) the modified Philips iU22 system (118). (c) Twente PA mammoscope (119). ADC, analog to digital convertor; DAS, data acquisition system; ES, element selection; GW, glass window; MP, microprocessor; USTA, ultrasonic transducer array. Reprint with permission from Refs. (112; 118; 119).
The LOIS-64 PAT system detects PA signals with an arc-shaped array of ultrasonic transducers (64 elements, 2.5 MHz bandwidth). The illumination with a wide laser beam orthogonal to the transducer array allows small variations of optical fluence within an area of interest, which is essential for high-quality PA imaging. The lateral resolution of the LOIS-64 system was reported as 0.5 mm (112).
The modified Philips iU22 is the first clinical system that integrates PA, thermoacoustic and ultrasound imaging, providing multiple, complementary contrasts for breast cancer diagnosis (118). The light delivery system and microwave antenna are assembled into one module, allowing a mechanical-free switch operation between PA and thermoacoustic imaging. A linear ultrasonic transducer array (80 elements, 5 MHz bandwidth) is used to acquire ultrasound, PA, and thermoacoustic images. The lateral and axial resolutions of the modified Philips iU22 system are 0.72 mm and 3.5 mm, respectively.
Twente PA mammoscope uses a flat ultrasonic transducer array (590 elements, 1 MHz bandwidth) in a parallel plate configuration. The light delivery system scans across the surface of a breast through a glass window. A mild compression is required between the glass window and the detector matrix to obtain a uniform thickness of the breast and a good acoustic contact with the detector. The lateral resolution ranges from 3.1 mm to 4.4 mm, while the axial resolution ranges from 3.2 mm to 3.9 mm (119).
5.2 Brain imaging
Currently, the major imaging modalities for human brain imaging include X-ray computed tomography (CT), magnetic resonance imaging (MRI), and ultrasound. CT uses ionizing radiation, and MRI uses a strong magnetic field, leading to a costly setup. Ultrasonography can be used only in pediatric brain imaging before the closure of the fontanel. In contrast, PAT is less costly, and allows a superior penetration depth and functional sensitivity.
The major challenges for PAT brain imaging are the effective delivery of light through the skull and the correction for skull-induced acoustic aberrations. A skull is a highly scattering medium, attenuating both illumination light and acoustic signals. Although PAT of the brain through a skull was well conducted on monkeys (120; 121) and an infant (122), not until very recently, were the feasibility of imaging through adult skulls demonstrated (115). Since an adult skull is much thicker (~ 7 mm) than a monkey skull or an infant, the attenuation of light becomes more severe — only ~ 2% of photons can pass through (115). To maximize the transmitted photons, a photon recycler was designed to reflect back the scattered photons from the surface (115). With a 1-MHz spherically focused transducer that circularly scanned the skull at 200 positions, a spatial resolution of 1 mm and an SNR of 2.4 were achieved in an ex vivo experiment (115). However, due to the acoustic velocity mismatch and mode conversion between the skull and the coupling medium, the reconstructed PAT images were blurred. An advanced reconstruction algorithm has been developed to compensate for skull-induced acoustic aberrations and improve image fidelity with the help of adjunct CT images (123).
5.3 Sentinel lymph node mapping
Sentinel lymph node (SLN) biopsy is a preferred method for axillary lymph node staging of breast cancer patients. Ultrasound guidance of minimally invasive interventions is widely performed, resulting in improved treatment outcomes and shorter recovery. However, ultrasonography cannot provide a sufficient contrast to identify SLN, reducing the sensitivity of ultrasound-guided fine needle aspiration biopsy (124).
To take advantage of the high sensitivity of PAT to optical absorption, a handheld array-based PAT probe was developed for SLN mapping (116; 117). The system was built upon a clinical ultrasound system (iU22, Philips Healthcare) with an integrated fiber bundle illumination, allowing handheld scanning operation as in ultrasonography. The two illumination optical beams are obliquely incident on the tissue surface as rectangles. The PA signals are detected by a linear array ultrasound probe (L8-4, Philips Healthcare) with a nominal bandwidth of 4 to 8 MHz. By using this probe, the accumulation of an optical dye in the SLN, which was 2 cm below the tissue surface, was identified in a rat SLN mapping experiment (117).
5.4 Current progress towards clinical use
Breast PAT imaging is now in the phase of clinical application. By using the Twente photoacoustic mammoscope, the PAT images in 4 of 6 cases of patients with symptomatic breasts revealed higher intensity regions attributed by tumor-associated vascular distributions (125). A subsequent research further investigated the clinical feasibility of the PA mammography in a larger group of patients with different types of breast lesions (114). In all ten PAT measurements on patients, a confined region with a high contrast with respect to the background was observed, indicating the existence of malignant lesions. The removal of imaging artifacts contributed by the skin surface signal was also discussed, suggesting dark-field light delivery and multi-view detection would probably help.
PAT of SLN mapping using methylene blue also started being tested clinically for breast cancer patients. Preliminary data demonstrated that PAT has both the required penetration depth and spatial resolution for SLN mapping (126; 127), enabling a clinician to use non-invasive diagnostic methods to stage the axilla without the morbidity of a surgery. Since the contrast agent methylene blue has already been used in clinical SLN biopsy, potentially an expedited FDA approval for a new optical contrast agent would significantly accelerate the translation of PAT into the clinic.
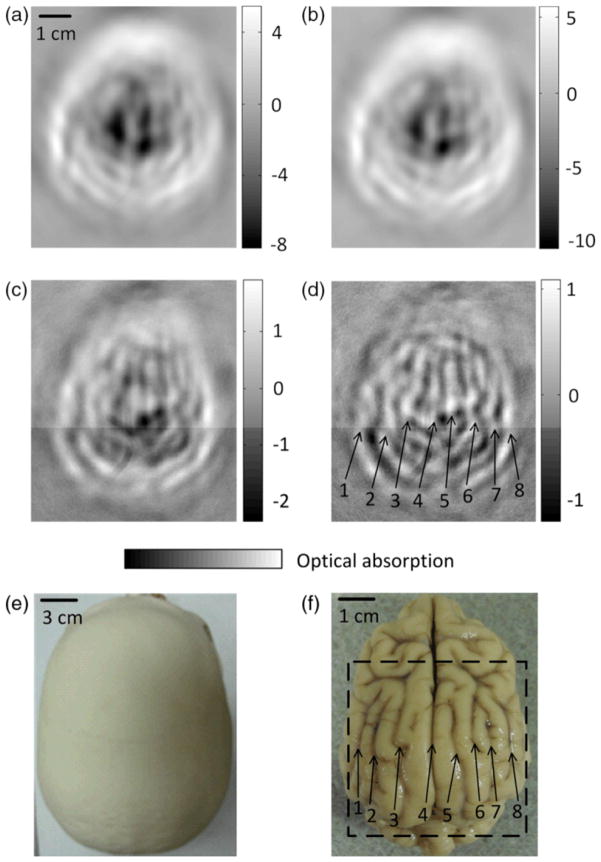
Currently, PAT imaging of the human brain is still in the pre-clinical study phase. However, promising improvements have been achieved in the past few years, raising confidence that PAT can be potentially a highly useful clinical tool for noninvasive functional brain imaging (115; 121; 123). Fig. 14 shows a representative work which demonstrated the feasibility of PAT through an intact human adult skull (115). Main brain cortical features were observable in the PAT images, and were in good agreement with the corresponding features in the photograph.
Fig. 14.
PAT of a canine brain through a whole adult human skull. (a) PAT image of the human skull only. (b) PAT image of a canine brain acquired through the human skull. (c) Differential image of (b) and (a). (d) Image from (c) after high-pass filtering. (e) Photograph of the human skull from a top view. (f) Photograph of the canine brain cortex. Reprint with permission from Ref. (115).
6. Conclusions and Outlook
In summary, PAT has broad applications from laboratory research to clinical patient care, yet future endeavors are still needed to further mature this technology. In this review, both fundamental principles of PAT and its state-of-art implementation and applications were discussed. However, an important topic that was not covered here is the development of exogenous contrast agents for biomedical PAT. One may refer to a more specific article for this topic (128).
The measurement of metabolic rate of oxygen (MRO2) emerges as a spotlight of PAT. MRO2 quantifies metabolism and thus is crucial for screening and treatment of metabolic diseases, particularly cancers and cerebral disorders. Accurate calculation of MRO2 requires measuring three parameters: cross section of blood vessels, concentration of oxy-hemoglobin, and blood flow velocity. It is fortuitous that PAT can simultaneously measure all these independent parameters, allowing a complete assessment of MRO2 on a single imaging modality. The PAT measurement of MRO2 in humans is expected to have a profound impact on studies of tumor metabolism and neovascularization.
MRO2: the amount of oxygen consumed in a given tissue region per unit time per 100 g of tissue or of the organ of interest.
Multimodality imaging integrating PAT with other complementary imaging techniques, e.g., fluorescence, ultrasound, and optical coherent tomography (OCT), will shed new light on biomedicine. PAT is sensitive to optical absorption contrasts with a preferably low fluorescent quantum yield, while fluorescence imaging provides excellent contrasts for chromophores with a high fluorescent quantum yield. Integration of PAT with fluorescence imaging facilitates studies on, for example, the effect of drugs on both cells and their surrounding microvasculature (129). While PAT provides high detection sensitivity to optical absorption, ultrasonography and OCT provide complementary morphologic information based on acoustic and optical scattering, respectively. Combining PAT with ultrasonography or OCT will be highly useful in clinical diagnosis (116; 130; 131). Particularly in human brain imaging, the ultrasound images of the skull can be potentially employed to correct for skull-induced acoustic aberrations, thereby improving the image quality of PAT.
Non-invasive quantitative imaging will become a mainstream of PAT. The physical quantity that PAT directly measures is the specific optical absorption (absorbed energy per unit volume) rather than the absorption coefficient. To accurately estimate the absorption coefficient, the laser fluence within tissue must be quantified first. Quantitative PAT employing non-invasive techniques, such as diffuse optical tomography or transport optical tomography, to estimate the fluence distribution will open up new areas of investigation for in vivo tissue imaging applications.
Fig. 12.
PA flow cytometry. (a) Schematic. (b) Absorption spectra of whole blood (red) and platelet-rich plasma (blue). (c) Example of PA positive, negative, and combined contrasts from circulating clots of different compositions. (d) PA signal trace dynamics obtained with PA fluctuation flow cytometry in different vessels in normal and pathological conditions leading to RBC aggregation. Reprint with permission from Ref. (97).
Acknowledgments
We thank Yan Liu and Sandra Matteucci for close reading of the manuscript. This work was sponsored by the National Institutes of Health (NIH) under grants R01 EB008085, R01 EB016963, R01 CA134539, U54 CA136398, R01 CA157277, R01 CA159959, and DP1 EB016986 (NIH Director’s Pioneer Award). L. V. Wang has a financial interest in Microphotoacoustics, Inc. and Endra, Inc.; however, neither provided support for this work.
Contributor Information
Lihong V. Wang, Email: LHWANG@WUSTL.EDU, Optical Imaging Laboratory, Department of Biomedical Engineering, Washington University in St. Louis.
Liang Gao, Email: GAOL@WUSTL.EDU, Optical Imaging Laboratory, Department of Biomedical Engineering, Washington University in St. Louis.
References
- 1.Bell AG. On the production and reproduction of sound by light. Am J Sci. 1880;20:305–24. [Google Scholar]
- 2.Wang LV. Photoacoustic imaging and spectroscopy. xx. Boca Raton: CRC; 2009. p. 499. [Google Scholar]
- 3.Gusev VE, Karabutov AA. Laser optoacoustics. xvii. New York: American Institute of Physics; 1993. p. 271. [Google Scholar]
- 4.Maugh TH. Photoacoustic Spectroscopy - New Uses for an Old Technique. Science. 1975;188:38–9. doi: 10.1126/science.188.4183.38. [DOI] [PubMed] [Google Scholar]
- 5.Kruger RA. Photoacoustic Ultrasound. Med Phys. 1994;21:127–31. doi: 10.1118/1.597367. [DOI] [PubMed] [Google Scholar]
- 6.Wang LHV, Zhao XM, Sun HT, Ku G. Microwave-induced acoustic imaging of biological tissues. Rev Sci Instrum. 1999;70:3744–8. [Google Scholar]
- 7.Wang XD, Pang YJ, Ku G, Xie XY, Stoica G, Wang LHV. Noninvasive laser-induced photoacoustic tomography for structural and functional in vivo imaging of the brain. Nat Biotechnol. 2003;21:803–6. doi: 10.1038/nbt839. [DOI] [PubMed] [Google Scholar]
- 8.Wang LV. Tutorial on photoacoustic microscopy and computed tomography. Ieee J Sel Top Quant. 2008;14:171–9. [Google Scholar]
- 9.Hordvik A. Measurement Techniques for Small Absorption-Coefficients - Recent Advances. Appl Optics. 1977;16:2827–33. doi: 10.1364/AO.16.002827. [DOI] [PubMed] [Google Scholar]
- 10.Wang LHV, Hu S. Photoacoustic Tomography: In Vivo Imaging from Organelles to Organs. Science. 2012;335:1458–62. doi: 10.1126/science.1216210. [DOI] [PMC free article] [PubMed] [Google Scholar]
- 11.Culver* JP, Ntziachristos* V, Holboke MJ, Yodh AG. Optimization of optode arrangements for diffuse optical tomography: A singular-value analysis. Opt Lett. 2001;26:701–3. doi: 10.1364/ol.26.000701. [DOI] [PubMed] [Google Scholar]
- 12.Calasso IG, Craig W, Diebold GJ. Photoacoustic point source. Phys Rev Lett. 2001;86:3550–3. doi: 10.1103/PhysRevLett.86.3550. [DOI] [PubMed] [Google Scholar]
- 13.Diebold GJ, Khan MI, Park SM. Photoacoustic Signatures of Particulate Matter - Optical Production of Acoustic Monopole Radiation. Science. 1990;250:101–4. doi: 10.1126/science.250.4977.101. [DOI] [PubMed] [Google Scholar]
- 14.Diebold GJ, Sun T, Khan MI. Photoacoustic monopole radiation in one, two, and three dimensions. Phys Rev Lett. 1991;67:3384–7. doi: 10.1103/PhysRevLett.67.3384. [DOI] [PubMed] [Google Scholar]
- 15.Roitner H, Bauer-Marschallinger J, Berer T, Burgholzer P. Experimental evaluation of time domain models for ultrasound attenuation losses in photoacoustic imaging. The Journal of the Acoustical Society of America. 2012;131:3763–74. doi: 10.1121/1.3699194. [DOI] [PubMed] [Google Scholar]
- 16.Wang LV, Wu H-i. Biomedical optics: principles and imaging. xiv. Hoboken, N.J: Wiley-Interscience; 2007. p. 362. [Google Scholar]
- 17.Szabo TL. Diagnostic ultrasound imaging: inside out. xxii. Amsterdam; Boston: Elsevier Academic Press; 2004. p. 549. [Google Scholar]
- 18.Burgholzer P, Roitner H, Bauer-Marschallinger J, Grün H, Berer T, Paltauf G. Compensation of Ultrasound Attenuation in Photoacoustic Imaging. In: Beghi MG, editor. Acoustic Waves - From Microdevices to Helioseismology. InTech; 2011. Number of. [Google Scholar]
- 19.Huang C, Nie L, Schoonover RW, Wang LV, Anastasio MA. Photoacoustic computed tomography correcting for heterogeneity and attenuation. J Biomed Opt. 2012;17:061211–1. doi: 10.1117/1.JBO.17.6.061211. [DOI] [PMC free article] [PubMed] [Google Scholar]
- 20.Maslov K, Wang LV. Photoacoustic imaging of biological tissue with intensity-modulated continuous-wave laser. J Biomed Opt. 2008:13. doi: 10.1117/1.2904965. [DOI] [PubMed] [Google Scholar]
- 21.Telenkov S, Mandelis A, Lashkari B, Forcht M. Frequency-domain photothermoacoustics: Alternative imaging modality of biological tissues. J Appl Phys. 2009:105. [Google Scholar]
- 22.Telenkov SA, Mandelis A. Photothermoacoustic imaging of biological tissues: maximum depth characterization comparison of time and frequency-domain measurements. J Biomed Opt. 2009:14. doi: 10.1117/1.3200924. [DOI] [PubMed] [Google Scholar]
- 23.Telenkov SA, Mandelis A. Fourier-domain methodology for depth-selective photothermoacoustic imaging of tissue chromophores. Eur Phys J-Spec Top. 2008;153:443–8. [Google Scholar]
- 24.Telenkov S, Alwi R, Mandelis A, Worthington A. Frequency-domain photoacoustic phased array probe for biomedical imaging applications. Opt Lett. 2011;36:4560–2. doi: 10.1364/OL.36.004560. [DOI] [PubMed] [Google Scholar]
- 25.Karabutov AA, Savateeva EV, Podymova NB, Oraevsky AA. Backward mode detection of laser-induced wide-band ultrasonic transients with optoacoustic transducer. J Appl Phys. 2000;87:2003–14. [Google Scholar]
- 26.Andreev VG, Karabutov AA, Oraevsky AA. Detection of ultrawide-band ultrasound pulses in optoacoustic tomography. Ultrasonics, Ferroelectrics and Frequency Control, IEEE Transactions on. 2003;50:1383–90. doi: 10.1109/tuffc.2003.1244756. [DOI] [PubMed] [Google Scholar]
- 27.America LIo. American National Standard for Safe Use of Lasers. New York: American National Standards Institute; 2000. ANSI Z136.1-2000. [Google Scholar]
- 28.Zhu H, Isikman SO, Mudanyali O, Greenbaum A, Ozcan A. Optical imaging techniques for point-of-care diagnostics. Lab Chip. 2013 doi: 10.1039/c2lc40864c. [DOI] [PMC free article] [PubMed] [Google Scholar]
- 29.Maslov K, Zhang HF, Hu S, Wang LV. Optical-resolution photoacoustic microscopy for in vivo imaging of single capillaries. Optics Letters. 2008;33:929–31. doi: 10.1364/ol.33.000929. [DOI] [PubMed] [Google Scholar]
- 30.Hu S, Maslov K, Wang LV. Second-generation optical-resolution photoacoustic microscopy with improved sensitivity and speed. Optics Letters. 2011;36:1134–6. doi: 10.1364/OL.36.001134. [DOI] [PMC free article] [PubMed] [Google Scholar]
- 31.Wang LD, Maslov K, Yao JJ, Rao B, Wang LHV. Fast voice-coil scanning optical-resolution photoacoustic microscopy. Optics Letters. 2011;36:139–41. doi: 10.1364/OL.36.000139. [DOI] [PMC free article] [PubMed] [Google Scholar]
- 32.Yao JJ, Huang CH, Wang LD, Yang JM, Gao L, et al. Wide-field fast-scanning photoacoustic microscopy based on a water-immersible MEMS scanning mirror. J Biomed Opt. 2012:17. doi: 10.1117/1.JBO.17.8.080505. [DOI] [PMC free article] [PubMed] [Google Scholar]
- 33.Zhang C, Maslov K, Hu S, Chen R, Zhou Q, et al. Reflection-mode submicron-resolution in vivo photoacoustic microscopy. J Biomed Opt. 2012;17:020501–4. doi: 10.1117/1.JBO.17.2.020501. [DOI] [PMC free article] [PubMed] [Google Scholar]
- 34.Zhang C, Maslov K, Wang LHV. Subwavelength-resolution label-free photoacoustic microscopy of optical absorption in vivo. Optics Letters. 2010;35:3195–7. doi: 10.1364/OL.35.003195. [DOI] [PMC free article] [PubMed] [Google Scholar]
- 35.Yuan Y, Yang S, Xing D. Optical-resolution photoacoustic microscopy based on two-dimensional scanning galvanometer. Appl Phys Lett. 2012;100:023702–3. [Google Scholar]
- 36.Zhang C, Maslov K, Yao J, Wang LV. In vivo photoacoustic microscopy with 7.6-μm axial resolution using a commercial 125-MHz ultrasonic transducer. J Biomed Opt. 2012;17:116016. doi: 10.1117/1.JBO.17.11.116016. [DOI] [PMC free article] [PubMed] [Google Scholar]
- 37.Liu Y, Zhang C, Wang LV. Effects of light scattering on optical-resolution photoacoustic microscopy. J Biomed Opt. 2012;17:126014. doi: 10.1117/1.JBO.17.12.126014. [DOI] [PMC free article] [PubMed] [Google Scholar]
- 38.Yao DK, Maslov K, Shung KK, Zhou QF, Wang LV. In vivo label-free photoacoustic microscopy of cell nuclei by excitation of DNA and RNA. Optics Letters. 2010;35:4139–41. doi: 10.1364/OL.35.004139. [DOI] [PMC free article] [PubMed] [Google Scholar]
- 39.Wang LD, Maslov K, Xing WX, Garcia-Uribe A, Wang LHV. Video-rate functional photoacoustic microscopy at depths. J Biomed Opt. 2012:17. doi: 10.1117/1.JBO.17.10.106007. [DOI] [PMC free article] [PubMed] [Google Scholar]
- 40.Zhang HF, Maslov K, Stoica G, Wang LHV. Functional photoacoustic microscopy for high-resolution and noninvasive in vivo imaging. Nat Biotechnol. 2006;24:848–51. doi: 10.1038/nbt1220. [DOI] [PubMed] [Google Scholar]
- 41.Maslov K, Stoica G, Wang LV. In vivo dark-field reflection-mode photoacoustic microscopy. Opt Lett. 2005;30:625–7. doi: 10.1364/ol.30.000625. [DOI] [PubMed] [Google Scholar]
- 42.Hu S, Maslov K, Wang VL. Three-Dimensional Optical-Resolution Photoacoustic Microscopy. In: Liang R, editor. Biomedical optical imaging technologies: design and applications. New York, NY: Springer Berlin Heidelberg; 2012. Number of. [Google Scholar]
- 43.Song KH, Wang LV. Deep reflection-mode photoacoustic imaging of biological tissue. J Biomed Opt. 2007;12:060503. doi: 10.1117/1.2818045. [DOI] [PubMed] [Google Scholar]
- 44.Xu Y, Wang LV, Ambartsoumian G, Kuchment P. Reconstructions in limited-view thermoacoustic tomography. Med Phys. 2004;31:724–33. doi: 10.1118/1.1644531. [DOI] [PubMed] [Google Scholar]
- 45.Xu MH, Wang LHV. Photoacoustic imaging in biomedicine. Rev Sci Instrum. 2006:77. [Google Scholar]
- 46.Xu MH, Wang LHV. Universal back-projection algorithm for photoacoustic computed tomography. Phys Rev E. 2005:71. doi: 10.1103/PhysRevE.71.016706. [DOI] [PubMed] [Google Scholar]
- 47.Song L, Maslov K, Bitton R, Shung KK, Wang LV. Fast 3-D dark-field reflection-mode photoacoustic microscopy in vivo with a 30-MHz ultrasound linear array. J Biomed Opt. 2008:13. doi: 10.1117/1.2976141. [DOI] [PMC free article] [PubMed] [Google Scholar]
- 48.Buehler A, Herzog E, Razansky D, Ntziachristos V. Video rate optoacoustic tomography of mouse kidney perfusion. Optics Letters. 2010;35:2475–7. doi: 10.1364/OL.35.002475. [DOI] [PubMed] [Google Scholar]
- 49.Razansky D, Buehler A, Ntziachristos V. Volumetric real-time multispectral optoacoustic tomography of biomarkers. Nat Protoc. 2011;6:1121–9. doi: 10.1038/nprot.2011.351. [DOI] [PubMed] [Google Scholar]
- 50.Gamelin J, Maurudis A, Aguirre A, Huang F, Guo PY, et al. A real-time photoacoustic tomography system for small animals. Optics Express. 2009;17:10489–98. doi: 10.1364/oe.17.010489. [DOI] [PMC free article] [PubMed] [Google Scholar]
- 51.Xia J, Chatni MR, Maslov K, Guo ZJ, Wang K, et al. Whole-body ring-shaped confocal photoacoustic computed tomography of small animals in vivo. J Biomed Opt. 2012:17. doi: 10.1117/1.JBO.17.5.050506. [DOI] [PMC free article] [PubMed] [Google Scholar]
- 52.Kruger RA, Lam RB, Reinecke DR, Del Rio SP, Doyle RP. Photoacoustic angiography of the breast. Med Phys. 2010;37:6096–100. doi: 10.1118/1.3497677. [DOI] [PMC free article] [PubMed] [Google Scholar]
- 53.Yang JM, Maslov K, Yang HC, Zhou QF, Shung KK, Wang LHV. Photoacoustic endoscopy. Optics Letters. 2009;34:1591–3. doi: 10.1364/ol.34.001591. [DOI] [PMC free article] [PubMed] [Google Scholar]
- 54.Yang JM, Favazza C, Chen RM, Yao JJ, Cai X, et al. Simultaneous functional photoacoustic and ultrasonic endoscopy of internal organs in vivo. Nat Med. 2012;18:1297. doi: 10.1038/nm.2823. [DOI] [PMC free article] [PubMed] [Google Scholar]
- 55.Paltauf G, Nuster R, Haltmeier M, Burgholzer P. Photoacoustic tomography using a Mach-Zehnder interferometer as an acoustic line detector. Appl Optics. 2007;46:3352–8. doi: 10.1364/ao.46.003352. [DOI] [PubMed] [Google Scholar]
- 56.Nuster R, Zangerl G, Haltmeier M, Paltauf G. Full field detection in photoacoustic tomography. Optics Express. 2010;18:6288–99. doi: 10.1364/OE.18.006288. [DOI] [PubMed] [Google Scholar]
- 57.Nuster R, Gruen H, Reitinger B, Burgholzer P, Gratt S, et al. Downstream Fabry-Perot interferometer for acoustic wave monitoring in photoacoustic tomography. Optics Letters. 2011;36:981–3. doi: 10.1364/OL.36.000981. [DOI] [PubMed] [Google Scholar]
- 58.Nuster R, Gratt S, Passler K, Meyer D, Paltauf G. Photoacoustic section imaging using an elliptical acoustic mirror and optical detection. J Biomed Opt. 2012:17. doi: 10.1117/1.JBO.17.3.030503. [DOI] [PubMed] [Google Scholar]
- 59.Nuster R, Paltauf G. Real-time photoacoustic imaging with optical ultrasound detection. 2012. 82231K-K. [DOI] [PubMed] [Google Scholar]
- 60.Laufer J, Johnson P, Zhang E, Treeby B, Cox B, et al. In vivo preclinical photoacoustic imaging of tumor vasculature development and therapy. J Biomed Opt. 2012;17:056016–8. doi: 10.1117/1.JBO.17.5.056016. [DOI] [PubMed] [Google Scholar]
- 61.Laufer J, Norris F, Cleary J, Zhang E, Treeby B, et al. In vivo photoacoustic imaging of mouse embryos. J Biomed Opt. 2012;17:061220–8. doi: 10.1117/1.JBO.17.6.061220. [DOI] [PubMed] [Google Scholar]
- 62.Zhang E, Laufer J, Beard P. Backward-mode multiwavelength photoacoustic scanner using a planar Fabry-Perot polymer film ultrasound sensor for high-resolution three-dimensional imaging of biological tissues. Appl Optics. 2008;47:561–77. doi: 10.1364/ao.47.000561. [DOI] [PubMed] [Google Scholar]
- 63.Wang LV. Mechanisms of Ultrasonic Modulation of Multiply Scattered Coherent Light: An Analytic Model. Phys Rev Lett. 2001;87:043903. doi: 10.1103/PhysRevLett.87.043903. [DOI] [PubMed] [Google Scholar]
- 64.Popescu G, Ikeda T, Dasari RR, Feld MS. Diffraction phase microscopy for quantifying cell structure and dynamics. Opt Lett. 2006;31:775–7. doi: 10.1364/ol.31.000775. [DOI] [PubMed] [Google Scholar]
- 65.Xie ZX, Chen SL, Ling T, Guo LJ, Carson PL, Wang XD. Pure optical photoacoustic microscopy. Optics Express. 2011;19:9027–34. doi: 10.1364/OE.19.009027. [DOI] [PMC free article] [PubMed] [Google Scholar]
- 66.Chen SL, Ling T, Guo LJ. Low-noise small-size microring ultrasonic detectors for high-resolution photoacoustic imaging. J Biomed Opt. 2011:16. doi: 10.1117/1.3573386. [DOI] [PMC free article] [PubMed] [Google Scholar]
- 67.Ling T, Chen SL, Guo LJ. High-sensitivity and wide-directivity ultrasound detection using high Q polymer microring resonators. Appl Phys Lett. 2011:98. doi: 10.1063/1.3589971. [DOI] [PMC free article] [PubMed] [Google Scholar]
- 68.Zhang EZ, Beard PC. A miniature all-optical photoacoustic imaging probe. 2011. 78991F-F. [Google Scholar]
- 69.Bateman RM, Sharpe MD, Ellis CG. Bench-to-bedside review: Microvascular dysfunction in sepsis - hemodynamics, oxygen transport, and nitric oxide. Crit Care. 2003;7:359–73. doi: 10.1186/cc2353. [DOI] [PMC free article] [PubMed] [Google Scholar]
- 70.Zhang HF, Maslov K, Sivaramakrishnan M, Stoica G, Wang LHV. Imaging of hemoglobin oxygen saturation variations in single vessels in vivo using photoacoustic microscopy. Appl Phys Lett. 2007:90. [Google Scholar]
- 71.Gao L, Hagen N, Tkaczyk TS. Quantitative comparison between full-spectrum and filter-based imaging in hyperspectral fluorescence microscopy. Journal of Microscopy. 2012;246:113–23. doi: 10.1111/j.1365-2818.2012.03596.x. [DOI] [PMC free article] [PubMed] [Google Scholar]
- 72.Wang Y, Maslov K, Wang LHV. Spectrally encoded photoacoustic microscopy using a digital mirror device. J Biomed Opt. 2012:17. doi: 10.1117/1.JBO.17.6.066020. [DOI] [PMC free article] [PubMed] [Google Scholar]
- 73.Cox B, Laufer JG, Arridge SR, Beard PC. Quantitative spectroscopic photoacoustic imaging: a review. J Biomed Opt. 2012;17:061202. doi: 10.1117/1.JBO.17.6.061202. [DOI] [PubMed] [Google Scholar]
- 74.Daoudi K, Hussain A, Hondebrink E, Steenbergen W. Correcting photoacoustic signals for fluence variations using acousto-optic modulation. Opt Express. 2012;20:14117–29. doi: 10.1364/OE.20.014117. [DOI] [PubMed] [Google Scholar]
- 75.Bauer AQ, Nothdurft RE, Erpelding TN, Wang LHV, Culver JP. Quantitative photoacoustic imaging: correcting for heterogeneous light fluence distributions using diffuse optical tomography. J Biomed Opt. 2011:16. doi: 10.1117/1.3626212. [DOI] [PMC free article] [PubMed] [Google Scholar]
- 76.Li Z, Li H, Zeng Z, Xie W, Chen WR. Determination of optical absorption coefficient with focusing photoacoustic imaging. J Biomed Opt. 2012;17:061216–6. doi: 10.1117/1.JBO.17.6.061216. [DOI] [PubMed] [Google Scholar]
- 77.Guo ZJ, Hu S, Wang LHV. Calibration-free absolute quantification of optical absorption coefficients using acoustic spectra in 3D photoacoustic microscopy of biological tissue. Optics Letters. 2010;35:2067–9. doi: 10.1364/OL.35.002067. [DOI] [PMC free article] [PubMed] [Google Scholar]
- 78.Guo ZJ, Favazza C, Garcia-Uribe A, Wang LHV. Quantitative photoacoustic microscopy of optical absorption coefficients from acoustic spectra in the optical diffusive regime. J Biomed Opt. 2012:17. doi: 10.1117/1.JBO.17.6.066011. [DOI] [PMC free article] [PubMed] [Google Scholar]
- 79.Ray A, Rajian JR, Lee Y-EK, Wang X, Kopelman R. Lifetime-based photoacoustic oxygen sensing in vivo. J Biomed Opt. 2012;17:057004–4. doi: 10.1117/1.JBO.17.5.057004. [DOI] [PMC free article] [PubMed] [Google Scholar]
- 80.Hu S, Maslov K, Wang LHV. Noninvasive label-free imaging of microhemodynamics by optical-resolution photoacoustic microscopy. Optics Express. 2009;17:7688–93. doi: 10.1364/oe.17.007688. [DOI] [PMC free article] [PubMed] [Google Scholar]
- 81.Gao L, Wang L, Li C, Liu Y, Ke H, et al. Single-cell photoacoustic thermometry. J Biomed Opt. 2013;18:026003. doi: 10.1117/1.JBO.18.2.026003. [DOI] [PMC free article] [PubMed] [Google Scholar]
- 82.Gao L, Zhang C, Li C, Wang LV. Intracellular temperature mapping with fluorescence-assisted photoacoustic-thermometry. Appl Phys Lett. 2013;102:193705. doi: 10.1063/1.4807140. [DOI] [PMC free article] [PubMed] [Google Scholar]
- 83.Larina IV, Larin KV, Esenaliev RO. Real-time optoacoustic monitoring of temperature in tissues. J Phys D Appl Phys. 2005;38:2633–9. [Google Scholar]
- 84.Shah J, Park S, Aglyamov S, Larson T, Ma L, et al. Photoacoustic imaging and temperature measurement for photothermal cancer therapy. J Biomed Opt. 2008:13. doi: 10.1117/1.294036. [DOI] [PMC free article] [PubMed] [Google Scholar]
- 85.Pramanik M, Wang LV. Thermoacoustic and photoacoustic sensing of temperature. J Biomed Opt. 2009:14. doi: 10.1117/1.3247155. [DOI] [PMC free article] [PubMed] [Google Scholar]
- 86.Christopher DA, Burns PN, Armstrong J, Foster FS. A high-frequency continuous-wave Doppler ultrasound system for the detection of blood flow in the microcirculation. Ultrasound Med Biol. 1996;22:1191–203. doi: 10.1016/s0301-5629(96)00153-6. [DOI] [PubMed] [Google Scholar]
- 87.Fang H, Maslov K, Wang LV. Photoacoustic doppler effect from flowing small light-absorbing particles. Phys Rev Lett. 2007:99. doi: 10.1103/PhysRevLett.99.184501. [DOI] [PubMed] [Google Scholar]
- 88.Fang H, Maslov K, Wang LV. Photoacoustic Doppler flow measurement in optically scattering media. Appl Phys Lett. 2007:91. [Google Scholar]
- 89.Brunker J, Beard P. Pulsed photoacoustic Doppler flowmetry using time-domain cross-correlation: Accuracy, resolution and scalability. J Acoust Soc Am. 2012;132:1780–91. doi: 10.1121/1.4739458. [DOI] [PubMed] [Google Scholar]
- 90.Yao JJ, Maslov KI, Shi YF, Taber LA, Wang LHV. In vivo photoacoustic imaging of transverse blood flow by using Doppler broadening of bandwidth. Optics Letters. 2010;35:1419–21. doi: 10.1364/OL.35.001419. [DOI] [PMC free article] [PubMed] [Google Scholar]
- 91.Ren HW, Brecke KM, Ding ZH, Zhao YH, Nelson JS, Chen ZP. Imaging and quantifying transverse flow velocity with the Doppler bandwidth in a phase-resolved functional optical coherence tomography. Optics Letters. 2002;27:409–11. doi: 10.1364/ol.27.000409. [DOI] [PubMed] [Google Scholar]
- 92.Yeung KWW. Angle-insensitive flow measurement using Doppler bandwidth. Ieee T Ultrason Ferr. 1998;45:574–80. doi: 10.1109/58.677602. [DOI] [PubMed] [Google Scholar]
- 93.Bouwens A, Szlag D, Szkulmowski M, Bolmont T, Wojtkowski M, Lasser T. Quantitative lateral and axial flow imaging with optical coherence microscopy and tomography. Opt Express. 2013;21:17711–29. doi: 10.1364/OE.21.017711. [DOI] [PubMed] [Google Scholar]
- 94.Heimdal A, Torp H. Ultrasound Doppler measurements of low velocity blood flow: Limitations due to clutter signals from vibrating muscles. Ieee T Ultrason Ferr. 1997;44:873–81. [Google Scholar]
- 95.Chen S-L, Ling T, Huang S-W, Won Baac H, Guo LJ. Photoacoustic correlation spectroscopy and its application to low-speed flow measurement. Opt Lett. 2010;35:1200–2. doi: 10.1364/OL.35.001200. [DOI] [PMC free article] [PubMed] [Google Scholar]
- 96.Chen SL, Xie ZX, Carson PL, Wang XD, Guo LJ. In vivo flow speed measurement of capillaries by photoacoustic correlation spectroscopy. Optics Letters. 2011;36:4017–9. doi: 10.1364/OL.36.004017. [DOI] [PMC free article] [PubMed] [Google Scholar]
- 97.Galanzha EI, Zharov VP. Photoacoustic flow cytometry. Methods. 2012;57:280–96. doi: 10.1016/j.ymeth.2012.06.009. [DOI] [PMC free article] [PubMed] [Google Scholar]
- 98.Zharov VP, Galanzha EI, Shashkov EV, Kim JW, Khlebtsov NG, Tuchin VV. Photoacoustic flow cytometry: principle and application for real-time detection of circulating single nanoparticles, pathogens, and contrast dyes in vivo. J Biomed Opt. 2007:12. doi: 10.1117/1.2793746. [DOI] [PubMed] [Google Scholar]
- 99.Galanzha EI, Shashkov EV, Kelly T, Kim JW, Yang LL, Zharov VP. In vivo magnetic enrichment and multiplex photoacoustic detection of circulating tumour cells. Nat Nanotechnol. 2009;4:855–60. doi: 10.1038/nnano.2009.333. [DOI] [PMC free article] [PubMed] [Google Scholar]
- 100.Galanzha EI, Shashkov EV, Spring PM, Suen JY, Zharov VP. In vivo, Noninvasive, Label-Free Detection and Eradication of Circulating Metastatic Melanoma Cells Using Two-Color Photoacoustic Flow Cytometry with a Diode Laser. Cancer Res. 2009;69:7926–34. doi: 10.1158/0008-5472.CAN-08-4900. [DOI] [PMC free article] [PubMed] [Google Scholar]
- 101.Yu M, Stott S, Toner M, Maheswaran S, Haber DA. Circulating tumor cells: approaches to isolation and characterization. J Cell Biol. 2011;192:373–82. doi: 10.1083/jcb.201010021. [DOI] [PMC free article] [PubMed] [Google Scholar]
- 102.Galanzha EI, Shashkov EV, Tuchin VV, Zharov VP. In vivo multispectral, multiparameter, photoacoustic lymph flow cytometry with natural cell focusing, label-free detection and multicolor nanoparticle probes. Cytom Part A. 2008;73A:884–94. doi: 10.1002/cyto.a.20587. [DOI] [PMC free article] [PubMed] [Google Scholar]
- 103.Xia JJ, Pelivanov I, Wei CW, Hu XG, Gao XH, O’Donnell M. Suppression of background signal in magnetomotive photoacoustic imaging of magnetic microspheres mimicking targeted cells. J Biomed Opt. 2012:17. doi: 10.1117/1.JBO.17.6.061224. [DOI] [PMC free article] [PubMed] [Google Scholar]
- 104.Wei CW, Xia JJ, Pelivanov I, Hu XG, Gao XH, O’Donnell M. Trapping and dynamic manipulation of polystyrene beads mimicking circulating tumor cells using targeted magnetic/photoacoustic contrast agents. J Biomed Opt. 2012:17. doi: 10.1117/1.JBO.17.10.101517. [DOI] [PMC free article] [PubMed] [Google Scholar]
- 105.Wei C-w, Xia J, Pelivanov I, Jia C, Huang S-W, et al. Magnetomotive photoacoustic imaging: in vitro studies of magnetic trapping with simultaneous photoacoustic detection of rare circulating tumor cells. Journal of Biophotonics. 2013:n/a–n/a. doi: 10.1002/jbio.201200221. [DOI] [PMC free article] [PubMed] [Google Scholar]
- 106.Pietraszewska-Bogiel A, Gadella T. FRET microscopy: from principle to routine technology in cell biology. Journal of Microscopy. 2010;241:111–8. doi: 10.1111/j.1365-2818.2010.03437.x. [DOI] [PubMed] [Google Scholar]
- 107.Wang Y, Wang LV. Förster resonance energy transfer photoacoustic microscopy. J Biomed Opt. 2012;17:086007. doi: 10.1117/1.JBO.17.8.086007. [DOI] [PMC free article] [PubMed] [Google Scholar]
- 108.Wang Y, Xia J, Wang LV. Deep-tissue photoacoustic tomography of Förster resonance energy transfer. J Biomed Opt. 2013;18:101316. doi: 10.1117/1.JBO.18.10.101316. [DOI] [PMC free article] [PubMed] [Google Scholar]
- 109.Min W, Freudiger CW, Lu SJ, Xie XS. Coherent Nonlinear Optical Imaging: Beyond Fluorescence Microscopy. Annu Rev Phys Chem. 2011;62:507–30. doi: 10.1146/annurev.physchem.012809.103512. [DOI] [PMC free article] [PubMed] [Google Scholar]
- 110.Yakovlev VV, Zhang HF, Noojin GD, Denton ML, Thomas RJ, Scully MO. Stimulated Raman photoacoustic imaging. P Natl Acad Sci USA. 2010;107:20335–9. doi: 10.1073/pnas.1012432107. [DOI] [PMC free article] [PubMed] [Google Scholar]
- 111.Wang HW, Chai N, Wang P, Hu S, Dou W, et al. Label-Free Bond-Selective Imaging by Listening to Vibrationally Excited Molecules. Phys Rev Lett. 2011:106. doi: 10.1103/PhysRevLett.106.238106. [DOI] [PMC free article] [PubMed] [Google Scholar]
- 112.Ermilov SA, Khamapirad T, Conjusteau A, Leonard MH, Lacewell R, et al. Laser optoacoustic imaging system for detection of breast cancer. J Biomed Opt. 2009:14. doi: 10.1117/1.3086616. [DOI] [PubMed] [Google Scholar]
- 113.Jose J, Manohar S, Kolkman RGM, Steenbergen W, van Leeuwen TG. Imaging of tumor vasculature using Twente photoacoustic systems. Journal of Biophotonics. 2009;2:701–17. doi: 10.1002/jbio.200910025. [DOI] [PubMed] [Google Scholar]
- 114.Heijblom M, Piras D, Xia W, van Hespen JCG, Klaase JM, et al. Visualizing breast cancer using the Twente photoacoustic mammoscope: What do we learn from twelve new patient measurements? Optics Express. 2012;20:11582–97. doi: 10.1364/OE.20.011582. [DOI] [PubMed] [Google Scholar]
- 115.Nie L, Cai X, Maslov K, Garcia-Uribe A, Anastasio MA, Wang LV. Photoacoustic tomography through a whole adult human skull with a photon recycler. J Biomed Opt. 2012;17:110506. doi: 10.1117/1.JBO.17.11.110506. [DOI] [PMC free article] [PubMed] [Google Scholar]
- 116.Erpelding TN, Kim C, Pramanik M, Jankovic L, Maslov K, et al. Sentinel Lymph Nodes in the Rat: Noninvasive Photoacoustic and US Imaging with a Clinical US System. Radiology. 2010;256:102–10. doi: 10.1148/radiol.10091772. [DOI] [PMC free article] [PubMed] [Google Scholar]
- 117.Kim C, Erpelding TN, Maslov K, Jankovic L, Akers WJ, et al. Handheld array-based photoacoustic probe for guiding needle biopsy of sentinel lymph nodes. J Biomed Opt. 2010:15. doi: 10.1117/1.3469829. [DOI] [PMC free article] [PubMed] [Google Scholar]
- 118.Ke H, Erpelding TN, Jankovic L, Liu C, Wang LV. Performance characterization of an integrated ultrasound, photoacoustic, and thermoacoustic imaging system. J Biomed Opt. 2012;17:056010–1. doi: 10.1117/1.JBO.17.5.056010. [DOI] [PMC free article] [PubMed] [Google Scholar]
- 119.Manohar S, Kharine A, van Hespen JCG, Steenbergen W, van Leeuwen TG. The Twente Photoacoustic Mammoscope: system overview and performance. Phys Med Biol. 2005;50:2543–57. doi: 10.1088/0031-9155/50/11/007. [DOI] [PubMed] [Google Scholar]
- 120.Yang XM, Wang LV. Monkey brain cortex imaging by photoacoustic tomography. J Biomed Opt. 2008:13. doi: 10.1117/1.2967907. [DOI] [PubMed] [Google Scholar]
- 121.Nie LM, Guo ZJ, Wang LV. Photoacoustic tomography of monkey brain using virtual point ultrasonic transducers. J Biomed Opt. 2011:16. doi: 10.1117/1.3595842. [DOI] [PMC free article] [PubMed] [Google Scholar]
- 122.Wang XD, Chamberland DL, Xi GH. Noninvasive reflection mode photoacoustic imaging through infant skull toward imaging of neonatal brains. J Neurosci Meth. 2008;168:412–21. doi: 10.1016/j.jneumeth.2007.11.007. [DOI] [PubMed] [Google Scholar]
- 123.Huang C, Nie LM, Schoonover RW, Guo ZJ, Schirra CO, et al. Aberration correction for transcranial photoacoustic tomography of primates employing adjunct image data. J Biomed Opt. 2012:17. doi: 10.1117/1.JBO.17.6.066016. [DOI] [PMC free article] [PubMed] [Google Scholar]
- 124.Koelliker SL, Chung MA, Mainiero MB, Steinhoff MM, Cady B. Axillary lymph nodes: US-guided fine-needle aspiration for initial staging of breast cancer - Correlation with primary tumor size. Radiology. 2008;246:81–9. doi: 10.1148/radiol.2463061463. [DOI] [PubMed] [Google Scholar]
- 125.Manohar S, Vaartjes SE, van Hespen JCG, Klaase JM, van den Engh FM, et al. Initial results of in vivo non-invasive cancer imaging in the human breast using near-infrared photoacoustics. Optics Express. 2007;15:12277–85. doi: 10.1364/oe.15.012277. [DOI] [PubMed] [Google Scholar]
- 126.Kim C, Erpelding TN, Jankovic L, Pashley MD, Wang LHV. Deeply penetrating in vivo photoacoustic imaging using a clinical ultrasound array system. Biomed Opt Express. 2010;1:278–84. doi: 10.1364/BOE.1.000278. [DOI] [PMC free article] [PubMed] [Google Scholar]
- 127.Kim C, Erpelding TN, Jankovic L, Wang LV. Performance benchmarks of an array-based hand-held photoacoustic probe adapted from a clinical ultrasound system for non-invasive sentinel lymph node imaging. Philos T R Soc A. 2011;369:4644–50. doi: 10.1098/rsta.2010.0353. [DOI] [PMC free article] [PubMed] [Google Scholar]
- 128.Luke GP, Yeager D, Emelianov SY. Biomedical Applications of Photoacoustic Imaging with Exogenous Contrast Agents. Ann Biomed Eng. 2012;40:422–37. doi: 10.1007/s10439-011-0449-4. [DOI] [PubMed] [Google Scholar]
- 129.Shao P, Shi W, Hajireza P, Zemp RJ. Integrated micro-endoscopy system for simultaneous fluorescence and optical-resolution photoacoustic imaging. J Biomed Opt. 2012:17. doi: 10.1117/1.JBO.17.7.076024. [DOI] [PubMed] [Google Scholar]
- 130.Jiao SL, Jiang MS, Hu JM, Fawzi A, Zhou QF, et al. Photoacoustic ophthalmoscopy for in vivo retinal imaging. Optics Express. 2010;18:3967–72. doi: 10.1364/OE.18.003967. [DOI] [PMC free article] [PubMed] [Google Scholar]
- 131.Li L, Maslov K, Ku G, Wang LV. Three-dimensional combined photoacoustic and optical coherence microscopy for in vivo microcirculation studies. Opt Express. 2009;17:16450–5. doi: 10.1364/OE.17.016450. [DOI] [PMC free article] [PubMed] [Google Scholar]


