Abstract
Background: It is known that blood flow properties such as low/ oscillatory wall shear stress (WSS), high blood viscosity, low blood velocity and high concentration of low density lipoprotein (LDL) macromolecules, are some of the main flow parameters causing atherosclerosis. Limited research has been undertaken on the pulsatile WSS and WSS gradient (WSSG) analysis focusing in the differentiation between the bifurcation itself and the lateral to it walls in a normal left coronary artery (LCA). The results obtained show the flow characteristics and qualify the spatial and temporal distribution of WSS ant its gradient in regions close to the LCA tree flow dividers and in opposite to them areas.
Methods: A 3D computer generated model of the LCA tree based on averaged human data extracted from angiographies was developed for computational fluid dynamics analysis. Physiological phasic flow velocity is incorporated as entrance boundary condition.
Results: The instantaneous min wall shear stress oscillates from 0.45 to 2.84 N/m2 at the flow divider and from 0.25 to 1.28 N/m2 at the lateral walls of the main bifurcation. However, for the D1-S1 bifurcation (first diagonal-first septal), the instantaneous min wall shear stress oscillates from 0.6 to 3.85 N/m2 at the flow divider and from 0.6 to 2.65 N/m2 at the lateral walls. Mean wall shear stress, from max systole to max diastole, experiences a 129.0 % increase at the main bifurcation flow divider. The difference between max and min wall shear stress for the flow divider of the main bifurcation, as it is compared with the max wall shear stress over the entire cardiac pulse, attains a maximum value of 81.1 % for the lateral walls and 60.0 % at the peak of diastole. At the D1-S1 bifurcation, the corresponding difference values are 69.0% and 57.0 % for the lateral walls and flow divider, respectively. The mean wall shear stress gradient experiences a 123.0 % increase from max systole to max diastole at the main bifurcation flow divider and 153.0 % at main bifurcation lateral walls.
Conclusions: Proximal LCA bifurcation exhibit lower spatial wall shear stress and lower wall shear stress gradient values compared to distal bifurcations. The lateral walls compared to the bifurcation itself are exposed to low WSS and WSSG. With regards to the temporal variation, wall shear stress and its gradient exhibited lower values throughout systole as compared to diastole, suggesting a possible atherogenic effect of both the systolic phase by itself as well as the phasic oscillation of wall shear stress and its gradient from systole to diastole.
Keywords: Wall shear stress, wall shear stress gradient, left coronary artery
Introduction
Blood flow in arterial bifurcation segments is of paramount importance in understanding the biomedical pathophysiology of atherosclerosis. Βiomechanical factors, such as wall shear stress (WSS), spatial wall shear stress gradient (WSSG), blood viscosity and flow velocity may be responsible for the localization and progression of atherosclerosis1. As the arterial lumen radius decreases, blood flow velocity and WSS distribution increase. Although the relation between vascular geometry and atherogenesis is well established, it must be pointed out that it is not known precisely which of the mechanical risk factors is mediator. Complex configuration of a vessel promotes flow separation and vortex formation. It is in these complex regions that WSS magnitude greatly fluctuates in space over short distances. Flow separation, recirculation as well as low and oscillating WSS are atheromatic factors. Previous computational studies2,3 examined various WSS-related parameters (including WSSG) trying to choose the optimal parameter accurately predicting the atheromatic plaque formation in coronary arteries. Understanding that a bifurcation is a geometrically complex region, a question arises as to which bifurcation regional areas are more prone to atherosclerosis. Is it the bifurcation itself or the opposite of it endothelium regional areas? In this context no information is given at all. Thus, further research is needed to elucidate both the spatial and the temporal variations of the WSS in this region. Henceforth, answering this question is crucial to clinical applications.
Besides the spatial distribution of flow parameters, their temporal variation during the cardiac cycle has also been proposed as a decisive atherogenic factor. Complex configuration of the vessel promotes flow disturbances with low time-averaged WSS and high shear stress temporal oscillations during the cardiac cycle4. Soulis1 and Gijsen5mentioned the importance of non-Newtonian viscosity distribution in the human coronary artery. Hence, it would be of paramount importance to explore the impact of non-Newtonian and phasic flow properties on the hemodynamic profile of human coronary arterial tree bifurcations. The spatial and temporal WSSG in vitro has shown its importance in atherogenesis, as local modulators of the endothelial genes expression6. These genes regulate the proliferation, the migration and the apoptosis of the cells. However, the exact spatial and temporal role of WSSG remains still unclear.
Current results shed light into the 3D nature of the flow pattern and quantify the spatial and temporal distribution of WSS and WSSG particularly in regions close to the flow dividers and in opposite to them regions. The differentiation of flow patterns between the main bifurcation and the D1-S1 bifurcation (first diagonal-first septal) of the left coronary artery (LCA) tree is also investigated. To the best of our knowledge, little research has been done concerning the spatial and temporal WSS, WSSG distribution is regions close to the flow dividers and in opposite to them endothelium regions using non-Newtonian blood viscosity model.
Methods
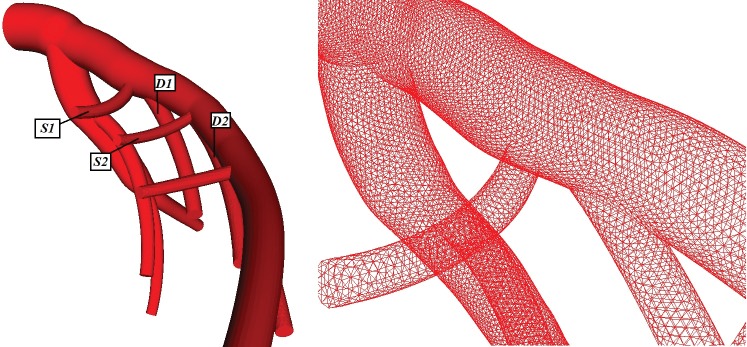
Measurements of intra thoracic spatial location of specified coronary segments on the normal human coronary heart were conducted by Dodge7. The obtained knowledge facilitates the generation of the 3D geometry. The 3D computer generated model of the LCA tree based on averaged human data set is shown in Figure 1. The LCA tree includes the left anterior descending (LAD), the left circumflex artery (LCxA) and their major branches D1-S1, D2-S2, etc. The model is simplified by removal of all branching vessels with diameters of less than 0.5 mm. Data was input to a pre-processing code for unstructured mesh generation. A mesh generation comprised of non-structured elements of tetrahedra form was chosen for current work. Details of the initial unstructured mesh of the tested entire normal human LCA tree grid used are shown in Figure 1.
Figure 1. Geometry and sparse left coronary artery computational grid. S1: first septal, S2: second septal, D1: first diagonal, D2: second diagonal.
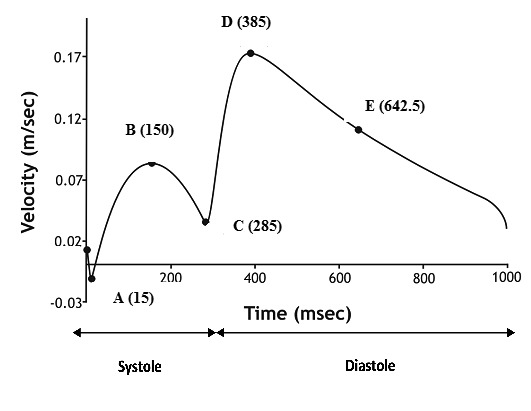
In order to simulate the physiological phasic flow condition, a typical left coronary blood flow waveform8is applied over the entire entrance cross-section, Figure 2. The duration ratio between systole and diastole is regarded approximately 1:2. From the entire velocity waveform five characteristic time-points were selected for detailed analysis. Flow discharges through outflows were set analogous to the third power of the branching vessel inlet diameter according to Murray’s law. All mesh and flow data was transferred into the main solver, ANSYS 15.0, Fluent (ANSYS Inc., Canonsburg, PA, USA). The numerical code solves the governing mass, momenta and energy conservation equations. The assumptions made about the flow which is considered to be 3D, unsteady, laminar, isothermal while the arterial vessel walls are considered to be inelastic and impermeable. Additional assumptions are related to the boundary condition definition; namely the assumption of an average physiological waveform rather than patient specific data and the assumption of a no-slip boundary condition for the arterial wall. The blood is treated as non-Newtonian fluid obeying to the non-Newtonian power law1.
Figure 2. Average physiological human coronary velocity waveform in left coronary artery. A, B, C, D and E are characteristic waveform time instants.
The local magnitude for the WSSG (spatial gradient) is defined, is the WSS. To elucidate the influence of flow pulsation on WSS variation we calculate the variable ΔWSSr defined as follows, where, max WSSr and min WSSr are the maximum and minimum WSS values over the cardiac cycle at a given region r, namely the flow divider (FD) or the lateral walls (LW), on the arterial wall and max WSSb is the max WSS value over the entire bifurcation (b subscript denotes bifurcation) during the heart pulsation. Similarly, the WSSGr is defined as follows,
A sensitivity analysis concerning the number of computational nodes is implemented in order to achieve a mesh-independent solution. Computational grids using 720,000, 1,800,000 and 2,500,000 nodes are examined. The 1,800,000 grid node system based on the area averaged WSS criterion (1.0 %) proved to be accurate enough for the aims of the present study.
Results
Because of the complex LCA geometry, the WSS and the WSSG distribution are highly non-uniform. The spatio-temporal distribution of WSS and WSSG are investigated in two distinct and arbitrary chosen regions (denoted as subscript r) constituting the inner and outer walls of the bifurcations, respectively. The left main coronary bifurcation region FD (inner) covers an area of 3.15x10⁻⁵ m2 and the LW region (outer) covers an area of 7.0x10⁻⁴ m2. For the D1-S1 bifurcation, the FD covers 1.82x10⁻⁵ m2 and the LW 2.27x10⁻⁴ m2.
The spatial distribution contours of WSS at the left main coronary artery (LMCA)-LCxA and D1-S1 bifurcation of the LCA tree at the D characteristic point is shown in Figure 3. A “ring-shaped” low WSS region is noticeable at all LCA tree bifurcations during the entire cardiac cycle.
Figure 3. Contours of the wall shear stress (N/m2) magnitude at the main and D1-S1 bifurcations after 385.0 msec, point D (Figure 2), flow divider (FD) and lateral walls (LW).
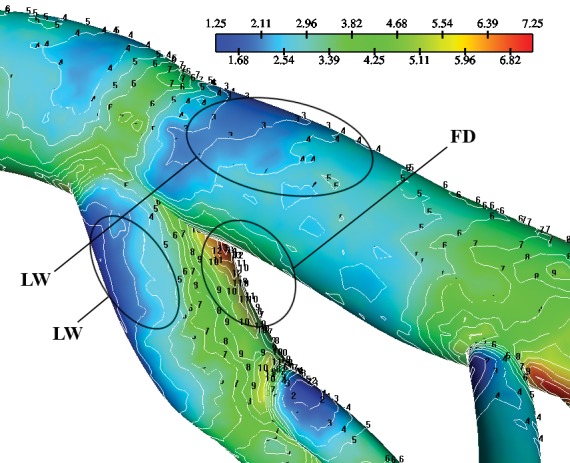
Due to the strong pulsatility of the left main coronary flow the WSS varies significantly with time showing low WSS values in the regions which are in contact with myocardial area, probably because of their inner curvature. For nearly all time steps, the FD main bifurcation encounters higher mean WSS and min WSS values than LW. Furthermore, min WSS, mean WSS and max WSS variables exhibit, higher values in diastole in comparison to systole. The instantaneous min WSS oscillates from 0.45 to 2.84 N/m2 at the FD and from 0.25 to 1.28 N/m2 at the LW, Figure 4. The min WSS value in the entire main bifurcation is 0.75 N/m2 at the peak of diastolic phase. The min WSS value in the entire D1-S1 bifurcation is 2.31 N/m2 at the peak of the diastolic phase. The instantaneous WSS oscillates from 0.57 to 8.89 N/m2 at the FD and 0.58 and 7.15 N/m2 at the LW for the D1-S1 bifurcation. Any non-zero value of the spatial WSSG denotes a non-uniform hemodynamic environment. The distribution contour of WSSG at the time-point D (after 385 msec) is shown in Figure 5. The WSSG varies significantly with time and space. High WSSG values occur at the “cervix” (proximal region) of the origin and at flow dividers.
Figure 4. Temporal oscillation of min wall shear stress (WSS, N/m2) for flow divider (FD) and lateral walls (LW) at the main bifurcation, FD: dashes, LW: continuous lines.
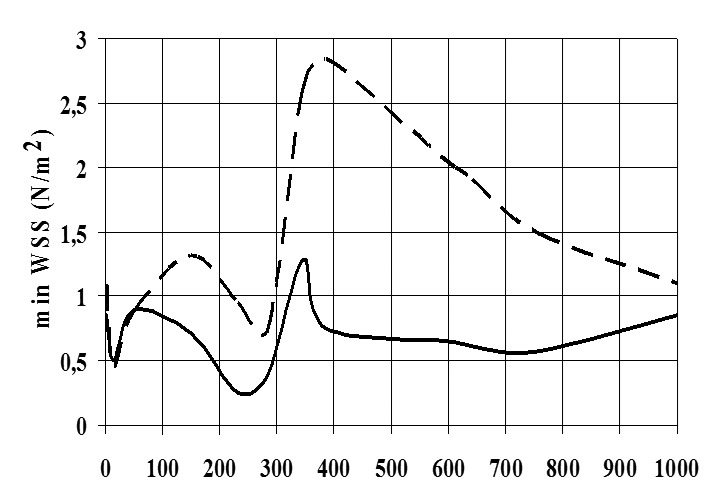
Figure 5. Contours of the wall shear stress gradient magnitude (WSSG, N/m3) at the main and D1-S1 bifurcations (first diagonal-first septal), of the left coronary artery (LCA) tree after 0.385 sec (point D at Figure 2).
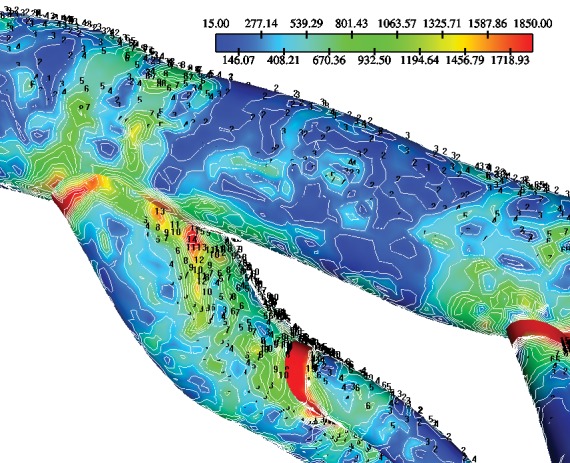
At the “hips” of the LMCA bifurcation, low WSSG values occur at all waveform time steps. Main FD encounters higher WSSG values than LW for nearly all time steps. The min WSSG, mean WSSG and max WSSG variables exhibit higher value in diastole in comparison to systole.
At the FD of the left main coronary bifurcation, the mean WSSG experiences a 123.0% increase from max systole to max diastole. At the LW, the mean WSSG experiences a 153.0 % increase from max systole to max diastole. The min WSSG temporal oscillation variation is shown in Figure 6.
Figure 6. Temporal oscillation of min wall shear stress gradient magnitude (WSSG, N/m3) for flow divider (FD) and lateral walls (LW) at the main bifurcation. FD: dashes, LW: continuous lines.
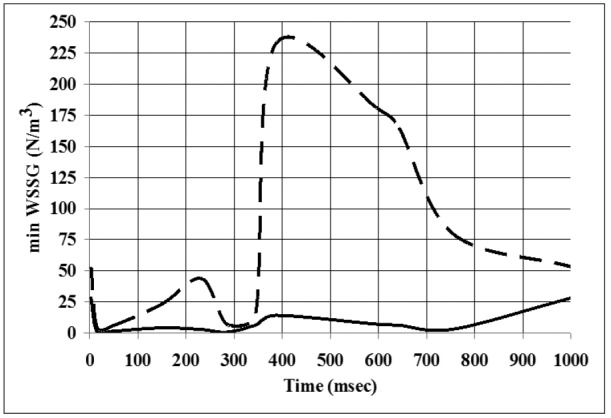
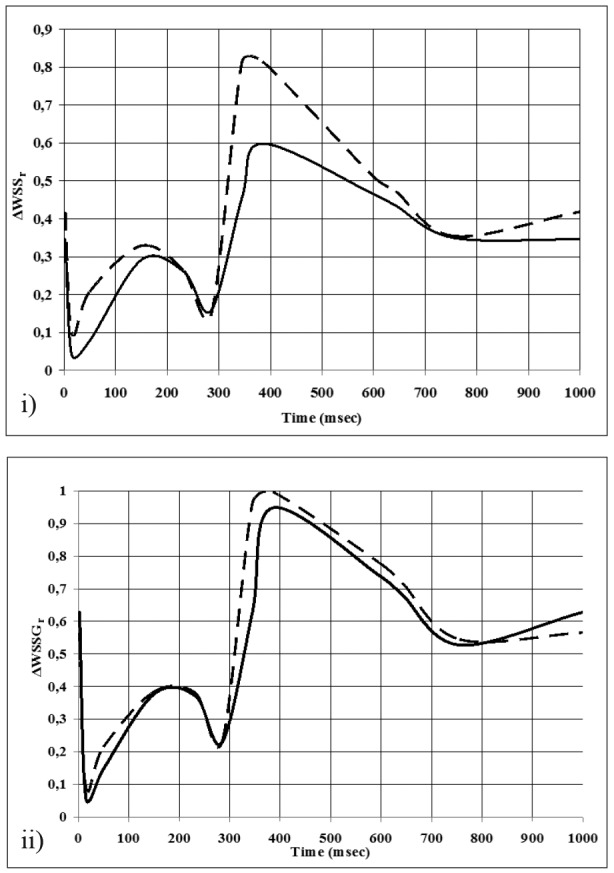
At the FD of the D1-S1 bifurcation the min WSSG oscillates between 4.12 and 135.0 N/m3. At the LW the min WSSG oscillates between 1.81 and 16.5 N/m3. The temporal oscillations plots of ΔWSSr, ΔWSSGr for the FD and LW of the main bifurcation are shown in Figure 7. At the main bifurcation, the ΔWSSr attains a maximum value of 81.1 % for the LW and 60.0 % for the FD at the peak of diastole. At the D1-S1 bifurcation, the ΔWSSr values are 69.0 % and 57.0% for the LW and FD, respectively. The ΔWSSGr values of the FD and LW for either main bifurcation or D1-S1 and subsequent LCA tree bifurcations exhibit small differences.
Figure 7. Temporal oscillation of i)ΔWSSr, and ii)ΔWSSGr for flow divider (FD) and lateral walls (LW) at the main bifurcation. FD: continuous lines, LW: dashes.
Discussion
On the whole coronary WSS and WSSG in systole are significantly lower than in diastole. Given the importance of low and oscillating WSS in atherogenesis, it seems reasonable to adopt the hypothesis that the systolic period favors the patho-physiological processes responsible for the onset and development of atherosclerosis. In contrast, the steep spatial increase of WSS appearing in diastole modulates an athroprotective environment in the coronaries compensating for the systolic atherogenic WSS values9. Given the implication of oscillatory WSS in atherogenesis, it could be postulated that not just the systolic phase by itself, but also the cyclic WSS oscillation between systole and diastole favor atherogenesis. Always the LW regions exhibit higher ΔWSSr than the FD regions. In regions susceptible to atherosclerosis the beneficial role of diastole is limited by possibly two mechanisms, namely the intensification of the exposure of endothelium to the atherogenic effects of low systolic WSS and the increase of the frequency of WSS cyclic oscillations through lifetime.
Conclusion
In the present study, analysis is performed for the normal human LCA tree. Detailed analysis refers to LMCA-LCxA and the D1-S1. Regions opposite to the flow divider, at the lateral walls and the epicardial curvature of the bifurcation exhibited low and oscillating WSS and WSSG. The lateral bifurcation walls and not the bifurcation itself is exposed to low WSS and WSSG. Proximal LCA bifurcation regions exhibit lower WSS and WSSG values compared to distal bifurcations regions. The bifurcation lateral walls are susceptible to atherosclerosis especially during the systolic period, during which low and oscillatory WSS occurs. With regards to the temporal variation, WSS and WSSG exhibited lower values throughout systole as compared to diastole, suggesting a possible atherogernic effect of both the systolic phase by itself as well as the phasic oscillation of WSS and WSSG from systole to diastole. Diastole, which lasts more than systole, compensates the balance towards higher WSS values, further reducing the residence time and the contact of blood particles with the endothelium, exerting a more beneficial role.
Conflict of interest
The authors declare no conflict of interest.
References
- 1.Soulis JV, Farmakis TM, Giannoglou GD, Hatzizisis YS, Giannakoulas GA, Parcharidis GE, et al. Molecular viscosity in the normal left coronary arterial tree. Is it related to atherosclerosis? Angiology. 2006;57:33–40. doi: 10.1177/000331970605700105. [DOI] [PubMed] [Google Scholar]
- 2.Knight J, Olgac U, Saur SC, Poulikakos D, Marshall W Jr, Cattin PC, et al. Choosing the optimal wall shear parameter for the prediction of plaque location-A patient-specific computational study in human right coronary arteries. Atherosclerosis. 2010;211:445–450. doi: 10.1016/j.atherosclerosis.2010.03.001. [DOI] [PubMed] [Google Scholar]
- 3.Rikhtegar F, Knight JA, Olgac U, Saur SC, Poulikakos D, Marshall W Jr, et al. Choosing the optimal wall shear parameter for the prediction of plaque location-A patient-specific computational study in human left coronary arteries. Atherosclerosis. 2012;221:432–437. doi: 10.1016/j.atherosclerosis.2012.01.018. [DOI] [PubMed] [Google Scholar]
- 4.Chen J, Lu XY. Numerical investigation of the non-Newtonian pulsatile blood flow in a bifurcation model with a non-planar branch. J Biomech. 2006;39:818–832. doi: 10.1016/j.jbiomech.2005.02.003. [DOI] [PubMed] [Google Scholar]
- 5.Gijsen FJ, Allanic E, van de Vosse FN, Janssen JD. The influence of the non-Newtonian properties of blood on the flow in large arteries: unsteady flow in a 90 degrees curved tube. J Biomech. 1999;32:705–713. doi: 10.1016/s0021-9290(99)00014-7. [DOI] [PubMed] [Google Scholar]
- 6.Nagel T, Resnick N, Dewey CF Jr, Gimbrone MA Jr. Vascular endothelial cells respond to spatial gradients in fluid shear stress by enhanced activation of transcription factors. Arterioscler Thromb Vasc Biol. 1999;19:1825–1834. doi: 10.1161/01.atv.19.8.1825. [DOI] [PubMed] [Google Scholar]
- 7.Dodge JT Jr, Brown BG, Bolson EL, Dodge HT. Intrathoracic spatial location of specified coronary segments on the normal human heart. Applications in quantitative arteriography, assessment of regional risk and contraction, and anatomic display. Circulation. 1988;78:1167–1180. doi: 10.1161/01.cir.78.5.1167. [DOI] [PubMed] [Google Scholar]
- 8.Nosovitsky VA, Ilegbusi OJ, Jiang J, Stone PH, Feldman CL. Effects of curvature and stenosis-like narrowing on wall shear stress in a coronary artery model with phasic flow. Comput Biomed Res. 1997;30:61–82. doi: 10.1006/cbmr.1997.1434. [DOI] [PubMed] [Google Scholar]
- 9.Giannoglou GD, Soulis JV, Farmakis T M, Zioupos GJ, Giannakoulas GA, Louridas GE. Wall shear stress differences between proximal and distal left coronary artery bifurcations. Abstract. Eur Heart J. 2002;23:686. [Google Scholar]


