

Abstract
The need for data-centric scientific tools is growing; domains like biology, chemistry, and physics are increasingly adopting computational approaches. As a result, scientists must now deal with the challenges of big data. To address these challenges, we built a visual analytics platform named DIVE: Data Intensive Visualization Engine. DIVE is a data-agnostic, ontologically-expressive software framework capable of streaming large datasets at interactive speeds. Here we present the technical details of the DIVE platform, multiple usage examples, and a case study from the Dynameomics molecular dynamics project. We specifically highlight our novel contributions to structured data model manipulation and high-throughput streaming of large, structured datasets.
Keywords: big data, bioinformatics, molecular dynamics, ontology, visual analytics
Bioinformatics research increasingly depends on high-performance computations and large-scale data storage. Complex, heterogeneous and often incomplete datasets are also commonplace in the field. Combined, these two aspects place bioinformatics firmly in the class of visual analytic-appropriate domains. There are many powerful scientific toolsets available ranging from software libraries such as SciPy1, specialized visualization tools such as UCSF Chimera2, and scientific workflow tools like Taverna3, Galaxy4, and the Visualization Toolkit (VTK)5. Some of these are capable of handling large data sets while others, typically those originally designed for small, local datasets, have not been updated to handle recent advances in data generation and acquisition.
In order to help fill this technological gap, we developed a visual analytics software framework named DIVE – Data Intensive Visualization Engine. DIVE provides many features that make big data, visual analytics approaches accessible to scientific researchers. DIVE is based on a flexible, interactive data pipeline extensible via plugins and adaptable with “microscripting” (μScripting). The platform encourages multi-processor, parallelized operations and high-throughput, structured data streaming. DIVE can act as an object-oriented database by joining multiple disparate data sources. DIVE is also data-agnostic. Although we present mostly bioinformatics applications here, with an appropriate data parser, DIVE can handle data from many domains.
This article describes the novel technical contributions of the DIVE visual analytics framework. First, we detail the DIVE architecture and core features of the framework. Second, we present the innovative contributions included in the framework that address object parsing, data manipulation, and data streaming. Finally, we present a bioinformatics-specific case study made possible by the DIVE framework. More detailed bioinformatics applications, case studies, software downloads and demonstrations are provided in the DIVE application note6.
The DIVE Architecture
DIVE is a data analysis and visualization application programming interface (API). DIVE’s primary component is a data pipeline capable of streaming, transforming, and visualizing datasets at interactive speeds. This pipeline can be extended with plugins and each plugin can operate independently on the data stream. Data exploration is supported via command-line interfaces (CLIs), graphical user interfaces (GUIs), and application programming interfaces (APIs). All of these environments support scripting interaction. DIVE also supports typed events, allowing users to trigger targeted analyses from a point-and-click interface. Programmatically, DIVE inherits a great deal of functionality from the .NET environment such as dynamic language support, simplified parallelization, and interoperability with many different software packages and libraries. Finally, DIVE is designed to be domain independent and data agnostic; the pipeline accepts data from any domain provided that an appropriate input parser is implemented; currently supported data formats include SQL, XML, comma- and tab-delimited files, and several other standard file formats (see Figure 1).
Figure 1.
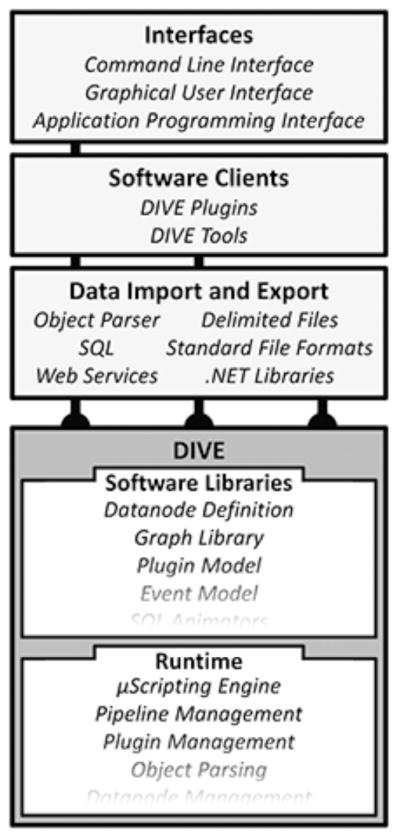
The DIVE architecture. The DIVE kernel acts as both a software library and a runtime environment. In both cases, DIVE can import and export data and functionality from a variety of sources. Pipeline plugins use DIVE primarily as a software library, taking advantage of DIVE’s data handling capabilities while DIVE tools are applications that instantiate and launch a DIVE pipeline for a specific analysis task. DIVE provides software support for multiple interface paradigms.
Data Representation
Ontologies (see sidebar) are gaining in popularity as powerful paradigms for data organization. DIVE embraces this approach through a core data representation developed with ontologies in mind. The fundamental unit of data within DIVE is the datanode. In many respects, datanodes resemble traditional object instances from object-oriented (OO) languages like C++, Java, or C#; they are typed, contain strongly-typed properties and methods, and can exist in an inheritance hierarchy. Datanodes extend this traditional model, however.
Datanodes can exist in an ontological network or graph; i.e. multiple relationships beyond simple type inheritance can exist between datanodes. These relationships are implemented with dataedges, which link datanodes together. Dataedges themselves are implemented by datanode objects and, as a result, may themselves contain properties, methods, and inheritance hierarchies. Because of this basic flexibility, DIVE can represent arbitrary, typed relationships between objects, objects and relationships, and relationships and relationships.
Datanodes are also dynamic; every method and property can be altered at runtime, adding a great deal of flexibility to the system (various data integrity mechanisms exist in the DIVE pipeline to prevent unwanted side effects; see read and write contexts, below). The inheritance model is also dynamic; as a result, objects can gain and lose type qualification and other aspects of inheritance at runtime. This allows runtime classification schemes like clustering to be integrated into the object model. Finally, datanodes provide virtual properties; virtual properties are accessed identically to fixed properties, but store and recover their values via arbitrary code instead of storing data on the datanode object itself. Virtual properties can extend the functionality of the original software architecture, allowing data manipulation such as that described in the pass-through SQL section below.
DIVE dataedges implement multiple inheritance models. In addition to the traditional “is-a” relationship found in OO languages, other ontological relationships such as “contains”, “part-of”, and “bounded-by” can all be expressed. Each of these relationships can support varying levels of inheritance: OO-inheritance, type inheritance, and property inheritance (Table 1). OO-inheritance is identical to OO-languages like C++ and Java wherein subclasses inherit both the type and properties of the parent. With type inheritance, subclasses inherit only the parent’s type, not its properties or methods. Finally, with property inheritance, subclasses inherit properties and methods, but not type. Like OO-language objects, property-inheritance subclasses can override superclass methods and properties with arbitrary transformations. Similarly, type-inheritance subclasses may be cast to superclass types. Because the DIVE data framework supports not only multiple inheritance, but multiple kinds of inheritance, casting in DIVE is implemented by traversing the dataedge ontology. Due to the coupling of the underlying data structure and ontological representation, every datanode and dataedge in DIVE is implicitly part of a system-wide graph. This means that both the data structures and ontologies represented in DIVE can be analyzed using graph theoretical methods. Using DIVE, this approach has already proved useful in the field of structural biology.7
Table 1.
DIVE Inheritance Models
| Inheritance Model | Type | Properties | Methods | Example |
|---|---|---|---|---|
| OO-inheritance | × | × | × | Protein is a Molecule |
| Type Inheritance | × | Used with property inheritance to implement OO-inheritance. | ||
| Property Inheritance | × | × | Molecule contains Atom |
Because all data in DIVE are represented by datanodes and dataedges, DIVE analysis modules are presented with a syntactically-homogenous dataset. Due to this data-type independence, any modules can be connected so long as the analyzed datanodes have the expected properties, methods, or types (see Scripting/μScripting below); the analysis module need not concern itself with the origin or access syntax of the data. As a result, code and tool reuse is a strength of DIVE.
Data-type handling is a challenge in modular architectures; the Taverna3 workflow system, for example, types data using MIME-style typing. The VTK5 uses strongly-typed classes. Python-based tools, such as Biopython8 and SciPy1, often use the dynamic typing of the underlying language. For DIVE, the datanode and dataedge ontological network is a useful blend of these approaches. The dynamic typing of the individual datanodes and dataedges allows us to build arbitrary type networks from raw data sources (see the Gene Ontology (GO)9 taxonomy example described in the application note6), while the underlying strong typing of the actual data (doubles, strings, objects, etc) facilitates parallel processing, optimized script compilation, and fast, non-interpreted handling for operations such as filtering and plotting. Furthermore, the fact that the datanodes and dataedges themselves are strongly-typed objects facilitates programmatic manipulation of the data flow itself.
Although each of the typing approaches above has its strengths, the approach used in DIVE lends itself to fast and agile data exploration as well as fast and agile updating of the DIVE tool itself. The homogeneity of the datanode objects also simplifies the basic pipeline and module development. The updating of the tool itself is a particularly useful feature in an academic laboratory where multiple research foci, a varied spectrum of technical expertise, and high turnover are all common.
Data Import
Data must be imported into DIVE before they are accessible to the DIVE pipeline. In many cases, this import is handled by DIVE’s built-in functionality; tabular data such as comma- and tab-separated value files and SQL data tables are handled natively. In these cases, one datanode is constructed per row and each datanode has one property per column. DIVE also has support for obtaining data from web services such as the Protein Databank10. Once data are obtained, simple mechanisms are provided to establish relationships between datanodes. A more sophisticated method of acquiring structured data uses native object parsing (below).
The DIVE Pipeline
As discussed above, the core of DIVE is a data processing pipeline comparable to Taverna3, Pipeline Pilot (http://accelrys.com/products/pipeline-pilot), Cytoscape11, Galaxy4, and, most similarly, the VTK5. While all of these platforms can be extended, several factors, including both the platform considerations discussed below and a focus on agile data exploration instead of remote, service-based workflows, led us to develop DIVE. Fortunately, all of these systems have made interoperability a priority; thus, leveraging the graph capabilities of Cytoscape or the visualization capabilities of the VTK while maintaining the benefits of DIVE is still possible by connecting their respective pipelines.
The DIVE pipeline is populated by plugins that can create, consume, and/or transform data. DIVE pipeline plugins are simply compiled software libraries whose objects inherit from a published interface; subsequent plugin connectivity, pipeline instantiation, scripting, user interfaces, and many other aspects of plugin functionality are all provided automatically by the DIVE kernel. Plugins move data through pins much like an integrated circuit: data originate at an ‘upstream’ source pin and are consumed by one or more ‘downstream’ sink pins. Plugins can also move data by broadcasting and receiving events. Pipeline topologies and state can be saved to a file and shared among users.
When DIVE sends a datanode object through a branching, multi-level transform pipeline, it must maintain the datanode’s correct property value at every pipeline stage. If this were not done, a simple plugin that scaled incoming values would have the effect of scaling all data, everywhere in the pipeline. The naïve option is to copy all datanodes at every pipeline stage, but this is extremely CPU- and memory-intensive and dramatically impacts the user experience.
To address this problem, DIVE uses read and write contexts. In essence, this creates a version history of each transformed value. The history is keyed on each pipeline stage such that each plugin only reads the appropriate values and not, for instance, downstream values or values from another pipeline branch. The approach has multiple benefits. First, it maintains data integrity in a branching transform pipeline. Second, it is parallelizable. Third, it keeps an accurate account of the property value at every stage in the pipeline with a minimum of memory use. Fourth, it is fast and efficient because the upstream graph traversal is linear and each value lookup is performed in constant time.
Software Engineering Considerations
DIVE was designed to provide a dynamic, scalable architecture for visual analytics. While this type of architecture does not require a specific platform, we decided to build DIVE on the .NET platform due to several significant built-in capabilities. These capabilities include the dynamic language runtime (DLR), expression trees, and Language-Integrated Query (LINQ). The .NET framework also provides coding features such as reflection, serialization, threading, and parallelism. Extensive documentation and details of the capabilities we mention here are available online (see http://www.microsoft.com/net).
Many of these platform capabilities have a direct impact on DIVE functionality and user experience. Support for dynamic languages allows flexible scripting and customization that would be difficult in other less expressive platforms; these components are crucial for the data model described earlier as well as the scripting capabilities described below. Furthermore, the LINQ query language in a scripted data-exploration environment is very useful (Table 2). Expression trees and reflection provide the underlying object linkages for the DIVE object parser, also described below, and the DIVE streaming paradigms make heavy use of the .NET framework’s threading libraries. Finally, DIVE supports 64-bit computations and simple parallelism throughout, allowing the platform to scale.
Table 2.
Examples of μScripting
| Arguments | Return Type | Code | Discussion |
|---|---|---|---|
| datanode dn | double |
3 |
Simplest case of scripted numeric input |
| datanode dn | double |
dn.X |
Simple per-datanode μScript |
| datanode dn | double |
Math.Abs(dn.X) |
μScript is given access to the full .NET library |
| datanode dn | int |
dn.X > 0 ? 1 : -1; |
Simple syntax can be very powerful |
| void | bool |
{
   int hour = DateTime.Now.Hour;
   return hour < 12;
}
|
Any .NET code is allowed, including complex, multi-statement functions |
| datanode[] | dynamic set |
from dn in dns
group dn by Math.Round(dn.X, 2) into g
select new
{
  bin = g.Key, population = g.Count()
};
|
Creating a histogram based on the ‘X’ property of the datanode objects |
| datanode[] | dynamic set |
from dn in dns where dn.X > Math.PI && dn.is_Superclass && dn.Func() = = true select dn; |
Filtering a subset of datanodes based on properties, methods, and inherited type |
| datanode[] datanode[] |
dynamic set |
from dn1 in dnSet1
join dn2 in dnSet2 on dn1.X equals
dn.2X
select new {X = dn1.X, Y = dn2.Y);
|
DIVE can act as an object-oriented database by joining multiple potentially disparate datasets |
The .NET platform also contains widespread language support for not only Microsoft-specific languages such as C#, Visual Basic, and F#, but also more general languages such as Python and C++. This allows us to author DIVE plugins in a multitude of languages. These languages can also be used to develop command-line, GUI, and programmatic tools that embed and drive the DIVE kernel (see the Protein Dashboard case study below). .NET’s wide user base also provides multiple external libraries with which to jump start our development efforts including molecular visualizers, clustering and analysis packages, charting tools, and mapping software. Of particular note, one such library is the VTK5, wrapped by the ActiViz .NET API (see http://www.kitware.com/opensource/avdownload.php). Finally, the Dynameomics molecular dynamics project (see sidebar) was the impetus for implementing DIVE; Dynameomics data are stored in a Microsoft SQL Server data warehouse, and it made sense to adopt a software platform with deep support for these data services.
Object Parsing
Module-management systems like the java-based OSGi12 offer deep support for module life cycle management and service discovery, but often require the author of the module to be aware of the module-management system when the module is created. Because our goal was to make .NET assemblies written without a priori knowledge of DIVE accessible to the ontological data representation, and because we did not require the life-cycle services of such module-management systems, we developed the DIVE object parser. The object parser is a system that automatically generates DIVE datanodes and dataedges from any .NET object or assembly (Figure 2). Using reflection and expression trees, the object parser consumes .NET object instances and translates them into propertied datanodes and dataedges. Usage patterns typically involve standard object creation by library-aware code, followed by automated object parsing and injection into the DIVE pipeline. Generic rules define the mapping between the .NET object hierarchy and the DIVE data structures. In general, complex objects such as classes are parsed into datanodes while built-in .NET system objects, primitive fields, primitive properties, and methods with primitive return types are translated into properties on those datanodes. Interfaces, virtual classes, and abstract classes are all translated into datanodes. The .NET inheritance and member relationships are interpreted as OO and property inheritance dataedges, respectively; these dataedges then connect the hierarchy of datanodes. Using this approach, the object parser recursively produces an ontological representation of the entire .NET instance hierarchy in DIVE. Additional rules are in place to handle other program constructs. For example, static members are translated into a single datanode. Multiple object instances with the same static member all map to a single, static datanode instance in the DIVE data structure. Public objects and members are always parsed while private members, static objects and interfaces are parsed at the discretion of the user.
Figure 2.

Example mapping of a datanode ontology from a third-party .NET assembly. The left side of the figure shows a generic .NET class hierarchy containing interfaces, class inheritance, and member fields, properties and methods. The right side of the figure shows the automatically-generated datanode ontology replicating the strongly typed objects and relationships from the .NET assembly. Instance-specific data are maintained on the subclass datanode object (i.e. data are not stored in superclass datanodes) and the fields, properties and methods of the original .NET object are accessible through the DIVE datanodes by virtual properties.
Throughout this process, no data values are actually copied to the DIVE datanodes or dataedges. Instead, all datanode properties are linked to their respective .NET members via dynamically-created virtual properties. Consequently, any changes to the runtime .NET object instances are reflected in their DIVE representations. Similarly, any changes made to the DIVE datanode or dataedge properties are propagated back to their .NET object instance counterparts. This allows DIVE to interactively operate on any runtime .NET object structure.
Using object parsing, users can import and use any .NET object without special handling. Furthermore, as discussed above, the architect of the .NET application does not need to be aware of DIVE in order to take advantage of its visual analytics capabilities. For example, assume we have a non-visual code library that dynamically simulates moving bodies in space (this example is available with the DIVE program download at http://www.dynameomics.org/dive). A DIVE plugin, acting as a thin wrapper, can automatically import the simulation library and add runtime visualizations and interactive analyses. As the simulation progresses, the DIVE datanodes will automatically reflect the changing property values of the underlying .NET instances. Through a DIVE interface, the user could change a body’s mass. This change is propagated back to the runtime instance and is immediately observed in the visualization. This general approach can be applied to a multitude of specialized libraries, taking advantage of their efficient data models. An example of this is described in the data streaming section below.
Scripting/μScripting
DIVE supports two basic scripting paradigms to rapidly interact with the DIVE pipeline, plugins, data structures, and data themselves. Within the DIVE core framework, C# is the primary scripting language. Externally, DIVE can host components written in any .NET language and, conversely, be hosted by any .NET environment. Here we will focus on the internal C# scripting capabilities.
Each scripting paradigm is controlled in the same manner; the user script is incorporated into a larger, complete piece of code and the code is compiled during runtime using full optimization. Finally, using reflection, the compiled code is loaded back into memory as a part of the runtime environment. While this approach necessitates time to compile each script, the small initial penalty is typically outweighed by the resulting optimized, compiled code. Both of the scripting scenarios below, particularly μScripting, can be run on a per-datanode basis; optimized compilation helps create a fast and efficient user experience.
Plugin scripting is the simplest and most powerful of the scripting scenarios and is most similar to the scripting capabilities of existing analysis tools. Through this interface the user script can access the entire .NET runtime, the DIVE kernel, and the specific plugin. μScripting is a technique that we developed for DIVE to give complete programmatic control to power users and simple, intuitive control to casual users. In essence, μScripting is an extension of simple plugin scripting but differs because DIVE writes most of the code for the user. In μScripting, the user is responsible only for writing the right-hand side of a C# lambda function. A schematic of a C# lambda function is shown inline here:
func(datanode dn) => ???;
The user-provided, right-hand side of the expression is inserted into the function and compiled at runtime. The client can provide any expression that evaluates to an appropriate return value. Examples of μScripting and discussions of each example are given in Table 2.
Data Streaming
DIVE supports two SQL data streaming paradigms for the immediate analysis of large, non-local datasets as well as the interactive analysis of datasets larger than that of the client’s local memory. These two approaches, referred to here as interactive SQL and pass-through SQL, address different streaming paradigms. Interactive SQL can be used for impromptu, user-defined dynamic SQL queries while pass-through SQL is intended for streaming complex object models across a preset dimension.
Interactive SQL
Interactive SQL consists of using user input to build a SQL query at runtime. DIVE provides mechanisms to facilitate this; for example, DIVE events can be thrown in response to mouse clicks or slider bar movements. Upon receipt of these events, a DIVE component can construct the appropriate SQL query (which can consist of both data queries and analysis function execution), send it to the SQL database, and parse the resulting dataset. Depending on the size and complexity of the query, this approach can result in interactive-time direction of SQL analysis via GUI interaction. An example of this is given in see Figure 3a.
Figure 3.
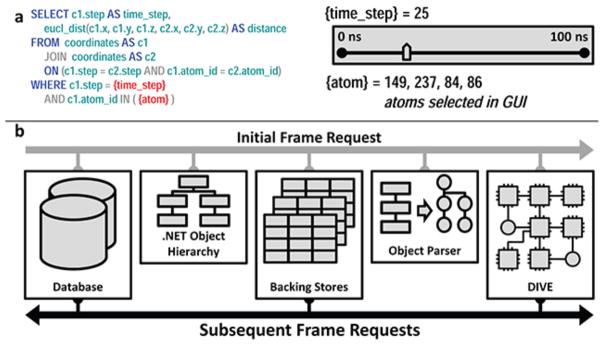
The two SQL streaming paradigms available in DIVE. (a) Interactive SQL. On the left is a SQL template containing tags for ‘time_step’ and ‘atom’. The tags are replaced by input from GUI elements, and the final query calculates the distances between all user selected atoms at the specified time. (b) Pass-through SQL. On the initial frame request, a datanode hierarchy is constructed around the .NET objects and then backing stores are created. On all subsequent frame requests, DIVE buffers SQL data directly into the backing stores using multiple threads. Large amounts of complex data are then propagated through DIVE at interactive speeds by bypassing OO parsing.
Pass-through SQL
DIVE’s pass-through SQL facilitates interactive streaming of complex, OO data structures from SQL databases over a pre-defined dimension. This method increases the speed at which SQL data are translated into object-oriented structures by shifting the location of values from the objects themselves to an in-memory data structure, named a backing store. The backing store is essentially a collection of tables that contain instance data. Each backing-store table contains many instance values for a single object type. Internally, object fields and properties have pointers to locations in backing-store tables instead of local, fixed values. A backing-store collection is defined by all tables for object instances occurring at the same point, or frame, in the streaming dimension.
Once a backing store is created for a set of object instances at a specified frame in the streaming dimension, copies of the backing store structure are generated with a unique identifier for each new frame. Instance values for new frames are inserted into the corresponding backing store copy. This reduces the loading of instance data to a table-to-table copy, bypassing the parsing normally required to insert data into an OO structure. This method also removes the overhead of allocating and de-allocating expensive objects by reusing the same object structures for each frame in the streaming dimension.
Streaming is enabled via a buffered set of backing stores representing frames over the streaming dimension. A set of backing stores are initially populated client-side for frames on either side of the frame of interest. Buffer regions are defined for each end of this set. Frames within the set are immediately accessible to the client. When the thresholds of the buffer regions are traversed during streaming, a background thread is spawned to load a new set of backing stores around the current frame. If the client requests a frame outside of the loaded set, a new set is loaded around the requested frame. Loaded backing stores no longer in the streaming set are deleted from memory to conserve the client’s memory. This process is shown in Figure 3b.
Case Study
A major research focus in the Daggett laboratory is the study of protein structure and dynamics via molecular dynamics (MD) simulations contained in the Dynameomics data warehouse (see sidebar). The Dynameomics project contains several hundred terabytes of simulation data, much larger than what typical, domain-specific tools can handle. Analysis of the Dynameomics dataset was the impetus for creating DIVE.
One of the first tools to be built on the DIVE platform was the Protein Dashboard. The Protein Dashboard uses DIVE to provide interactive 2D and 3D visualizations of the Dynameomics dataset. These visualizations include interactive explorations of bulk data, molecular visualization tools, and integration with external tools such as UCSF Chimera2.
A tool implemented independently of DIVE and the Protein Dashboard was the Dynameomics Application Programming Interface (API). This API, written in C#, has multiple functions; it establishes an object hierarchy, provides high-throughput streaming of simulations from the Dynameomics data warehouse, contains domain-specific semantics and data structures, and provides multiple domain-specific analyses. However, this API is designed for computational efficiency and does not specify any data visualizations or user interfaces.
We wanted to use the more sophisticated data handling and streaming capabilities of the Dynameomics API while keeping the interactive visualization and analysis capabilities of the Protein Dashboard, all without re-implementing the API specifically for the DIVE framework. Using the DIVE object parser described above, DIVE integrates and uses the API structures without any changes to the API itself. This process creates strongly-typed objects, including Structure, Residue, Atom, and Contact as datanodes, with each datanode containing properties defined by the Dynameomics API. Semantic and syntactic relationships specified in the API are similarly translated into dataedges. Once processed, these datanodes and dataedges are available to the DIVE pipeline, indistinguishable from any other datanodes or dataedges in the framework. The data flow described here is diagrammed in Figure 4.
Figure 4.

Protein Dashboard case study. Beginning at the top, data are parsed in from the Dynameomics SQL warehouse or from the Protein Data Bank, populating the backing stores of the Dynameomics API. DIVE then parses these data structures and creates corresponding datanodes and dataedges available to the DIVE pipeline. Within the molecular visualizer plugin, μScript is used to select which atoms to display as well as to define the color of those atoms. Finally, the user is able to interact with the data in the Protein Dashboard. In this example, residues that are contained in helical structures (Selection μScript) are colored red if at least 50% of their maximum surface area is exposed to solvent (Color μScript). Multiple interactive simulations are available simultaneously to the user through the Protein Dashboard.
With the Dynameomics data and semantics available to the DIVE pipeline, we are able to apply a visual analytics approach to the Dynameomics data analysis. As before, we are able to use the Protein Dashboard to interact with and visualize the data. However, because the data flow through the Dynameomics API, wrapped by DIVE datanodes and dataedges, we are able to load multiple protein structures from different sources, including the Protein Data Bank10, align the structures, and perform multiple analyses on them. Furthermore, because the Protein Dashboard has access to additional data from the API, its own utility increases; for instance, it is useful to color protein structures based on biophysical properties such as solvent accessible surface area (SASA) or deviation from a baseline structure. By streaming the data through the pipeline, we can watch these properties, many of which were accessed through the data’s inheritance hierarchy, change over time.
DISCUSSION
The design and implementation of DIVE began as an effort to make the Dynameomics data warehouse accessible to researchers with diverse skills and backgrounds. To achieve this, our design goals included many of the topics discussed above such as visualization, access to large data sets, and interactive-speed data exploration. By necessity, most data analysis tools like DIVE have a degree of functional overlap; basic visualization and data analysis routines are simply required for functionality. However, several features are both novel and useful, particularly in a big-data, interactive setting. Here we discuss these features, their benefits, and how we see them integrating with existing technologies.
Ontological Data Structure
More than simply representing the conceptual structure of the user’s dataset, DIVE’s graph-based data representation is an effective means of organizing data. For example, we have used DIVE to merge two definitions of the same abstract object from disparate datasets through the DIVE object model. These two objects, represented as datanodes in the DIVE runtime pipeline, were linked through property inheritance. This allows the second object to inherit properties from the first object, resulting in a new object definition compatible with both data sources but amenable to new analysis approaches.
In addition to these structural benefits, the datanodes are software objects that are capable of updating both their values and structures at runtime. Furthermore, the ontological context in which these datanodes exist can also be updated at runtime. As a result, DIVE is capable of exploring dynamic data sources as well as handling impromptu user interactions commonly required for visual analysis.
Object Parsing
As shown in the Dynameomics case study, the ability to parse a .NET object or assembly distinct from the DIVE framework circumvents the need to add DIVE specific code to existing programs while augmenting those programs with DIVE capabilities such as graphical interaction and manipulation. In the specific case of the Dynameomics API, we integrated the underlying data structures as well as the streaming functionality into the protein dashboard without modifying the existing API code base. This allowed the same code base to be used within the DIVE framework as well as SQL CLR implementations and other non-DIVE utilities. A tutorial and example of the object parser is available at http://www.dynameomics.org/dive.
Streaming Structured Data
The most obvious benefit of DIVE is big data accessibility through data streaming. The flexibility of interactive SQL effectively provides a visualization front-end for the Dynameomics SQL warehouse. However, for datasets not immediately described by the underlying database schema or other data source, a more advanced method for streaming complex data structures is needed.
We developed pass-through SQL to make hundreds of terabytes of structured data immediately accessible to users. These data are streamed into datanodes and can be accessed either directly or indirectly through the associated ontology (e.g. through property inheritance). Furthermore, these data are preemptively loaded via background threads into backing stores; these backing stores are populated using efficient bulk transfer techniques and predictively cache data for user consumption. Finally, when the object parser is used in conjunction with pass-through SQL, methods as well as data are parsed; thus, the datanodes have access to native .NET functionality in addition to the streaming data. Preexisting programs are also able to benefit from DIVE’s streaming capabilities; Chimera2, a popular molecular visualization package, can open a network socket to DIVE’s streaming module. As a result, Chimera is able to stream MD data directly from the Dynameomics data warehouse.
CONCLUSIONS
Large-scale data analysis will remain a pillar of future scientific investigation; the challenge that faces investigators is how best to leverage modern computational power. DIVE and other visual analytics tools are providing insights about how best to do this. While it is unlikely that any general tool will ever supplant domain-specific tools, the concepts highlighted here – accessibility, extensibility, simplicity of representation, integration, and reusability – will remain important.
Acknowledgments
Dynameomics simulations were performed using computer time through the DOE Office of Biological and Environmental Research as provided by the National Energy Research Scientific Computing Center, which is supported by the Office of Science of the U.S. Department of Energy under contract no. DE-AC02-05CH11231. We are also grateful for support provided by Microsoft through the External Research Program at Microsoft Research (www.microsoft.com/science) (to V.D.), by the National Institutes of Health (GM50789 to V.D.), and by the National Library of Medicine (5T15LM007442 to D.B. and S.J.R.). The authors would also like to acknowledge Robert Su for developing the Protein Dashboard.
Biographies
Steven J. Rysavy is a PhD candidate in the division of Biomedical and Health Informatics at the University of Washington. His research interests include protein structure prediction and visual analytics. He has a MS in computer science from San Francisco State University. Contact him at rysavy@uw.edu.
Dennis Bromley is a PhD candidate in the division of Biomedical and Health Informatics at the University of Washington. His research interests include drug discovery and visual analytics. He has a bachelors degree in computer science from Harvard University. Contact him at dbromley@uw.edu.
Valerie Daggett is a professor in the Department of Bioengineering at the University of Washington. She obtained her PhD from the University of California, San Francisco and was a postdoctoral fellow at Stanford University. Contact her at daggett@uw.edu.
References
- 1.Jones E, Oliphant T, Peterson P. SciPy: Open source scientific tools for Python. 2001 [Online]. Available: http://www.scipy.org.
- 2.Pettersen EF, Goddard TD, Huang CC, et al. UCSF Chimera—a visualization system for exploratory research and analysis. J Comput Chem. 2004;25(13):1605–1612. doi: 10.1002/jcc.20084. [DOI] [PubMed] [Google Scholar]
- 3.Wolstencroft K, Haines R, Fellows D, et al. The Taverna workflow suite: designing and executing workflows of Web Services on the desktop, web or in the cloud. Nucleic Acids Res. 2013;41(W1):W557–W561. doi: 10.1093/nar/gkt328. [DOI] [PMC free article] [PubMed] [Google Scholar]
- 4.Goecks J, Nekrutenko A, Taylor J, et al. Galaxy: a comprehensive approach for supporting accessible, reproducible, and transparent computational research in the life sciences. Genome Biol. 2010;11(8):R86. doi: 10.1186/gb-2010-11-8-r86. [DOI] [PMC free article] [PubMed] [Google Scholar]
- 5.Schroeder W, Lorenson B, Martin K. The Visualization Toolkit: An Object-Oriented Approach to 3-D Graphics. Upper Saddle River, NJ: Prentice Hall; 1996. [Google Scholar]
- 6.Bromley D, Rysavy SJ, Su R, et al. DIVE - A Data Intensive Visualization Engine. Bioinformatics. 2013 doi: 10.1093/bioinformatics/btt721. to be published in. [DOI] [PMC free article] [PubMed] [Google Scholar]
- 7.Bromley D, Anderson PC, Daggett V. Structural Consequences of Mutations to the α-Tocopherol Transfer Protein Associated with the Neurodegenerative Disease Ataxia with Vitamin E Deficiency. Biochemistry. 2013;52(24):4264–4273. doi: 10.1021/bi4001084. [DOI] [PMC free article] [PubMed] [Google Scholar]
- 8.Cock PJA, Antao T, Chang JT, et al. Biopython: freely available Python tools for computational molecular biology and bioinformatics. Bioinformatics. 2009;25(11):1422–1423. doi: 10.1093/bioinformatics/btp163. [DOI] [PMC free article] [PubMed] [Google Scholar]
- 9.Ashburner M, Ball CA, Blake JA, et al. Gene Ontology: tool for the unification of biology. Nat Genet. 2000;25(1):25–29. doi: 10.1038/75556. [DOI] [PMC free article] [PubMed] [Google Scholar]
- 10.Bernstein FC, Koetzle TF, Williams GJB, et al. The protein data bank: A computer-based archival file for macromolecular structures. J Mol Biol. 1977;112(3):535–542. doi: 10.1016/s0022-2836(77)80200-3. [DOI] [PubMed] [Google Scholar]
- 11.Shannon P, Markiel A, Ozier O, et al. Cytoscape: a software environment for integrated models of biomolecular interaction networks. Genome Res. 2003;13(11):2498–2504. doi: 10.1101/gr.1239303. [DOI] [PMC free article] [PubMed] [Google Scholar]
- 12.OSGi Service Platform, Release 3. IOS Press, Inc; 2003. [Google Scholar]