

Significance
This manuscript describes a previously unidentified mechanism for organic cation transporter 1 (OCT1), the major hepatic metformin transporter, in hepatic steatosis. Here we show that OCT1, long thought to function primarily as a transporter for drugs, functions as a major thiamine transporter in the liver, which has profound implications in cellular metabolism. Collectively, our results point to an important role of thiamine (through OCT1) in hepatic steatosis and suggest that the modulation of thiamine disposition by metformin may contribute to its pharmacologic effects.
Keywords: fatty liver disease, diabetes, vitamin B1
Abstract
Organic cation transporter 1, OCT1 (SLC22A1), is the major hepatic uptake transporter for metformin, the most prescribed antidiabetic drug. However, its endogenous role is poorly understood. Here we show that similar to metformin treatment, loss of Oct1 caused an increase in the ratio of AMP to ATP, activated the energy sensor AMP-activated kinase (AMPK), and substantially reduced triglyceride (TG) levels in livers from healthy and leptin-deficient mice. Conversely, livers of human OCT1 transgenic mice fed high-fat diets were enlarged with high TG levels. Metabolomic and isotopic uptake methods identified thiamine as a principal endogenous substrate of OCT1. Thiamine deficiency enhanced the phosphorylation of AMPK and its downstream target, acetyl-CoA carboxylase. Metformin and the biguanide analog, phenformin, competitively inhibited OCT1-mediated thiamine uptake. Acute administration of metformin to wild-type mice reduced intestinal accumulation of thiamine. These findings suggest that OCT1 plays a role in hepatic steatosis through modulation of energy status. The studies implicate OCT1 as well as metformin in thiamine disposition, suggesting an intriguing and parallel mechanism for metformin and its major hepatic transporter in metabolic function.
Organic cation transporter 1 (OCT1), which is abundantly expressed in human liver, plays an important role in drug disposition and response (1, 2). OCT1 acts in the hepatic uptake of several prescription drugs, most notably, the antidiabetic agent metformin (3, 4). Because of its multispecificity for many xenobiotics and its abundant expression in the liver, it has been proposed that the primary role of OCT1 is to work in concert with drug-metabolizing enzymes (e.g., cytochrome P450s) in detoxification pathways in the liver (5). In fact, with the exception of changes in hepatic drug disposition, Oct1 knockout mice appear healthy with no obvious phenotypic abnormalities (3, 6).
Metformin exerts major effects on glucose and lipid metabolism in the liver, and OCT1 has been well established as the primary hepatic transporter for the drug (3, 4). Recent studies suggest that the mechanisms that underlie metformin’s effects on glucose and lipid metabolism differ (7–9). In particular, Foretz and coworkers showed that AMP-activated kinase (AMPK) is not essential for the effects of metformin on hepatic glucose output (7, 8). In contrast, AMPK activation appears to be sufficient for metformin-induced lipogenic gene expression and beneficial effects on hepatic steatosis (7, 10, 11). However, the precise mechanism leading to the activation of AMPK remains unclear.
Here we show that Oct1 deficiency results in reduced hepatic steatosis and phosphorylation of AMPK and its downstream target acetyl-CoA carboxylase (ACC). We next demonstrate that OCT1 is a major hepatic transporter for thiamine, vitamin B1, and that Oct1 deficiency results in reduced hepatic levels of thiamine and its active metabolite, thiamine pyrophosphate (TPP). In parallel experiments, we show that dietary restriction of thiamine decreases hepatic steatosis, while increasing phosphorylation of AMPK and ACC. These studies suggest that the mechanism by which Oct1 deficiency modulates hepatic steatosis is related to decreased levels of thiamine and TPP in the liver, resulting in a change in hepatic energy status. Our studies also suggest that metformin affects thiamine disposition and that this mechanism may contribute to its overall pharmacologic action.
Results
Livers From Oct1−/− Mice and Oct1−/− Mice Crossed With Leptin Deficient Mice Showed Significantly Reduced Triglyceride Accumulation.
Oct1−/− mice grew and bred normally, but had slightly greater body weights than Oct1+/+ mice, particularly after 16 wk (SI Appendix, Fig. S1 A and B). The average ratio of liver to body weight, LW/BW, of the Oct1−/− mice was about 3.84% compared with 5.15% in the Oct1+/+ mice (***P < 0.0001) (Fig. 1A), reflecting both an increase in body weight and a decrease in liver weight. Similar to the lean mice, the mean LW/BW ratio of the Oct1−/− crossed with leptin deficient mice (Oct1−/−, ob/ob) (4.35%) was significantly reduced compared with that of the Oct1+/+, ob/ob mice (6.42%) (**P = 0.003) (Fig. 1A). Direct measurements of triglyceride (TG) levels as well as Oil Red O (ORO) and hematoxylin and eosin (H&E) staining were consistent with reduced fat content in the livers of both Oct1−/− and Oct1−/−, ob/ob mice compared with their Oct1+/+ counterparts (Fig. 1 B and C). The pathology scores of the livers, according to the minimal Kleiner/Brunt criteria (12), indicated that the steatosis and nonalcoholic fatty liver disease (NAFLD) in Oct1−/− or Oct1−/−,ob/ob mouse livers improved compared with the wild-type (WT) controls (SI Appendix, Fig. S1C). Tight junction staining (ZO-1) suggested that there may be differences in polarity due to the change of Oct1 expression, although ploidy did not change (SI Appendix, Fig. S1 D and E). In Oct1−/− and Oct1−/−, ob/ob mouse livers, TG levels were about 26% and 32% lower than those in livers from Oct1+/+ and Oct1+/+, ob/ob mice, respectively (Fig. 1B). Hepatocytes isolated from Oct1−/− mice were smaller than those from Oct1+/+ mice (SI Appendix, Fig. S1F), consistent with the reduced LW/BW ratio. Oct1 deletion had no effects on plasma TG and insulin levels in either wild-type or leptin-deficient mice (SI Appendix, Fig. S1G); however, differences in selected TGs, were observed in liver extracts from Oct1−/− mice and wild-type animals (SI Appendix, Table S1).
Fig. 1.

Oct1 deficiency results in significantly reduced liver TG content. (A) Liver weight/body weight ratios of Oct1+/+, Oct1−/−, Oct1+/+,ob/ob, and Oct1−/−,ob/ob mice (n = 10 per genotype for lean mice and n = 6 per genotype for ob/ob mice). (B) Quantification of TG amounts in the livers from mice with four genotypes shown in A. (C) Representative Oil red O-stained (ORO) (Upper) and H&E-stained (Lower) sections of livers. (Scale bar, 50 μm.)
Increased β-Oxidation and Activated AMPK Contributed to the Reduced TG Content in the Livers from Oct1−/− Mice.
Metabolomic profiling of liver extracts indicated that many metabolites in the livers from Oct1−/− mice were elevated in comparison with wild-type livers (SI Appendix, Table S2). Carnitine and its metabolites, acetylcarnitine and malonylcarnitine (SI Appendix, Fig. S2 A–C), which are associated with increased β-oxidation of fatty acid or fatty acid chain elongation/biosynthesis in the liver (13, 14), were among the most significantly elevated. Direct measurements revealed that fatty acid oxidation rates in Oct1−/− hepatocytes were significantly greater (∼50%) than in Oct1+/+ hepatocytes (15) (SI Appendix, Fig. S2D). TG synthesis, but not secretion, was modestly reduced in the primary hepatocytes of Oct1−/− (SI Appendix, Fig. S2E).
Protein levels of key enzymes involved in lipid metabolism, particularly liver kinase B1 (LKB1), phosphorylated AMPK-alpha (P-AMPKα), and phosphorylated ACC (P-ACC) (10, 11, 16–18) showed marked differences in livers from Oct1−/− mice compared with their wild-type counterparts (Fig. 2A). In livers from Oct1−/− and Oct1−/−, ob/ob the levels of the phosphorylated form of AMPKα (T172), the major regulatory subunit in the AMPK complex, as well as the phosphorylated β1 subunit (S108) were about twofold greater than those in livers from Oct1+/+ and Oct1+/+, ob/ob mice (Fig. 2B and SI Appendix, Fig. S2F). Staining of P-AMPK revealed a global increase in P-AMPK in the livers of Oct1−/− mice (SI Appendix, Fig. S2G). Effects of Oct1 deletion were apparent in the liver but not in other tissues (SI Appendix, Fig. S2H). Levels of p-ACC (18), normalized to ACC, were also increased 2.9- and 3.6-fold in livers from Oct1−/− and Oct1−/−, ob/ob mice, respectively, compared with their wild-type counterparts (Fig. 2B and SI Appendix, Fig. S2F). Reduced expression levels of critical metabolic transcription factors, which may have been a result of activation of AMPK, including Creb1, Crtc2, Pgc1α, and Srebp1 were observed in the livers of Oct1−/− and Oct1−/−, ob/ob mice (SI Appendix, Fig. S2 I and J).
Fig. 2.
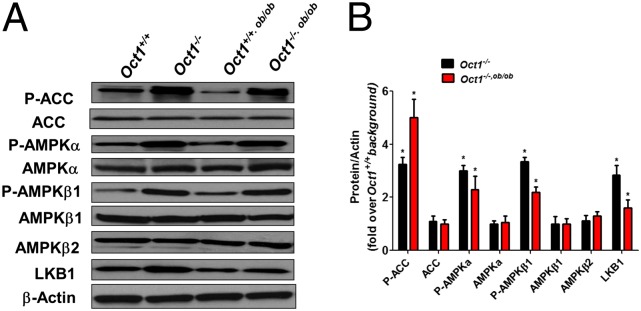
Oct1−/− mouse livers exhibit changes in enzymes related to steatosis. (A) Representative Western blots of key regulatory enzymes, ACC, AMPK, and LKB1 involved in lipid metabolism. (B) Quantification of Western blotting.
Metabolomic Studies Reveal That Thiamine Is a Principal Endogenous Substrate of OCT1.
To identify endogenous substrates of OCT1, extracts from HEK293-OCT1 and HEK293-empty vector (EV) cells were analyzed by hydrophilic interaction chromatography profiling (HILIC-LC/MS) (SI Appendix, Table S3). Twenty metabolites were overrepresented in the HEK293-OCT1 cells, including 2-methylbutyrylcarnitine, a metabolite that is elevated in patients with NAFLD (Fig. 3A) (19). Notably, thiamine was among the most significantly elevated metabolites, ***P = 0.00016 (Fig. 3B). Through isotopic studies, the uptake of thiamine in cells expressing hOCT1 and mOct1 indicated that OCT1 is a high-capacity but low-affinity thiamine transporter with a Vmax of 2.77 ± 0.14 nmol/mg protein/min and a Km of 0.78 ± 0.064 mM for the human ortholog (Fig. 3 C and D and SI Appendix, Table S4). At 100 nM, a physiologically relevant concentration, thiamine uptake was substantially greater in cells expressing thiamine transporters than in control cells (SI Appendix, Fig. S3 A and B). In addition, serotonin and other monoamines were transported to some extent by the mouse and human OCT1 orthologs (SI Appendix, Fig. S3C). Other transporters [OCTs and multidrug and toxin extrusion transporters (MATEs)] took up thiamine as well (SI Appendix, Fig. S3B and Table S4). The uptake of thiamine and serotonin was reduced about 70% and 28%, respectively, in cultured primary Oct1−/− hepatocytes compared with WT cells (SI Appendix, Fig. S3D).
Fig. 3.

Metabolomic study in stably transfected cells reveals that thiamine is a principal substrate of OCT1/Oct1. (A) Relative abundance of 2-methylbutyrylcarnitine and (B) thiamine in HEK293-EV and HEK293-OCT1 from metabolomic studies (n = 6 cell lines per group). (C) Time course of uptake of [3H]thiamine in HEK293-EV and HEK293-hOCT1 cells. (D) Kinetics of [3H]thiamine uptake by human OCT1, mouse Oct1, and mouse Slc19a2 transporters. Kinetics parameters are summarized in SI Appendix, Table S4.
Oct1 Serves as a Hepatic Thiamine Transporter in Vivo.
In extracts of liver isolated from Oct1−/− mice on normal diets, LC/MS methods revealed that the levels of thiamine metabolites, thiamine monophosphate (TMP) and TPP, were reduced by about 62% and 50%, respectively, in comparison with liver extracts from Oct1+/+ mice (Fig. 4A and SI Appendix, Fig. S4A). LC/MS analysis revealed higher levels of the substrates of TPP-dependent enzymes, pyruvate dehydrogenase (PDH) and alpha-ketoglutarate dehyrogenase, in the serum of Oct1−/− mice in comparison with serum from wild-type mice (SI Appendix, Fig. S4B). We measured glycolysis in primary hepatocytes using the universally labeled [U-14C]glucose as a substrate. The release of [14C]CO2 from Oct1−/− hepatocytes was about 36% lower than that from the wild-type hepatocytes (SI Appendix, Fig. S4C), consistent with reduced glycolysis. After i.v. dosing, higher initial plasma levels of total thiamine products (thiamine and its metabolites) were observed in Oct1−/− mice in comparison with Oct1+/+ mice (Fig. 4B) due in part to reduced hepatic and intestinal uptake. Further analysis revealed that the levels of total thiamine products in Oct1−/− mouse livers and intestine (duodenum, jejunum, and ileum) were reduced by more than 50% in comparison with those in the same tissues from wild-type mice but not from other organs (Fig. 4C and SI Appendix, Fig. S4D). Following intraperitonal injection, thiamine product showed similar trends, i.e., higher initial plasma levels and lower levels in the liver and intestine of Oct1−/− compared with wild-type mice (SI Appendix, Fig. S4E). In mouse liver, Oct1 was the most highly expressed among the thiamine transporters (Fig. 4D). Deletion of Oct1 resulted in significant up-regulation of the mRNA transcripts of Oct2 and Oct3 (SI Appendix, Fig. S4F). Among the thiamine-related enzymes, expression level of PDH was increased in Oct1−/− mouse livers, probably due to feedback mechanisms (SI Appendix, Fig. S4F). Moreover, both X-Gal staining and immunostaining revealed that Oct1 was predominantly expressed in hepatocytes surrounding central veins, validated by the central vein marker glutamate synthetase (GS) (Fig. 4E) (20), the major site of hepatic lipid metabolism and glycolysis (21). The major TPP-dependent enzyme PDH was also preferentially expressed around the central vein (Fig. 4F). Consistent with previous results (22), dietary restriction of thiamine for 3 wk resulted in lowered LW/BW ratios and hepatic TG levels (reduced more than 50%) (Fig. 4G and SI Appendix, Fig. S4G) as well as activation of AMPK (SI Appendix, Fig. S4H), implying that thiamine deficiency can exert prominent effects on hepatic steatosis.
Fig. 4.

Characterization of the role of Oct1 on thiamine disposition in vivo and its hepatic location. (A) Level of thiamine derivatives: thiamine monophosphate (TMP) and thiamine pyrophosphate (TPP) in Oct1+/+ and Oct1−/− mouse liver extracts. (B) Total [3H]thiamine radioactivity in plasma from Oct1+/+ and Oct1−/− mice after administration of an i.v. dose of [3H]thiamine. (C) Total [3H]thiamine radioactivity in various tissues from Oct1+/+ and Oct1−/− mice 5 min after administration of an i.v. dose of [3H]thiamine. Data were normalized to WT in the corresponding tissues, which were set at 100%. (D) mRNA expression levels of various thiamine transporters in livers from WT mice. The expression level was normalized to the Slc19a3 set at 1. (E) Central vein is the primary expression location of Oct1 in mouse liver. (Upper) X-Gal detection of enzymatic lacZ activity (panel 1) and immunofluorescence staining of β-Gal in liver sections from Oct1−/− mice (panel 2). (Lower) Immunofluorescence staining of liver sections of the central vein marker glutamine synthetase (GS, red, panel 3), β-Gal (green, panel 4), and merged (panel 5) from Oct1−/− mice. (White scale bar, 50 μm; red scale bar, 25 μm.) (F) Immunofluorescence staining of the key glycolysis enzyme pyruvate dehydrogenase (PDH), which is primarily localized in the vicinity of the central vein. (Left) GS, red; (Center) PDH, green; (Right) overlap, yellow. (Scale bar, 50 μm.) (G) Representative livers (Left) and TG levels (Right) from WT mice fed thiamine-deficient (TD) diet or normal diet (n = 6 for each diet) for 3 wk. All data are mean ± SEM *P < 0.05, **P < 0.01, ***P < 0.001.
Human OCT1 Transgenic Mice Showed Significantly Higher TG Concentrations and Enlarged Liver Sizes.
In general, human transgenic mouse lines created in two backgrounds: Oct1+/+,OCT1tg and Oct1−/−,OCT1tg (Fig. 5A and SI Appendix, Fig. S5 A–C) reversed the phenotypes of Oct1−/− mice. Albumin promoter-driven human OCT1 was expressed mainly in mouse liver and at high levels comparable to those in human liver (SI Appendix, Fig. S5C). Similar to the mouse Oct1, the OCT1 human transgene was preferentially localized to the perivenous (central vein) zone (Fig. 5A). The OCT1 transgene rescued the phenotype of Oct1 deletion, significantly enhancing fat accumulation in the livers of Oct1−/−,OCT1tg mice fed normal chow (SI Appendix, Fig. S5D). TG levels in the livers of Oct1+/+,OCT1tg mice increased more than 50% over levels in wild-type mouse livers (SI Appendix, Fig. S5E). In mice fed high-fat diets, magnetic resonance imaging (MRI) indicated that liver volumes of Oct1+/+,OCT1tg mice were increased by about 56% and fat percentage was increased by more than 40%, compared with the wild-type mice (SI Appendix, Table S5 and Fig. 5B). Consistent with a role of OCT1 in lipogenesis, mRNA and protein levels of key metabolic enzymes were enhanced in the livers from transgenic Oct1+/+,OCT1tg mice, in comparison with those from the wild-type mice (SI Appendix, Fig. S5 F and G). TG levels along with levels of key lipogenic genes were increased in Huh7 cells overexpressing OCT1 in comparison with control cells (SI Appendix, Fig. S5H). In addition, the OCT1 transgene enhanced the hepatic uptake and reduced the plasma levels of thiamine products and metformin after in vivo administration (SI Appendix, Fig. S5 I–K). Metformin stimulated AMPK activation, liver weights, and serum liver enzymes increased significantly in the OCT1 transgenic mice, compared with wild-type mice (SI Appendix, Table S5 and Fig. S5 L and M). Under an intestine-specific promoter of Caenorhabditis elegans, OCT1-transfected animals showed increased TG levels by Nile red staining compared with the vector-only transfected worms (SI Appendix, Fig. S5N).
Fig. 5.

Human OCT1 transgenic mice fed a high-fat diet show significantly higher TG concentrations and enlarged liver sizes. (A) Location of transgenic hOCT1 in liver sections from Oct1+/+, Oct1−/−,OCT1tg, and Oct1+/+,OCT1tg mice. Yellow arrows indicate the sporadic expression of hOCT1. Red arrows indicate that hOCT1 is expressed around the central vein. (Lower Right) Magnification 20×, compared with other panels (10×). (White scale bar, 50 μm; red scale bar, 25 μm.) (B) Representative MRI of livers from mice. The heat map from blue to red represents the fat content from low to high. MRI parameters are summarized in SI Appendix, Table S5. (Scale bar, 4 mm.)
The Role of OCT1 on Pharmacological Actions of Metformin, ATP Production, and AMPK Activation.
Finally, our study suggests that OCT1 function, as a crucial hepatic thiamine transporter, may explain an unappreciated mechanism for the effect of metformin on hepatic steatosis. In particular, reduced steatosis and modulated levels of key genes, e.g., enhanced phosphorylated ACC, in the livers of Oct1−/− mice mimic those observed in metformin-treated mice with hepatic steatosis (9, 10, 16). Moreover, the major life-threatening side effect of metformin, lactate acidosis, can be induced by thiamine deficiency (23). Metformin action in the liver has been associated with reduced ATP production in the mitochondria (7). Similarly decreased TPP-associated enzyme activity results in reduced ATP production by glycolysis (24). Based on these observations, we hypothesized that in addition to inhibition of complex 1, metformin may also act through inhibition of OCT1-mediated thiamine uptake in the liver and intestine to exert its pharmacological effect on cellular energy status through the glycolytic pathway. To test our hypothesis, we conducted metformin–thiamine interaction studies. Metformin and its biguanide analog, phenformin, reduced thiamine uptake in OCT1- and OCT2-expressing cells with phenformin having greater potency for both transporters (Fig. 6A and SI Appendix, Fig. S6A). The pattern of thiamine and metformin uptake in cells expressing 13 OCT1 polymorphisms (3) was similar (Fig. 6B), whereas MPP+ exhibited a different pattern (SI Appendix, Fig. S6B), suggesting that the two compounds (metformin and thiamine), which exhibit structural similarities (SI Appendix, Fig. S6B) share a similar OCT1 binding site. Coadministration of metformin with thiamine in wild-type mice resulted in higher initial plasma levels of total thiamine products than those in mice dosed with thiamine solely (SI Appendix, Fig. S6C). Intestinal levels of thiamine products in wild-type mice coadministered thiamine and metformin via the i.v. route were significantly lower than those in mice treated solely with thiamine (Fig. 6C); however, levels of thiamine products in livers from mice treated with metformin tended to be lower but were not significantly different (Fig. 6C). Further, we observed that metformin treatment resulted in significant reductions in systemic levels of thiamine and TPP in the plasma (Fig. 6D); however again, no significant effect on liver thiamine levels was apparent. Decreased plasma levels of thiamine following metformin treatment are consistent with previous studies in dogs that received phenformin (25).
Fig. 6.

The effect of metformin, Oct1, and thiamine deficiency on OCT1-mediated thiamine disposition and liver energy status. (A) The inhibitory effect of metformin and phenformin on OCT1-mediated [3H]thiamine uptake (IC50: metformin, 1.4 mM; phenformin, 0.07 mM). (B) Thiamine and metformin uptake by nonsynonymous human OCT1 genetic polymorphisms. OCT1-ref refers to the reference OCT1 without any of the nonsynonymous polymorphisms. (C) [3H]thiamine accumulation in various tissues from Oct1+/+ mice 5 min after i.v. treatment with [3H]thiamine (2 mg/kg) alone (white bars) or [3H]thiamine (2 mg/kg) plus metformin (50 mg/kg) (black bars). (D) Plasma levels of thiamine and its metabolites in wild-type C57BL/6J mice treated with metformin (100 mg/kg, i.p.) or saline for 7 d. *P < 0.05, **P < 0.01 compared with the mice treated with saline; n = 3 (saline) and n = 5 (metformin). (E) Quantifications of P-ACC (using ELISA, see SI Appendix) and AMP/ATP ratio in liver cell lysates from mice that were fed a normal diet or a thiamine-deficient diet for 7 d. (F) Adenine nucleotide ratios (AMP/ATP and ADP/ATP) in livers from Oct1+/+ and Oct1−/− mice. All data are mean ± SEM *P < 0.05, **P < 0.01, ***P < 0.001. (G) Cartoon illustration of the physiological role of OCT1 in thiamine disposition in the liver. Reduced hepatic thiamine and consequently lower TPP levels occur as a result of deletion of OCT1 or potentially from metformin treatment. The reduced ATP production as a result of decreasing PDH-TPP and OGDH-TPP activity may further activate AMPK and ACC, triggering β-oxidation to increase the shortfall of energy in the hepatocytes. Metformin treatment may mimic this effect. Red arrows represent the pathways; black up arrow represents increased levels or activities; black down arrow represents reduced levels or activities.
To directly examine the effects of Oct1 deficiency, thiamine levels, and metformin treatment on nucleotide ratios and energy status, we performed a series of in vitro and in vivo studies. First, we attempted to determine the effects of thiamine levels and their time course on nucleotide ratios in isolated hepatocytes. Unfortunately, even after thiamine was removed from the media for 16 h, intracellular TPP levels remained high (SI Appendix, Fig. S6D), consistent with previous observations (26). As a result, the time course and effect of thiamine depletion on nucleotide ratios as well as on phosphorylation of AMPK and ACC could not be assessed. However, in liver cell lysates isolated from wild-type mice fed thiamine-deficient (TD) diets for 1 wk, the ratio of AMP/ATP and P-ACC levels was elevated (Fig. 6E and SI Appendix, Fig. S6 E and F), consistent with an effect of thiamine depletion on energy production, as has been observed previously (27). Consistently, β-oxidation (of 14C-palmitic acid) was also elevated in hepatocytes isolated from the mice fed thiamine-deficient diets for 1 wk (3.8 ± 1.0 dpm/µg protein/2 h for Oct1+/+ mice on a thiamine-deficient diet versus 3.0 ± 0.3 dpm/µg protein/2 h for Oct1+/+ mice on normal chow). Of note, the thiamine-deficient diet did not produce significant effects on food consumption, body weight, liver weight, or liver weight/body weight ratios after 1 wk, although caution is needed in the interpretation of these experiments because thiamine deficiency is associated with many systemic changes such as growth retardation and beriberi. Because thiamine depletion would be expected to affect energy production through reduction in glycolysis and Kreb’s cycle, we examined the effects of the glycolytic pathway on energy status in the isolated hepatocytes, using the glycolytic inhibitor, lonidamine. In hepatocytes isolated from Oct1+/+, lonidamine substantially enhanced P-AMPK levels as well as the AMP/ATP ratio (SI Appendix, Fig. S6G). Similarly, in hepatocytes from Oct1−/− mice, lonidamine enhanced P-AMPK levels and nucleotide ratios, although baseline values were elevated. These data are consistent with the involvement of glycolysis in energy production in hepatocytes isolated from both wild-type and knockout mice; however the effect of inhibition of glycolysis was less apparent in the knockout mice because glycolysis is presumably already reduced by Oct1 deficiency. Oct1 deficiency and treatment with metformin have similar effects on nucleotide levels and markers of cellular metabolism. In particular, hepatocytes from Oct1−/− mice had elevated phosphorylated ACC and AMPK levels similar to hepatocytes from wild-type mice treated with metformin (SI Appendix, Fig. S6H). Further, AMP/ATP and ADP/ATP ratios in livers from Oct1−/− mice were 2.1- and 1.4-fold greater than those in wild-type mice (Fig. 6F and SI Appendix, Fig. S6F), indicating a fundamental change in energy status in the livers of Oct1−/− mice, again paralleling many effects that have been observed with metformin treatment. The data suggest that the metabolic state of the liver caused by thiamine deficiency resembles that induced by metformin treatment (SI Appendix, Fig. S6 F and H). Because our data show that metformin inhibits OCT1-mediated thiamine uptake in vitro (Fig. 6A) and in vivo (Fig. 6 C and D), it is intriguing to speculate that reduced thiamine levels could contribute to metformin’s reduction in cellular energy status.
Discussion
Thiamine transport has been previously attributed to two high-affinity sodium dependent thiamine specific transporters (SLC19A2 and SLC19A3) (28), although recent studies using small molecule OCT inhibitors in untransfected Caco2 cells suggest that thiamine may also be a substrate of organic cation transporters (29). Through both metabolomic and isotopic uptake studies in OCT1 transfected cells, our data directly demonstrated that human OCT1 and mouse Oct1 are high-capacity thiamine transporters (Fig. 3 B–D and SI Appendix, Tables S3 and S4), which presumably function in the hepatic uptake of large amounts of dietary thiamine.
The current findings enrich our understanding of thiamine disposition. As a high-capacity thiamine transporter, OCT1 is particularly important in the liver, which receives large doses of thiamine from the diet. In particular, its location in the central vein is consistent with the metabolic reactions catalyzed by the critical glycolytic enzyme cofactor, TPP, especially, glycolysis that is linked to liponeogenesis (21, 30, 31). The primary effect of Oct1 deletion on TG levels was observed in the liver, whereas circulating TG levels were not changed (SI Appendix, Fig. S1G). Lack of effects on circulating TG may be due to a greater availability of thiamine to nonhepatic tissues because of reduced Oct1-mediated hepatic extraction in the knockout mice. Higher availability of thiamine in peripheral tissues may result in higher metabolic activities in those tissues opposing the beneficial effects of Oct1 deletion on circulating triglyceride levels. Whereas our data suggest that hepatic thiamine deficiency explains the major phenotypes observed in Oct1−/− mice, the role of other endogenous substrates of OCT1 such as serotonin (32) needs further study.
The striking reduction in hepatic TG levels in WT mice fed TD diets (Fig. 4G) is consistent with the phenotypes in Oct1−/− mice, which also have reduced hepatic thiamine levels (Fig. 4A and SI Appendix, Fig. S4A), supporting the notion that hepatic thiamine deficiency leads to reduced hepatic steatosis. Increased rates of fatty acid oxidation in the livers of Oct1−/− mice, as reflected by our direct measurements and the elevated levels of carnitine and acetylcarnitine (SI Appendix, Fig. S2 A and B), carriers of fatty acids in the β-oxidation pathways, may provide an energy source for the liver to compensate for the reduced glycolysis triggered by reduced hepatic thiamine levels. The enhanced fatty acid oxidation may provide a mechanism for the liver to cope with the energy shortfall due to the insufficient energy production through glycolysis in Oct1−/− mice (33). Reduced glycolysis led to increased AMP/ATP levels activating AMPK and thus directly increasing fatty acid oxidation.
Our results have important implications for NAFLD, a disease associated with obesity that affects one-third of adults in the United States and can lead to hepatic cirrhosis (34). Currently, there are no approved treatments for NAFLD although metformin is widely used off-label (35). The phenotypes observed in the livers of Oct1+/+,OCT1,tg and Oct1−/−,OCT1,tg mice suggest a role for human OCT1 in NAFLD. Overexpressing the human ortholog of Oct1 in mouse livers clearly resulted in increases in steatosis (Fig. 5B), suggesting a significant role of the transporter in regulating lipid metabolism in human liver. To further substantiate the role, we measured OCT1 transcripts and TG levels in 60 human liver samples and observed a significant correlation of OCT1 transcript levels with TG levels (SI Appendix, Fig. S7A, r = 0.408, P = 0.016). Similarly, analysis of a publicly available microarray dataset (GSE24807) (36) revealed significantly higher OCT1 expression levels in 12 liver samples from patients with NAFLD compared with 5 normal liver samples, (***P < 0.0002; SI Appendix, Fig. S7B). Interestingly, genome-wide association studies have identified loci in SLC22A1 that associate with lipid traits (37) and plasma levels of isobutyrylcarnitine (38). Collectively, these data have implications for a role of OCT1 in NAFLD, suggesting OCT1 as a target for its treatment.
Our results suggest that OCT1 may also play a role in metformin action, which goes beyond its well-established role in mediating the hepatic uptake of metformin (3, 4). In particular, our studies suggest parallel effects of Oct1 deletion with the pharmacologic effects of metformin. Both metformin and Oct1 deletion have similar effects on glycolysis, lipogenesis, and energy status of hepatocytes and on key enzymes such as AMPK and ACC. Metformin shows efficacy in treating fatty liver in ob/ob mice, analogous to our results in ob/ob, Oct1−/− double mutant mice (Fig. 1 A and B) (9).
Although recent studies call into question the role of AMPK in the effects of metformin on hepatic gluconeogenesis (7, 8), activation of AMPK, and reduced nuclear translocation of sterol regulatory element-binding protein 1, appears to be important for metformin’s effects on hepatic steatosis (7, 9–11, 16). Studies suggest that metformin activates AMPK by reducing mitochondrial energy output, (39, 40). Our studies suggest that through competitive inhibition of thiamine uptake by OCT1, biguanides (Fig. 6 A and C), may reduce TPP levels, resulting in a lower energy status and activation of AMPK. Hepatocytes from thiamine-deficient mice showed enhance levels of P-ACC and adenosine nucleotide levels (Fig. 6E). We propose that reduced glycolysis because of reduced levels of TPP results in decreased production of ATP via the Kreb’s cycle and consequently, elevated ratios of AMP and ADP to ATP (Fig. 6F and SI Appendix, Fig. S6G). It is also possible that reduced production of NADH through reduced activity of alpha-ketoglutarate dehydrogenase, another TPP-associated enzyme, may result in lower mitochondrial ATP production. Thus, OCT1 may have a dual role in metformin’s pharmacologic effects in the liver, serving as a transporter for metformin and as a target for metformin’s effects on AMPK. The lower circulating thiamine and TPP levels that were observed after chronic metformin treatment of wild-type mice (Fig. 6D) may be due to interactions of metformin with other transporters or enzymes in addition to Oct1.
Unlike metformin treatment, Oct1 deficiency did not result in reduced fasting blood glucose levels in mice, which is a major effect of metformin. This difference is likely because metformin’s effects on glucose levels occur via multiple mechanisms and in multiple tissues, whereas Oct1 is primarily a liver transporter (3). Thus, metformin may affect fasting blood glucose through peripheral effects on glucose utilization and synthesis as well as central effects on glucose output from the liver (7). Further, our studies were conducted primarily in mice without diabetes. Metformin does not have notable effects on fasting glucose levels in nondiabetic animals (10). In summary, OCT1, a principal transporter of thiamine in the liver, regulates energy status and AMPK activation and ACC inhibition resulting in effects on hepatic TG content (Fig. 6G). Our study suggests that metformin reduces systemic and tissue levels of thiamine, which may contribute to its beneficial effects on hepatic steatosis.
Materials and Methods
Detailed materials and methods are reported in SI Appendix, SI Materials and Methods.
Oct1−/− mice were generated as previously described (3) in FVB/N or C57BL/6J background (SI Appendix, SI Materials and Methods). Animal studies described herein were reviewed and approved by the University of California, San Francisco's Institutional Animal Care and Use Committee. In general, animal studies were conducted in male mice between 16 and 20 wk of age as described in SI Appendix. Experiments in cultured cells and transport studies are described in detail in SI Appendix and were described previously (3). Metabolomic studies were performed in the Metabolomics Core of the Unversity of California, Davis Genome Center as described in SI Appendix. All 1H MRI was conducted on a 14.1T wide-bore microimaging system (Agilent Technologies) as described in SI Appendix. Data are expressed as mean ± SEM. For statistical analysis, the Student t test was used.
Supplementary Material
Acknowledgments
We thank Dr. John Watson, Dr. Oliver Fiehn, and others (see SI Appendix) for their advice. We acknowledge the University of California, Davis, West Coast Metabolomics Center, University of California San Francisco Liver Center, and Gladstone Genomics Core for technical support. This work was supported by Grants GM36780 (to K.M.G.) and GM61390 (to K.M.G.) and an Award K99 EB014328 (to K.R.K.) from the National Institutes of Health.
Footnotes
The authors declare no conflict of interest.
This article is a PNAS Direct Submission.
This article contains supporting information online at www.pnas.org/lookup/suppl/doi:10.1073/pnas.1314939111/-/DCSupplemental.
References
- 1.Giacomini KM, et al. International Transporter Consortium Membrane transporters in drug development. Nat Rev Drug Discov. 2010;9(3):215–236. doi: 10.1038/nrd3028. [DOI] [PMC free article] [PubMed] [Google Scholar]
- 2.Koepsell H, Lips K, Volk C. Polyspecific organic cation transporters: Structure, function, physiological roles, and biopharmaceutical implications. Pharm Res. 2007;24(7):1227–1251. doi: 10.1007/s11095-007-9254-z. [DOI] [PubMed] [Google Scholar]
- 3.Shu Y, et al. Effect of genetic variation in the organic cation transporter 1 (OCT1) on metformin action. J Clin Invest. 2007;117(5):1422–1431. doi: 10.1172/JCI30558. [DOI] [PMC free article] [PubMed] [Google Scholar]
- 4.Wang DS, et al. Involvement of organic cation transporter 1 in hepatic and intestinal distribution of metformin. J Pharmacol Exp Ther. 2002;302(2):510–515. doi: 10.1124/jpet.102.034140. [DOI] [PubMed] [Google Scholar]
- 5.Zhang L, Strong JM, Qiu W, Lesko LJ, Huang SM. Scientific perspectives on drug transporters and their role in drug interactions. Mol Pharm. 2006;3(1):62–69. doi: 10.1021/mp050095h. [DOI] [PubMed] [Google Scholar]
- 6.Jonker JW, et al. Reduced hepatic uptake and intestinal excretion of organic cations in mice with a targeted disruption of the organic cation transporter 1 (Oct1 [Slc22a1]) gene. Mol Cell Biol. 2001;21(16):5471–5477. doi: 10.1128/MCB.21.16.5471-5477.2001. [DOI] [PMC free article] [PubMed] [Google Scholar]
- 7.Viollet B, et al. Cellular and molecular mechanisms of metformin: An overview. Clin Sci (Lond) 2012;122(6):253–270. doi: 10.1042/CS20110386. [DOI] [PMC free article] [PubMed] [Google Scholar]
- 8.Foretz M, et al. Metformin inhibits hepatic gluconeogenesis in mice independently of the LKB1/AMPK pathway via a decrease in hepatic energy state. J Clin Invest. 2010;120(7):2355–2369. doi: 10.1172/JCI40671. [DOI] [PMC free article] [PubMed] [Google Scholar]
- 9.Lin HZ, et al. Metformin reverses fatty liver disease in obese, leptin-deficient mice. Nat Med. 2000;6(9):998–1003. doi: 10.1038/79697. [DOI] [PubMed] [Google Scholar]
- 10.Zhou G, et al. Role of AMP-activated protein kinase in mechanism of metformin action. J Clin Invest. 2001;108(8):1167–1174. doi: 10.1172/JCI13505. [DOI] [PMC free article] [PubMed] [Google Scholar]
- 11.Zang M, et al. AMP-activated protein kinase is required for the lipid-lowering effect of metformin in insulin-resistant human HepG2 cells. J Biol Chem. 2004;279(46):47898–47905. doi: 10.1074/jbc.M408149200. [DOI] [PubMed] [Google Scholar]
- 12.Kleiner DE, et al. Nonalcoholic Steatohepatitis Clinical Research Network Design and validation of a histological scoring system for nonalcoholic fatty liver disease. Hepatology. 2005;41(6):1313–1321. doi: 10.1002/hep.20701. [DOI] [PubMed] [Google Scholar]
- 13.Bruce CR, et al. Overexpression of carnitine palmitoyltransferase-1 in skeletal muscle is sufficient to enhance fatty acid oxidation and improve high-fat diet-induced insulin resistance. Diabetes. 2009;58(3):550–558. doi: 10.2337/db08-1078. [DOI] [PMC free article] [PubMed] [Google Scholar]
- 14.Foster DW. Malonyl-CoA: The regulator of fatty acid synthesis and oxidation. J Clin Invest. 2012;122(6):1958–1959. doi: 10.1172/JCI63967. [DOI] [PMC free article] [PubMed] [Google Scholar]
- 15.Longuet C, et al. The glucagon receptor is required for the adaptive metabolic response to fasting. Cell Metab. 2008;8(5):359–371. doi: 10.1016/j.cmet.2008.09.008. [DOI] [PMC free article] [PubMed] [Google Scholar]
- 16.Li Y, et al. AMPK phosphorylates and inhibits SREBP activity to attenuate hepatic steatosis and atherosclerosis in diet-induced insulin-resistant mice. Cell Metab. 2011;13(4):376–388. doi: 10.1016/j.cmet.2011.03.009. [DOI] [PMC free article] [PubMed] [Google Scholar]
- 17.Shaw RJ, et al. The kinase LKB1 mediates glucose homeostasis in liver and therapeutic effects of metformin. Science. 2005;310(5754):1642–1646. doi: 10.1126/science.1120781. [DOI] [PMC free article] [PubMed] [Google Scholar]
- 18.Abu-Elheiga L, Matzuk MM, Abo-Hashema KA, Wakil SJ. Continuous fatty acid oxidation and reduced fat storage in mice lacking acetyl-CoA carboxylase 2. Science. 2001;291(5513):2613–2616. doi: 10.1126/science.1056843. [DOI] [PubMed] [Google Scholar]
- 19.Kalhan SC, et al. Plasma metabolomic profile in nonalcoholic fatty liver disease. Metabolism. 2011;60(3):404–413. doi: 10.1016/j.metabol.2010.03.006. [DOI] [PMC free article] [PubMed] [Google Scholar]
- 20.Hailfinger S, Jaworski M, Braeuning A, Buchmann A, Schwarz M. Zonal gene expression in murine liver: Lessons from tumors. Hepatology. 2006;43(3):407–414. doi: 10.1002/hep.21082. [DOI] [PubMed] [Google Scholar]
- 21.Katz NR. Metabolic heterogeneity of hepatocytes across the liver acinus. J Nutr. 1992;122(3) Suppl:843–849. doi: 10.1093/jn/122.suppl_3.843. [DOI] [PubMed] [Google Scholar]
- 22.Williams JN, Jr, Anderson CE. Effect of thiamine deficiency and thiamine injection on total liver lipids, phospholipid, plasmalogen and cholesterol in the rat. J Nutr. 1959;69:229–234. doi: 10.1093/jn/69.3.229. [DOI] [PubMed] [Google Scholar]
- 23.Klein M, Weksler N, Gurman GM. Fatal metabolic acidosis caused by thiamine deficiency. J Emerg Med. 2004;26(3):301–303. doi: 10.1016/j.jemermed.2003.11.014. [DOI] [PubMed] [Google Scholar]
- 24.Lonsdale D. A review of the biochemistry, metabolism and clinical benefits of thiamin(e) and its derivatives. Evid Based Complement Alternat Med. 2006;3(1):49–59. doi: 10.1093/ecam/nek009. [DOI] [PMC free article] [PubMed] [Google Scholar]
- 25.Valette G, Ribes G, Loubatières-Mariani MM, Loubatières AL. [Consequences of the chronic administration of phenformine on the blood thiamine level in the dog] C R Seances Soc Biol Fil. 1975;169(6):1562–1567. [PubMed] [Google Scholar]
- 26.Bettendorff L, Wins P. Mechanism of thiamine transport in neuroblastoma cells. Inhibition of a high affinity carrier by sodium channel activators and dependence of thiamine uptake on membrane potential and intracellular ATP. J Biol Chem. 1994;269(20):14379–14385. [PubMed] [Google Scholar]
- 27.Bettendorff L, et al. Thiamine deficiency in cultured neuroblastoma cells: Effect on mitochondrial function and peripheral benzodiazepine receptors. J Neurochem. 1995;64(5):2013–2021. doi: 10.1046/j.1471-4159.1995.64052013.x. [DOI] [PubMed] [Google Scholar]
- 28.Subramanian VS, Subramanya SB, Said HM. Relative contribution of THTR-1 and THTR-2 in thiamin uptake by pancreatic acinar cells: Studies utilizing Slc19a2 and Slc19a3 knockout mouse models. Am J Physiol Gastrointest Liver Physiol. 2012;302(5):G572–G578. doi: 10.1152/ajpgi.00484.2011. [DOI] [PMC free article] [PubMed] [Google Scholar]
- 29.Lemos C, et al. Thiamine is a substrate of organic cation transporters in Caco-2 cells. Eur J Pharmacol. 2012;682(1–3):37–42. doi: 10.1016/j.ejphar.2012.02.028. [DOI] [PubMed] [Google Scholar]
- 30.Mommsen TP, Walsh PJ. Metabolic and enzymatic heterogeneity in the liver of the ureogenic teleost Opsanus beta. J Exp Biol. 1991;156:407–418. doi: 10.1242/jeb.156.1.407. [DOI] [PubMed] [Google Scholar]
- 31.Jungermann K, Katz N. Functional hepatocellular heterogeneity. Hepatology. 1982;2(3):385–395. doi: 10.1002/hep.1840020316. [DOI] [PubMed] [Google Scholar]
- 32.Lesurtel M, et al. Platelet-derived serotonin mediates liver regeneration. Science. 2006;312(5770):104–107. doi: 10.1126/science.1123842. [DOI] [PubMed] [Google Scholar]
- 33.Miller RA, Birnbaum MJ. An energetic tale of AMPK-independent effects of metformin. J Clin Invest. 2010;120(7):2267–2270. doi: 10.1172/JCI43661. [DOI] [PMC free article] [PubMed] [Google Scholar]
- 34.Cohen JC, Horton JD, Hobbs HH. Human fatty liver disease: Old questions and new insights. Science. 2011;332(6037):1519–1523. doi: 10.1126/science.1204265. [DOI] [PMC free article] [PubMed] [Google Scholar]
- 35.Lavine JE, et al. Nonalcoholic Steatohepatitis Clinical Research Network Effect of vitamin E or metformin for treatment of nonalcoholic fatty liver disease in children and adolescents: The TONIC randomized controlled trial. JAMA. 2011;305(16):1659–1668. doi: 10.1001/jama.2011.520. [DOI] [PMC free article] [PubMed] [Google Scholar]
- 36.Liu W, Baker SS, Baker RD, Nowak NJ, Zhu L. Upregulation of hemoglobin expression by oxidative stress in hepatocytes and its implication in nonalcoholic steatohepatitis. PLoS ONE. 2011;6(9):e24363. doi: 10.1371/journal.pone.0024363. [DOI] [PMC free article] [PubMed] [Google Scholar]
- 37.Teslovich TM, et al. Biological, clinical and population relevance of 95 loci for blood lipids. Nature. 2010;466(7307):707–713. doi: 10.1038/nature09270. [DOI] [PMC free article] [PubMed] [Google Scholar]
- 38.Suhre K, et al. CARDIoGRAM Human metabolic individuality in biomedical and pharmaceutical research. Nature. 2011;477(7362):54–60. doi: 10.1038/nature10354. [DOI] [PMC free article] [PubMed] [Google Scholar]
- 39.El-Mir MY, et al. Dimethylbiguanide inhibits cell respiration via an indirect effect targeted on the respiratory chain complex I. J Biol Chem. 2000;275(1):223–228. doi: 10.1074/jbc.275.1.223. [DOI] [PubMed] [Google Scholar]
- 40.Madiraju AK, et al. Metformin suppresses gluconeogenesis by inhibiting mitochondrial glycerophosphate dehydrogenase. Nature. 2014 doi: 10.1038/nature13270. [DOI] [PMC free article] [PubMed] [Google Scholar]
Associated Data
This section collects any data citations, data availability statements, or supplementary materials included in this article.