Significance
RNA molecules of higher eukaryotes can be thousands of nucleotides long and are expressed from two distinct alleles, which can differ by single nucleotide variations (SNVs) in the mature RNA molecule. The de facto standard in RNA biology is short (≤101 bp) read sequencing, which, although very useful, does not cover the entire molecule in a read. We show that using amplification-free long-read sequencing one can often (i) cover the entire molecule, (ii) determine the allele it originated from, and (iii) record its entire exon-intron structure within a single read, thus producing a full-length, allele-specific view of an individual’s transcriptome. By enhancing existing gene annotations using long reads and quantifying this enhanced annotation using >100 million 101-bp paired-end reads, we overcome the smaller number of long reads.
Keywords: personalized medicine, isoform sequencing, platform comparison, alternative splicing, allele-specific expression
Abstract
Personal transcriptomes in which all of an individual’s genetic variants (e.g., single nucleotide variants) and transcript isoforms (transcription start sites, splice sites, and polyA sites) are defined and quantified for full-length transcripts are expected to be important for understanding individual biology and disease, but have not been described previously. To obtain such transcriptomes, we sequenced the lymphoblastoid transcriptomes of three family members (GM12878 and the parents GM12891 and GM12892) by using a Pacific Biosciences long-read approach complemented with Illumina 101-bp sequencing and made the following observations. First, we found that reads representing all splice sites of a transcript are evident for most sufficiently expressed genes ≤3 kb and often for genes longer than that. Second, we added and quantified previously unidentified splicing isoforms to an existing annotation, thus creating the first personalized annotation to our knowledge. Third, we determined SNVs in a de novo manner and connected them to RNA haplotypes, including HLA haplotypes, thereby assigning single full-length RNA molecules to their transcribed allele, and demonstrated Mendelian inheritance of RNA molecules. Fourth, we show how RNA molecules can be linked to personal variants on a one-by-one basis, which allows us to assess differential allelic expression (DAE) and differential allelic isoforms (DAI) from the phased full-length isoform reads. The DAI method is largely independent of the distance between exon and SNV—in contrast to fragmentation-based methods. Overall, in addition to improving eukaryotic transcriptome annotation, these results describe, to our knowledge, the first large-scale and full-length personal transcriptome.
Short-read RNA sequencing (1–7) is a widely used tool in modern day biology. In mammalian transcriptomes, multiintron genes are common and the detection and quantification of different transcript isoforms is of high importance. Recent work has shown that reconstruction and quantification of transcript isoforms from short-read sequencing is insufficiently accurate (8, 9). Simultaneously, a number of research groups have pursued long-read sequencing (8, 10–12), and such datasets generally excel at connecting different exons, up to entire transcripts, with a compromise of lower sequencing depth. However, these studies have not investigated allelic variants. Such information is crucial for understanding personal transcriptomes and their potential biological consequences.
Here, we use the Pacific Biosciences (13) platform (“PacBio”) to produce a single-molecule RNA-seq dataset in the GM12878 cell line that is more comprehensive in both length and depth than a recently described dataset from a human organ panel (HOP) (11). We additionally sequenced cDNA from the same cell line by using 101-bp paired-end (PE) sequencing on the Illumina platform, to show the properties of genes that can be sequenced by using long-read, single-molecule transcriptome sequencing. We use previously unidentified isoforms revealed by long-read sequencing to produce an enhanced and personalized genome annotation, which we quantify by using 101-bp PE Illumina reads. Finally, by producing single-molecule transcriptomes for both parents of GM12878 (GM12891 and GM12892), we show that despite the higher error rate of the PacBio platform, single molecules can be attributed to the alleles from which they were transcribed, thereby generating accurate personal transcriptomes. This technique allows the assessment of biased allelic expression and isoform expression.
Results
Increased Full-Length Representation of RNA Molecules by Circular Consensus Reads.
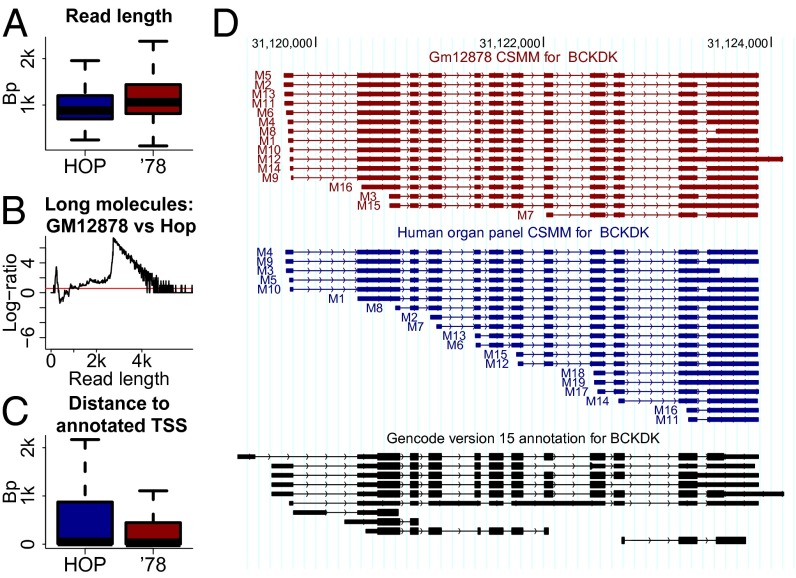
We sequenced ∼711,000 circular consensus reads (CCS) molecules from unamplified, polyA-selected RNA from the GM12878 cell line (see Fig. S1 for mapping statistics). We have recently shown that CCS often describe all splice sites of typical RNA molecules, although the success rate declines as RNA length increases (11). The CCS we sequenced here were significantly longer (average 1,188 bp, maximum 6 kb) than those in the HOP sample (average 999.9 bp; Fig. 1A). Both datasets showed equal representation of RNA molecules between 0.8 and 1.3 kb, but beginning at 1.3 kb and even more pronounced after 1.7 kb, the GM12878 sample represented longer RNA molecules more faithfully; RNA molecules of 2.7–4 kb were present in the GM12878 sample, but are essentially absent in the HOP sample (Fig. 1B). The distance from the 5′-mapping end to the nearest annotated transcription start site (TSS) dropped significantly (one-sided Wilcoxon rank sum test; P < 2.2e−16) in GM12878 (median: 30 bp) in comparison with HOP (median 47 bp; Fig. 1C). This observation suggests that the difference between the annotated transcript and the PacBio read is mostly confined to the first exon. For the branched-chain ketoacid dehydrogenase kinase (BCKDK) gene, only 4 of 19 CCS clearly represented all splice sites in the HOP-sample. In GM12878, however, 12 of 16 CCS reads clearly represent all 22 splice sites of the RNA molecule (Fig. 1D), and molecules M16, M3, and M15 may also represent full-length isoforms, because their first exonic blocks overlap an annotated first exon.
Fig. 1.
Increased length of CCS for the GM12878 sample. (A) Length distribution of CCS reads in the human organ panel (Hop; blue) (11) and CCS sequenced here for the GM12878 cell line (red). (B) Relative representation of molecules in length bins in the two samples. y axis is calculated as log [(number of GM12878-CCS in bin + 1)/(number of Hop-CCS in bin +1)]. The red horizontal line gives the expected ratio, which is above 0, because of the increased sequencing depth in GM12878. (C) Distribution of distances for CSMMs between the 5′ end of the mapping and the closest annotated TSS of the same gene for both the Hop (blue) and the GM12878 (red) sample. (D) All CSMMs mapped to the BCKDK gene in the GM12878 cell line (red) and in the Hop sample (blue) as well as all Gencode15-annoated transcripts for this gene (black).
Gene Coverage of Long Reads as a Function of Gene Expression as Defined by 101-bp PE Sequencing.
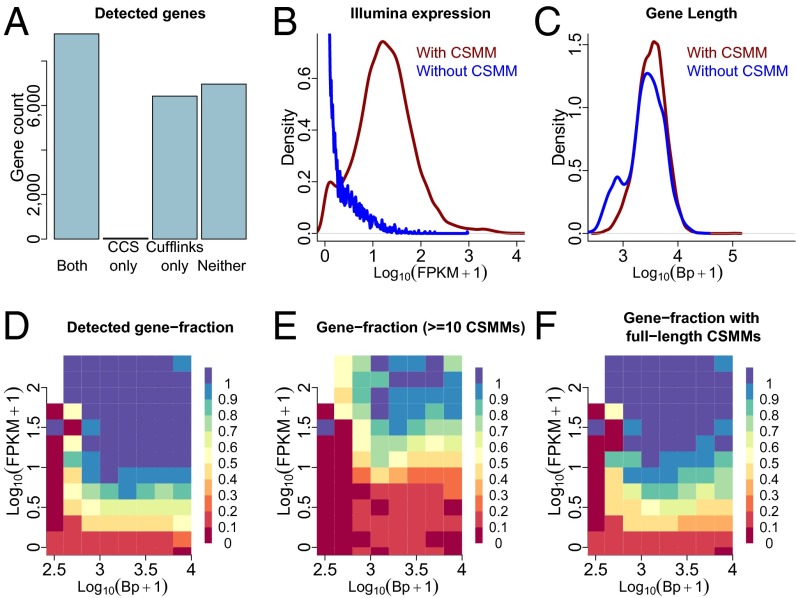
To compare gene detection of long-read sequencing to that of Illumina sequencing, we sequenced 100 million 101-bp PE reads on the Illumina platform. A highly controlled comparison of sequence quality between Illumina and PacBio reads can be found in Fig. S2. Illumina reads were aligned to the hg19 reference genome (and the Gencode15 annotation; ref. 14) by using STAR (15). Gencode genes and transcripts were then quantified by using Cufflinks (16) (version 2.1.1; SI Methods). Approximately 99,000 annotated exon-exon junctions were detected by both technologies, and each junction detected by PacBio was covered 40 times as often (median value) by Illumina reads. Illumina reads covered an additional ∼92,000 annotated junctions, and PacBio reads an additional 992. We then focused our analysis on ∼22,600 spliced genes that have been classified either as protein coding or lincRNA in the Gencode annotation. About 9,200 of these genes were detected by long-read single-molecule sequencing with at least one molecule, for which all introns respect the splice site consensus (“consensus split-mapped molecule”; CSMM) and by 101-bp PE sequencing with a nonzero Cufflinks fragments per kilobase of transcript per million mapped reads (FPKM). Forty genes were exclusively identified by long reads, ∼6,400 genes only by the 101-bp PE Cufflinks approach and ∼7,000 genes by neither approach (Fig. 2A). Genes without a long read-derived CSMM showed considerably lower Cufflinks-derived gene FPKMs than those that had a CSMM (Fig. 2B), showing that deeper sequencing of shorter reads detects more lowly expressed RNAs. Because CCS generation requires read length to exceed cDNA length by at least a factor of two, we hypothesized that CSMMs would not represent longer genes. Surprisingly, when calculating the number of base pairs of the longest mature and annotated transcript for each gene, we found this hypothesis to be wrong. Genes with and without a CSMM behaved largely similarly in terms of length. However, genes with a CSMM only very rarely represented genes smaller than 1 kb (Fig. 2C), which is likely due to the use of magnetic beads in the loading procedure, which disfavor short fragments. To derive an approximate predictive statement from the above observations, we calculated the fraction of genes that had at least one CSMM, for bins of gene lengths and 101-bp PE Cufflinks-derived expression. At FPKMs >10 and gene lengths ≥ 1kb, 98% of genes receive a PacBio-CSMM when sequencing ∼711,000 CCS (Fig. 2D), whereas with an FPKM of >1, this percentage drops to 89%. When requiring at least 10 CSMMs (at FPKMs > 10), which may be useful for quantitative analyses, this fraction drops further to 68% (Fig. 2E). For genome-annotation purposes, CSMMs representing all introns of an RNA molecule are useful. Sixty-three percent of CSMMs appear complete in that their first splice site is an annotated first splice site and that their last splice site is an annotated last splice site. By relaxing this criterion (SI Methods), ultimately 71% of CSMMs were classified as “full length.” For a gene to receive a full-length CSMM, we find both expression and mature gene length to be important factors. Genes of 1 kb or longer and expressed at FPKMs ≥10 show a full-length CSMM in 94% of the cases, whereas those that have at least one annotated mature (that is excluding introns) transcript longer than 4 kb do so only in 33% of the cases (Fig. 2F). Note that full-length molecules may not always represent the longest isoform of a gene.
Fig. 2.
Comparison of short- and long-read sequencing for gene identification. (A) Bar chart depicting the number of genes identified by PacBio-CCS and by Cufflinks, the number of genes only identified by the former, the number of genes only identified by the latter, and the number of genes identified by neither approach. (B) Cufflinks-derived gene expression distribution for genes that show at least one CSMM and for those that do not have a single CSMM. (C) Mature gene length distribution for genes that show at least one CSMM and for those that do not have a single CSMM. (D) Fraction of genes that show at least one CSMM in bins according to gene length and Cufflinks-derived gene expression. (E) Fraction of genes that show at least 10 CSMM in the same bins as in D. (F) Fraction of genes that show at least one full-length CSMM in the same bins as in (D). Note that a full-length CSMM does not necessarily correspond to the longest annotated isoform of the gene.
A Personalized and Long-Read Enhanced Gencode Annotation.
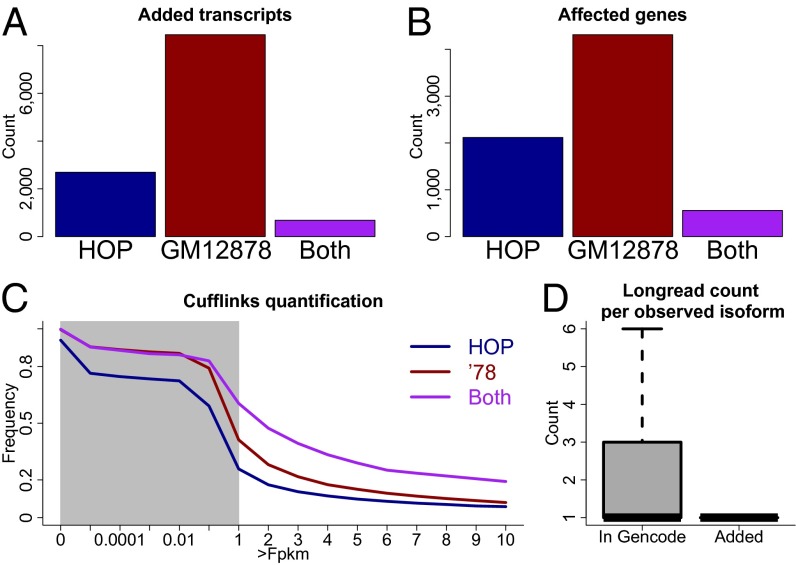
Because PacBio-CCS reads may describe novel exon-intron structures, we determined RNA molecules representing previously unidentified isoforms as described (8). We estimated that 2% of all alignments (corresponding to 1 of 7 of the novel alignments) might represent mapping artifacts (11) and a similar number has been suggested to represent biological noise (17). To reduce the number of these unwanted isoforms, we isolated ∼12,000 full-length novel isoforms, which could be attributed to a known gene and for which each exon-exon junction was annotated and/or supported by short-read sequencing (SI Methods) and added them to the Gencode (version 15) annotation. Fifty-five percent of the corresponding novel RNA molecules exhibited novel combinations (8) of known splice sites (including skipping of annotated constitutive exons and retention of known introns). Thirty-four percent showed a single novel donor or acceptor and 11% had two or more novel splice sites (including novel internal exons). Approximately 2,700 such isoforms were only observed in the HOP sample, 8,500 only in the GM12878 sample and 684 in both (Fig. 3A). These isoforms affected a total of ∼5,500 genes, most (93%) of which are annotated as protein coding, although “lincRNA,” “antisense,” “processed transcript,” and “pseudogene” genes could also be observed. At gene level, ∼2,100, 4,300, and 600 genes showed a novel isoform observed in the Hop-sample only, the GM12878-sample only, and both samples, respectively (Fig. 3B). We then used Cufflinks to quantify this enhanced annotation by using the GM12878-Illumina-101-bp PE data. In addition to the many easily interpretable FPKMs, Cufflinks also provides very small FPKM values (e.g., between 0 and 10−5). We therefore monitored the fraction of novel isoforms at different FPKM thresholds. At thresholds 0.1 and above, novel isoforms that were observed in both the HOP and GM12878 long-read samples were most likely to pass the FPKM cutoff derived from GM12878 101-bp PE sequencing. At all FPKM-cutoffs, a higher fraction of novel isoforms specific to the GM12878 long-read data were observed than those specific in the HOP long-read data. Thus, novel isoforms originating from the same sample as the Illumina reads are more easily quantified than novel isoforms from other samples, supporting the biological relevance of these novel isoforms (Fig. 3C). This result remains true when we do not require all introns of added isoforms to be annotated or supported by Illumina sequencing (Fig. S3). Isoforms added to the annotation were on average observed 1.5 times in the PacBio data, whereas isoforms that correspond to entire or truncated annotated isoforms appeared on average 4.3 times. This observation is consistent with the notion that many added isoforms have escaped annotation thus far, because they are lowly expressed.
Fig. 3.
Construction and quantification of an enhanced annotation. (A) Bar plot of novel isoforms that originated from the Hop sample only, the GM12878 sample only, and those from both samples. (B) Bar plot of gene numbers that have at least one isoform originating from the Hop sample only, the GM12878 sample only, and from both samples. (C) Fraction of novel isoforms in the above three classes that are detected with different FPKM cutoffs. The gray area indicates the region where the x axis is logarithmic. To the right of the gray area the x axis is linear. (D) Boxplot for the number of PacBio molecules supporting alignments that correspond to entire or partial Gencode transcripts (as judged from their splice sites; Left) and the number of PacBio molecules supporting novel alignments (Right).
Joining Distant Single Nucleotide Variations into an RNA Haplotype.
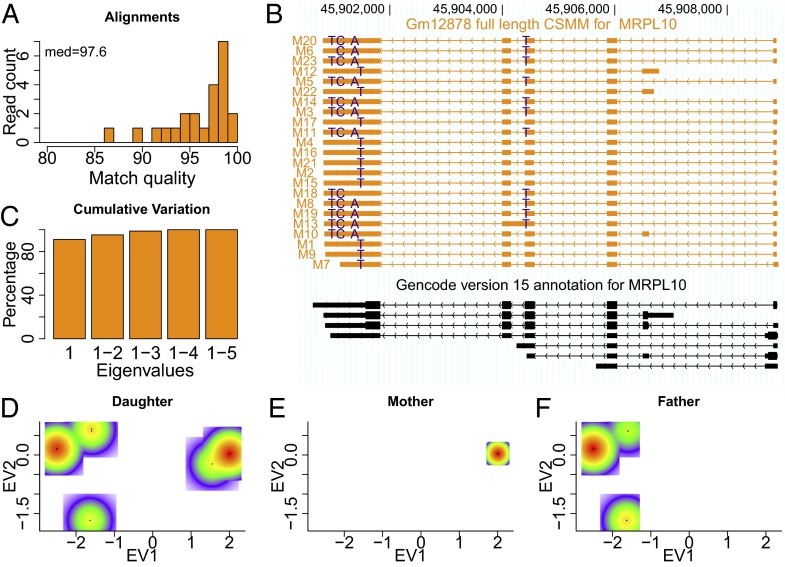
An important goal in transcriptomics is to assign RNA molecules to the allele from which they were expressed. For genes having only one single nucleotide variation (SNV), the allele assignment is a trivial binary decision for long-read data. However, genes can harbor multiple SNVs, which may be located at a distance that is not detectable by using short RNA fragments. In principle, through long-read sequencing, we can determine each SNV affecting each single RNA molecule. For example, for the mitochondrial ribosomal protein L10 (MRPL10) gene, we identified a total of five SNVs (Methods) when using an equal number (∼574,000 reads) of reads for each GM12878, GM12891, and GM12892. Formulating the allele assignment problem in a principal component analysis (PCA) framework, we determined mismatches of CCS from the hg19 reference—a noisy process due to the relatively high error rate of single-molecule sequencing. For the MRPL10 gene, we found ∼2.4 mismatches per 100 bp of alignment (Fig. 4A). To determine heterozygous SNVs, we retained all single nucleotide substitutions, when they appeared in at least 15% and at most 85% of the CCS overlapping the position in question—a de novo method completely independent of previous SNV annotations. Mismatches overlapped by few reads and reads overlapping few mismatches were removed from the analysis (Methods). Note, that some SNV calls are lost (a missing “T” in molecule M6, a missing “A” in molecule M18, and a missing “T” on an internal exon in molecule M10; Fig. 4B). Furthermore, molecule M7 does not overlap the most downstream SNV. Absence or presence of SNVs in reads was encoded in a read by mismatch matrix. After normalization of the matrix, we computed all pairwise correlations between SNVs and determined the correlation-matrix’s eigenvectors (or principal components). Assuming exactly two alleles and a sequencing technique free of errors, the first eigenvector (or first principal component; PC1) should explain all of the variation in this dataset, so that the ratio of the first eigenvalue to the sum of all eigenvalues should be equal to 1. Despite the SNV miscalls introduced into the read by mismatch matrix by the PacBio error rate (and a read that did not overlap all SNVs), the first principal component explains ∼91% of the variation for this gene (Fig. 4C). Thus, we can attribute single CCS reads to an allele, despite the error rate. To trace the origin of both alleles through the family trio, we added PacBio reads sequenced for the parents (GM12891 and GM12892) to the ones for the daughter (GM12878) and monitored the parent reads for the absence or presence of the daughter-derived SNVs. Repeating the PCA on the combined data and plotting only the data from GM12878 in the eigenvector 1/eigenvector 2 space revealed the two alleles (represented by two points of enrichment) and a few scattered points (representing sequencing errors on an SNV; Fig. 4D). Separate plotting of the data from mother and father showed that only one allele is detected in the mother (red enriched area to the right in Fig. 4 D and E), with the other allele identified in the father (Fig. 4F). Note, that the base-pair substitutions considered here occur in at least two molecules. When dropping this criterion, this approach finds an additional 82 SNVs, which appear to be false positives, because in contrast to the above 5 SNVs, they do not correspond to annotated SNVs (SI Methods). For much larger numbers of reads (such as from the targeted PCR product of a gene giving >100,000 reads), this cutoff might have to be revised.
Fig. 4.
Phasing of a single gene. (A) Histogram of alignment qualities for all CSMMs to MRPL10 gene. (B) Alignments of CSMMs to the MRPL10 gene with heterozygous mismatches that differ from hg19 highlighted. (C) Bar chart of all cumulative eigenvalues. (D) Scatterplot of reads in the space defined by eigenvector 1 and eigenvector 2 for reads from the GM12878 cell line. Color scale from white (absence of reads) to red (strong enrichment of reads). (E) Same plot as in D but for reads from the cell line GM12892. (F) Same plot as in D but for reads from the cell line GM12891.
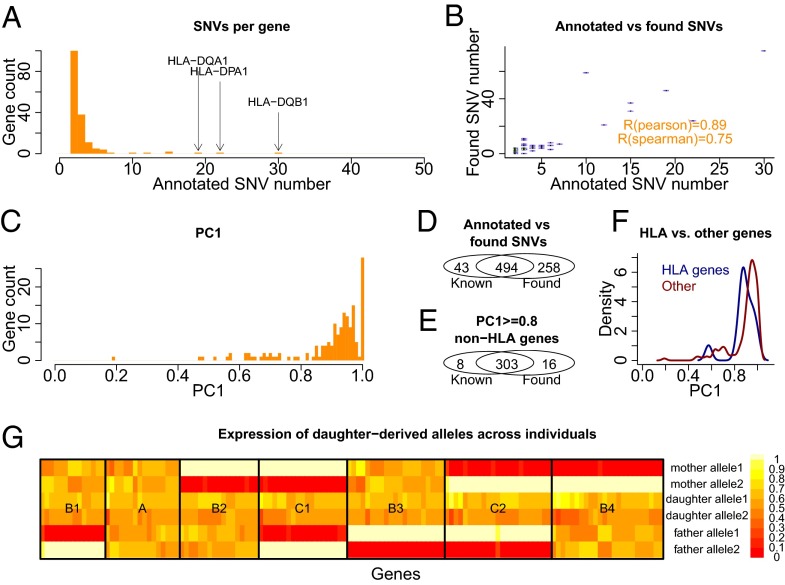
Subsequently, we considered 166 genes for which at least 2 annotated heterozygous SNVs were covered by a large number (80%) of full-length reads for each gene (SI Methods). The majority of these genes had exactly two such SNVs, but genes with three or four SNVs were also observed. Large SNV numbers (∼20 or more) were observed for a few HLA genes (Fig. 5A). Application of our SNV search method revealed heterozygous SNVs for most (96%) of these 166 genes. The number of SNVs found per gene correlated strongly with the annotated SNV number (Pearson R of 0.89 and Spearman correlation of 0.75), showing that our method detects more heterozygous polymorphisms in regions that are known to be polymorphic (Fig. 5B). For 6 genes of the 166, no heterozygous mismatches were found; we speculate that one allele may be very lowly or not at all expressed. For 2 genes, we found exactly 1 SNV, and for 158 genes, two or more. Clear enrichment was observed for PC1 contributions between 0.8 and 1, showing that usually two alleles can be assigned, although 26 genes showed weaker first principal components (Fig. 5C). Overall 66% of all found SNVs were annotated in the reference genome and 92% of all known SNVs for the considered genes were found (Fig. 5D). Considering only non-HLA genes with good phasing (PC1 ≥ 0.8), these two numbers changed to 95% and 97%, respectively (Fig. 5E). The missing ∼3% of known SNVs may not have passed one of the cutoffs used here, so that our analysis does not disprove their existence. With the exception of HLA-DRB1, even HLA genes, whose sequence may differ substantially from the hg19 reference, showed good phasing similar to non-HLA genes (Fig. 5F). Interestingly, despite the fact that we only considered genes for which both alleles of the heterozygous SNVs can be clearly seen in the RNA, four genes showed differential allelic expression (DAE; two-sided binomial test, FDR = 0.05).
Fig. 5.
Phasing statistics for genes with multiple annotated heterozygous SNVs. (A) Histogram of annotated heterozygous SNV number for all considered genes. (B) Scatterplot of annotated heterozygous SNV number and found heterozygous SNV number for these genes. (C) Histogram of the ratio of the first eigenvalue and the sum of all eigenvalues (PC1). (D) Overlap between found and annotated SNVs for all considered genes. (E) Same plot as in D but excluding HLA genes and genes with a first principal component weaker than 0.8. (F) Distribution of PC1 contributions for non-HLA genes and HLA genes. (G) Map of relative expression ratios of the daughter-derived alleles I and II in mother, father, and daughter cell lines. Each row gives an allele in one of the individuals and each column gives a gene. Black boxes indicate different classes of genes according to expression patterns of allele I and II in the parents.
We then assigned each CCS from the parental cell lines (GM12891 and GM12892) to one of the two daughter-derived alleles I and II or to another “unassigned allele.” Excluding CCS assigned to the “unassigned allele” class, we monitored for each gene the relative frequency of alleles I and II in both parents. For each gene, each parent can take four states—“expresses I only,” “expresses II only,” “expresses I and II,” and “expresses none”—and the combination of both parents can therefore take 4 × 4 = 16 states. Because each allele must come from one of the parents, only seven states should be observed: genes in which both alleles are expressed in all three individuals (Fig. 5G, class “A”), all four logically possible states, in which one parent expresses only one of the alleles and the other parent expresses both (Fig. 5G, class “B1–B4”), and both logically possible states in which one parent expresses only one allele and the other parent only the other allele (Fig. 5G, class “C1” and “C2”). These seven classes are exactly the ones we observe (Fig. 5G), and a P value can be calculated by using the binomial coefficient as .
Thus, long-read sequencing of unfragmented RNA can reveal the entire transcript structure and all SNVs in each single RNA molecule. A proof of principle showing differential exon inclusion between the two alleles (pooled from GM12878, GM12891, and GM12892, a technique to be avoided if sufficient read depth is available) is the Fc receptor-like A (FCRLA) gene, for which an alternative exon on allele 1 is included in 2% of the molecules but in 21% of the molecules on allele 2 (P < 0.01, two-sided Fisher test with Bonferroni correction for all internal exons of the phased genes; Fig. 6A, see also ref. 8). To validate this event of differential allelic isoform use (DAI), we amplified cDNA molecules that include exon 2 and separately cDNA molecules that skip exon 2. Sanger sequencing of both amplicons confirmed that exon 2-inclusion amplicons show the SNV pattern of allele 2, whereas exon 2-exclusion amplicons show a mixture of the SNV patterns of both alleles, thus confirming our long-read analysis (Fig. 6B).
Fig. 6.
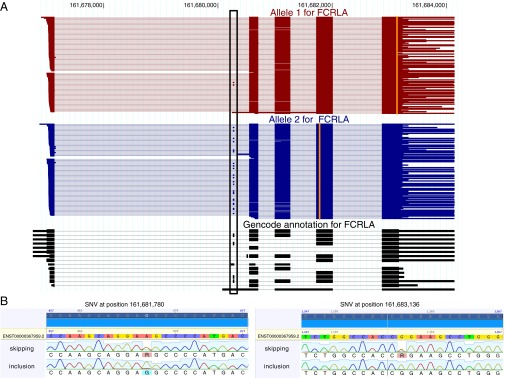
Differential allelic isoform use for the FCRLA gene. (A) From the previously defined alleles 1 and 2 for this gene, we deduced all full-length reads in all three cell lines (GM12878, GM12891, and GM12892) that could be attributed to these alleles. Reads for allele 1 (red), allele 2 (blue), and the annotation (black) are plotted in transcription direction. A black box highlights an alternatively included exon. Vertical orange lines indicate genomic positions at which reads differ from the reference genome through a heterozygous SNV. (B) Sanger sequencing traces for the two SNVs, which are located at genomic positions 161681780 (Left, position 867 in the Sanger trace) and 161683136 (Right, position 1357 in the Sanger trace) on chromosome 1, separated by RNA molecules skipping exon 2 (Upper, as given by a PCR from a primer spanning the exon 1-exon 3 junction, “skipping”) and including exon 2 (Lower, as given by a PCR from a primer spanning the exon 1-exon 2 junction, “inclusion”). The nucleotide descriptor “R” stands for a purine residue (A or G).
Discussion
Short-read RNA sequencing has become the de facto standard in transcriptome analysis, so that currently, sequencing 100 million 101-bp PE reads has become common. Because of the complexity of higher-eukaryotic transcriptomes, short-read approaches suffer when it comes to precise reconstruction of transcript structures. Here, we generate the deepest and longest single-molecule long-read dataset to date, to our knwoeldge, for a trio of human cell lines (GM12878, GM12891, and GM12892). Illumina-RNAseq data for GM12878 analyzed by Cufflinks showed that the single-molecule approach sequences one or more spliced reads for 59% of the expressed spliced genes. For highly expressed genes with mature RNA lengths of 1 kb and longer, obtaining a long read is almost certain (98%), but for lowly expressed genes, this is much less likely. Notably, for obtaining a spliced PacBio read for a gene, gene length (apart from genes <<1 kb) appears not to be a major factor, because shorter isoforms or truncated molecules yield CCS. Obtaining full-length molecules, however, is increasingly difficult for longer genes.
One may also use long reads to complement an existing annotation or create an annotation and then use short reads to quantify that annotation. This approach is supported by the observation that GM12878-derived PacBio isoforms receive high Cufflinks FPKMs in a GM12878 Illumina sample more often than PacBio isoforms derived from a different sample.
PacBio reads exhibit a higher error rate than Illumina sequencing (18). Using CCS reads greatly alleviates this problem, although not to the same extent as methods of hybrid error correction (10, 12). In contrast to the latter, CCS have the advantage that all of the information leading to the sequence of a read originates from a single RNA molecule, which is a significant step toward connecting multiple variables along the RNA molecule, such as SNVs, RNA editing and splice sites, TSSes, and polyA sites. Here, we show that we can determine SNVs de novo and that using a PCA approach, molecules from genes with multiple heterozygous SNVs can be attributed to the two alleles. Even for complicated genes (e.g., HLA genes, whose sequences may differ considerably from the reference sequence) the two alleles are usually clearly distinguishable. Deeper sequencing is needed, however, to determine with statistical significance if one allele behaves differently from another for many genes.
In summary, we show advantages and disadvantages of single-molecule sequencing and provide guidelines so that researchers can assess whether it can be of use for their research. Furthermore, we show how an allele-specific full-length transcriptome can be described, which will be increasingly useful for basic research and personalized medicine as sequencing depth increases.
Methods
Definition of Heterozygous Mismatches and PCA.
For a given gene, we considered all CSMMs mapped to the gene. We remapped all full-length CSMMs against the genomic region of the gene, discarding all that showed differences to the first mapping and recorded all mismatches from hg19. Mismatches that occurred in only one read, and insertions and deletions (which are more common in PacBio CCS), were discarded. For the remaining mismatches, a read by mismatch matrix was constructed, in which “1” denotes the presence of a mismatch, “−1” the absence of a mismatch (which may include cases in which the mismatch existed but was hit by one of the relatively frequent insertions or deletions). When a read did not overlap a mismatch (because of an alternative isoform or only partial representation of a UTR) and, therefore, could not inform about the status of the mismatch, we encoded it as a “0.” Based on this matrix, we retained clearly heterozygous positions, for which most reads were informative at the position, meaning we removed mismatches that (i) were covered by less than 80% of the CCS, (ii) affected less than 15% of the reads that covered them, or (iii) affected more than 85% of the reads that covered them. Each column (representing the values for one mismatch in all reads) was normalized. We then computed the correlation matrix, its eigenvectors, and corresponding eigenvalues and rotated the normalized matrix into the space defined by the eigenvectors. Statistical analysis was carried out by using R (19).
Supplementary Material
Acknowledgments
We thank Nicole Rapicavoli and Nick Seniseros at Pacific Biosciences for help with data production and thank Carlos Araya, Morten Rasmussen, and Suyash Shringarpure for valuable comments on the manuscript.
Footnotes
Conflict of interest statement: M.P.S. is on the scientific advisory board of Personalis and GenapSys.
This article is a PNAS Direct Submission.
Data deposition: The sequences reported in this paper have been deposited in the NCBI Sequence Read Archive (accession no. SRP036136). Further data are available at http://stanford.edu/~htilgner/2014_PNAS_paper/utahTrio.index.html.
This article contains supporting information online at www.pnas.org/lookup/suppl/doi:10.1073/pnas.1400447111/-/DCSupplemental.
References
- 1.Nagalakshmi U, et al. The transcriptional landscape of the yeast genome defined by RNA sequencing. Science. 2008;320(5881):1344–1349. doi: 10.1126/science.1158441. [DOI] [PMC free article] [PubMed] [Google Scholar]
- 2.Wang ET, et al. Alternative isoform regulation in human tissue transcriptomes. Nature. 2008;456(7221):470–476. doi: 10.1038/nature07509. [DOI] [PMC free article] [PubMed] [Google Scholar]
- 3.Sultan M, et al. A global view of gene activity and alternative splicing by deep sequencing of the human transcriptome. Science. 2008;321(5891):956–960. doi: 10.1126/science.1160342. [DOI] [PubMed] [Google Scholar]
- 4.Mortazavi A, Williams BA, McCue K, Schaeffer L, Wold B. Mapping and quantifying mammalian transcriptomes by RNA-Seq. Nat Methods. 2008;5(7):621–628. doi: 10.1038/nmeth.1226. [DOI] [PubMed] [Google Scholar]
- 5.Wilhelm BT, et al. Dynamic repertoire of a eukaryotic transcriptome surveyed at single-nucleotide resolution. Nature. 2008;453(7199):1239–1243. doi: 10.1038/nature07002. [DOI] [PubMed] [Google Scholar]
- 6.Djebali S, et al. Landscape of transcription in human cells. Nature. 2012;489(7414):101–108. doi: 10.1038/nature11233. [DOI] [PMC free article] [PubMed] [Google Scholar]
- 7.Wang Z, Gerstein M, Snyder M. RNA-Seq: A revolutionary tool for transcriptomics. Nat Rev Genet. 2009;10(1):57–63. doi: 10.1038/nrg2484. [DOI] [PMC free article] [PubMed] [Google Scholar]
- 8.Tilgner H, et al. Accurate identification and analysis of human mRNA isoforms using deep long read sequencing. G3 (Bethesda) 2013;3(3):387–397. doi: 10.1534/g3.112.004812. [DOI] [PMC free article] [PubMed] [Google Scholar]
- 9.Steijger T, et al. RGASP Consortium Assessment of transcript reconstruction methods for RNA-seq. Nat Methods. 2013;10(12):1177–1184. doi: 10.1038/nmeth.2714. [DOI] [PMC free article] [PubMed] [Google Scholar]
- 10.Koren S, et al. Adam M Phillippy Hybrid error correction and de novo assembly of single-molecule sequencing reads. Nat Biotechnol. 2012;30(7):693–700. doi: 10.1038/nbt.2280. [DOI] [PMC free article] [PubMed] [Google Scholar]
- 11.Sharon D, Tilgner H, Grubert F, Snyder M. A single-molecule long-read survey of the human transcriptome. Nat Biotechnol. 2013;31(11):1009–1014. doi: 10.1038/nbt.2705. [DOI] [PMC free article] [PubMed] [Google Scholar]
- 12.Au KF, et al. Characterization of the human ESC transcriptome by hybrid sequencing. Proc Natl Acad Sci USA. 2013;110(50):E4821–E4830. doi: 10.1073/pnas.1320101110. [DOI] [PMC free article] [PubMed] [Google Scholar]
- 13.Eid J, et al. Real-time DNA sequencing from single polymerase molecules. Science. 2009;323(5910):133–138. doi: 10.1126/science.1162986. [DOI] [PubMed] [Google Scholar]
- 14.Harrow J, et al. GENCODE: The reference human genome annotation for The ENCODE Project. Genome Res. 2012;22(9):1760–1774. doi: 10.1101/gr.135350.111. [DOI] [PMC free article] [PubMed] [Google Scholar]
- 15.Dobin A, et al. STAR: Ultrafast universal RNA-seq aligner. Bioinformatics. 2013;29(1):15–21. doi: 10.1093/bioinformatics/bts635. [DOI] [PMC free article] [PubMed] [Google Scholar]
- 16.Trapnell C, et al. Transcript assembly and quantification by RNA-Seq reveals unannotated transcripts and isoform switching during cell differentiation. Nat Biotechnol. 2010;28(5):511–515. doi: 10.1038/nbt.1621. [DOI] [PMC free article] [PubMed] [Google Scholar]
- 17.Pickrell JK, Pai AA, Gilad Y, Pritchard JK. Noisy splicing drives mRNA isoform diversity in human cells. PLoS Genet. 2010;6(12):e1001236. doi: 10.1371/journal.pgen.1001236. [DOI] [PMC free article] [PubMed] [Google Scholar]
- 18.Quail MA, et al. A tale of three next generation sequencing platforms: Comparison of Ion Torrent, Pacific Biosciences and Illumina MiSeq sequencers. BMC Genomics. 2012;13:341. doi: 10.1186/1471-2164-13-341. [DOI] [PMC free article] [PubMed] [Google Scholar]
- 19. R-Core-Team (2012) R: A Language and Environment for Statistical Computing.
Associated Data
This section collects any data citations, data availability statements, or supplementary materials included in this article.


