

Significance
Understanding changes in phytoplankton cell abundance requires estimates of division rates. These rates are difficult to obtain at the necessary time scales (daily) for extended periods with conventional methods. We show that a matrix population model combined with observed hourly cell size distributions accurately estimates division rates of both cultured and natural populations of the picocyanobacteria Synechococcus. This approach opens the path for novel insight into population dynamics. Application of the model to an annual cycle of Synechococcus observations reveals dramatic seasonality of division rates linked to temperature and that division and loss processes are tightly coupled throughout the year. These results suggest that Synechococcus populations may be especially sensitive to the predicted changes in ocean temperature from global climate change.
Keywords: flow cytometry, phytoplankton blooms, FlowCytobot, cyanobacteria
Abstract
Phytoplankton account for roughly half of global primary production; it is vital that we understand the processes that control their abundance. A key process is cell division. We have, however, been unable to estimate division rate in natural populations at the appropriate timescale (hours to days) for extended periods of time (months to years). For phytoplankton, the diel change in cell size distribution is related to division rate, which offers an avenue to obtain estimates from in situ observations. We show that a matrix population model, fit to hourly cell size distributions, accurately estimates division rates of both cultured and natural populations of Synechococcus. Application of the model to Synechococcus at the Martha’s Vineyard Coastal Observatory provides an unprecedented view that reveals a distinct seasonality in division rates. This information allows us to separate the effects of growth and loss quantitatively over an entire seasonal cycle. We find that division and loss processes are tightly coupled throughout the year. The large seasonal changes in cell abundance are the result of periods of time (weeks to months) when there are small systematic differences that favor either net growth or loss. We also find that temperature plays a critical role in limiting division rate during the annual spring bloom. This approach opens a path to quantify the role of Synechococcus in ecological and biogeochemical processes in natural systems.
Marine phytoplankton contribute ∼50% of global net primary production (1), mediate global biogeochemical cycles, and form the base of marine food webs. It is vital that we understand the factors that govern their abundance, even more so in light of ongoing climate change. The key to this is an understanding of the rate at which phytoplankton cells divide under different environmental conditions.
Division rate cannot be measured from changes in cell abundance alone, as changes in abundance result from interactions between cell division and other processes such as predation, advection, sinking, and mixing. Further, we lack approaches that can resolve these processes on scales relevant to the cells’ responses to their environment. To overcome this, estimates of abundance and division rate are needed on time scales of hours to days and extending for weeks, months, and ultimately years. Although some progress has been made with automated sampling (2), a practical method for estimating division rates across this wide range of scales has remained elusive. Conventional methods require incubations (3, 4) or sample manipulation and handling (5–7), neither of which can be feasibly conducted at daily resolution for extended duration.
For the important class of picophytoplankton (≤2 μm in diameter), estimation of division rates has been attempted from in situ diel changes in cell size. During daylight, individual cells photosynthesize and increase in volume. The increase in cell volume during daylight hours provides a minimum estimate of the daily division rate (8). This approach has been used to study Synechococcus, Prochlorococcus, and picoeukaryotes in the open ocean (8–10). A major limitation of this approach is its implicit assumption that (at the population level) cell growth and division are separated in time. Although most cell division occurs around dusk (10, 11), these processes have been observed to occur simultaneously throughout the day in cultures of Synechococcus, especially when division rate is high (>0.7 d−1) (7, 11, 12). Under such conditions, this approach underestimates division rate. Sosik et al. (13) proposed an alternative method based on a matrix population model that represents changes in cell sizes and allows for simultaneous growth and division. This model can be fit to time series of cell size distributions and the fitted model provides an estimate of the daily division rate. A key advantage both approaches share is that they do not depend on cell concentration. This independence is especially important in dynamic coastal systems where complex interactions between physical and biological processes can produce patchy plankton distributions (14).
Although the approach of Sosik et al. (13) may be powerful, its efficacy and accuracy have never been evaluated. Here we provide, to our knowledge, the first direct test of the model-based approach. We show that, for both cultured and natural Synechococcus, the model-based approach is, on average, in excellent agreement with methods based on cell counting. We apply the approach to observations collected by an automated submersible flow cytometer [FlowCytobot (FCB)] (15) over an annual cycle at the Martha’s Vineyard Coastal Observatory (MVCO). Our analysis reveals, with unprecedented resolution, a distinct seasonality of division rates. It also establishes that division and loss processes are tightly coupled throughout the year. Despite this coupling, dramatic seasonal changes in cell abundance occur because small but systematic differences favor net growth (or loss) for extended periods (weeks to months).
Model
We estimate the division rate with a matrix population model based on that of Sosik et al. (13). In this section, we briefly describe the model and its fitting; details are available in SI Text and Table S1. We make two assumptions. First, within a single day, cell growth is determined by incident radiation, with temperature, nutrient availability, and other factors operating at longer time scales. Second, the odds of a cell dividing depend only on its size and are constant for cells within a discrete size class. With descriptions of how cell growth depends on light and cell division depends on size, the model predicts the cell size distributions over the course of a day.
We begin by dividing the cells into m size classes. The cells in class i have volumes between νi and νi+1, where the class boundaries are equally spaced on a logarithmic scale
| [1] |
νmin is the minimum cell volume, and Δν is the class width. Here we take νmin = 2 × 10⁻⁵ μm3, m = 57, and Δν = 0.125. Let n(t) be the m-by-1 vector whose elements, ni(t), are the number of cells in class i at time t. The population vector at time t + dt is given by
| [2] |
The element aij(t; θ) of the m-by-m projection matrix A(t; θ) is the number of cells in class i at time t + dt per cell in class j at time t. Each of these elements is a function of time and depends on parameters collected in θ. Given these parameters and an initial condition n(0), the model projects the population distribution throughout the day. The daily division rate is
| [3] |
where N(0) and N(24) are the total cell numbers from the model at the beginning and end of the day. As summarized in Fig. S1, the model allows a cell to undergo only one of two transitions in a single time step: division or growth. (Cells that neither divide nor grow survive in the same size class.) The time step dt should be sufficiently small such that this is a reasonable assumption; we set dt = 10 min.
Division.
We assume that a fraction δ(t, νj; θ) of the cells in size class j divide in half during one time step, and that the odds of dividing depend on cell size and time of day. In particular, we set
| [4] |
with b > 0. Cells do not divide before time t∗, an assumption that is supported by observations of natural and cultured Synechococcus (7, 11), including the culture used in this study. We take t∗ = 6 h. After t∗, the division probability δ is an increasing function of cell size. δmax is the maximum fraction of cells that divide and the parameter b determines the shape of δ (Fig. S2A).
Growth.
Of the cells that do not divide, a fraction γ(t; θ) grow into the next largest size class. This fraction is independent of cell size, but depends on incident radiation E(t). We assume that γ(t; θ) is a piecewise linear function of E(t) (Fig. S2B):
| [5] |
When E(t) ≥ E∗, the fraction of cells that grow into the next size class is γmax. Cells in the largest size class do not grow.
Subpopulations.
When the initial distribution is unimodal, the model preserves this feature over the course of the entire day. In the majority of our laboratory experiments, however, bimodal size distributions developed and then disappeared during the day (Fig. S3B). This phenomenon also occurs in natural assemblages at MVCO, although more subtly and less frequently. Bimodal size distributions in the laboratory experiments typically first appeared during the start of cell concentration increase and disappeared a few hours before cell concentration stopped increasing for the day. This timing and the magnitude of increase in volume apparent for larger cells (Fig. S3B) suggests that the underlying cause was early rounds of cell division (7) with a portion of these newly divided cells staying attached for much longer than typical in the field. Other possibilities include a portion of the culture that exhibited different cell size dynamics (such as growing much faster or having a different diel timing for cell division). This possibility can occur even in clonal culture, as phenotypic differences have been observed after spontaneous mutations over many generations (16, 17).
We can accommodate bimodal size distributions by including in our model two subpopulations, n1(t) and n2(t), each governed by its own projection matrix and parameters. The total number of cells at time t is given by N(t) = N1(t) + N2(t), where N1(t) and N2(t) are the totals for the two subpopulations. The modeled overall daily growth rate is found from Eq. 3.
To complete the model, it is necessary to specify the initial size distributions of the subpopulations [n1(0), n2(0)]. The observed initial size distributions are consistent with a mixture of two log normal components with different mean parameters and , common variance parameter σ2, and mixing proportion ψ.
The model outlined above contains 12 parameters. For each subpopulation, the parameters b, δmax, γmax, and E∗ specify the projection matrices. Four additional parameters describe the starting populations: ψ, , , and σ2. We assume that all of these parameters are constant within a day but may change between days. We use a maximum likelihood approach to estimate these parameters (SI Text) from observed cell size distributions. Parameter estimates do not depend on the concentration of cells but only on the proportion of cells in each size class. Importantly, we find that our two-subpopulation model is able to reproduce the range of cell size distribution patterns that typically occur in the data (Fig. 1).
Fig. 1.

Observed hourly cell size distributions of Synechococcus obtained from FCB at MVCO on (A) January 3, 2008, (B) September 25, 2008, and (C) June 16, 2008. The bottom row shows the model-produced cell size distributions and division rate (μ) from the maximum likelihood estimates of the parameters for each of the observed days directly above. The blank portion from hours 1 to 6 in D–F reflect the model application starting 6 h after dawn.
Results
Culture Experiments.
To evaluate the model’s ability to estimate division rates, we applied it to daily cell size distributions of an MVCO Synechococcus isolate grown under a range of temperature and light conditions. For this culture we estimated the division rate with standard counting methods (Materials and Methods). We found that across a range of conditions the model-based and count-based estimates were in good agreement on average (Fig. 2). The level of overall agreement can be measured by the accuracy component Cb of the concordance correlation coefficient (18). Specifically, Cb lies between 0 and 1 and measures how far the best fit linear relationship between two estimates deviates from the one-to-one line. When Cb = 1, the two lines are identical. For the data in Fig. 2, the estimate of Cb is 0.989, with a 95% CI of (0.949, 0.997). Such extremely high accuracy demonstrates that, on average, our model works as well as standard counting methods for estimating division rates across a range of growth conditions, diel patterns, and other controlling factors.
Fig. 2.

Comparison of division rates obtained from the model to division rates determined from change in cell concentration (Eq. 3) for each day in a Synechococcus culture grown over a range of light and temperature. Each point is an individual day. T, temperature (°C); E, light (μmol photons m−2⋅s−1). Color of points indicates temperature and marker symbol indicates light level.
We did encounter days when model and cell count division estimates did not agree, in particular, at higher temperatures (water temperatures at MVCO do not exceed 22 °C) and low light. The experiments with these discrepancies tended to occur sequentially (i.e., days in a particular batch experiment) and had an unusual cell size distribution pattern (abrupt increase then decrease of cell volume in the span of a few hours) that the model was not able to reproduce. Other batch experiments grown under these same light and temperature conditions showed different cell size distribution patterns, which the model was able to reproduce well. Notably, for these days, the model and cell count division rates agreed. These observations suggest caution in accepting model-based division rate estimates when model cell size distributions do not represent observed data well.
The culture division rates exhibited an expected response to growth conditions, typically increasing with temperature (with sufficient light) and increasing with light until saturation. For some temperature and light conditions, however, the division rates of the culture obtained from cell concentrations showed a fairly wide spread of values (e.g., light at 80 μmol photons m−2⋅s−1, temperature at 19 °C). This spread can partly be explained from the inclusion of data where cells were adjusting to a change in condition (e.g., just diluted or a recent temperature or light change; Fig. S4). For these days, cells would still be acclimating and the division rate of the culture would not be at steady state. The ability of the model to capture much of the observed variation is a further line of evidence for its ability to estimate division rates when cells are adjusting to different environments, as cells continuously do in nature.
Dilution Series Experiments.
We used dilution series experiments with natural Synechococcus populations as a second line of model evaluation. We used only experiments that demonstrated net growth rate dynamics consistent with dilution of grazers (3, 19). The model was applied to cell size distributions measured in undiluted samples (full grazing impact). Model division rates agree well with those obtained from the dilution series technique [Cb = 0.65, with a 95% CI of (0.377, 0.839)] across a range of division and loss rates (Fig. 3A and Table S2).
Fig. 3.

(A) Relationship between division rate from the model and the dilution series method for assemblages of Synechococcus in Woods Hole Harbor water. The model was applied to observations from the undiluted incubation bottle. Each symbol indicates the date of the dilution series experiment (Table S2). 95% CIs are shown for the division rate estimate obtained from the replicated dilution series. (B) Relationship between division rate from the model applied to cell size distributions from the undiluted bottle and from the most diluted bottle of each dilution series experiment. The undiluted bottle should have full grazing impact, whereas the diluted bottle should have lower grazing pressure.
Grazing Assumptions.
Our model assumes diel changes in size distributions are only a function of physiological processes. Size selective grazing has the potential to violate this assumption. If Synechococcus cells are preferentially ingested according to size, grazing could alter cell size distributions in ways unrelated to cell growth and division. Classes of grazers known to prey on Synechococcus, such as nanoflagellates and ciliates, have been observed to be selective across wide size ranges (20, 21), but it is unknown whether this extends to the smaller size differences among cells of a single species growing and dividing.
We found that division rate estimates from the model were not significantly different between the undiluted bottle (higher grazing pressure) and the most-diluted bottle (presumably lower grazing pressure), thus supporting the assumption that size-selective grazing is not important (Fig. 3B). We note that the dilution series experiments included in this comparison took place mainly in autumn (only one summer day was included), so we cannot rule out the possibility that grazing effects might occur at other times of year (e.g., grazer community with different prey selection capabilities).
These experiments show that the approach is robust across a range of grazing pressures (Table S2). Although a few days had low grazing pressure (grazing rate ≤ 0.08 d−1), most had relatively higher rates (>0.25 d−1). These higher grazing rates tended to occur on the second day of incubation, possibly due to grazer reproduction and/or shifts in prey preferences. The agreement in model division rates between bottles in experiments with higher grazing pressure supports our assumption that the model estimates are independent of grazer activity.
Division Rates of a Natural Synechococcus Population.
The seasonal cycle of Synechococcus cell abundance at MVCO is characterized by wintertime low concentrations of a few hundred cells per milliliter and summertime levels that can exceed 105 cells per milliliter. Overlaid on this seasonal pattern are abundance changes that occur on the timescale of a few weeks; in some cases, cell abundance can change by 10-fold (see late summer months in Fig. 4A).
Fig. 4.

(A) Hourly Synechococcus cell concentration for 2008 at MVCO. (B) Daily division rate and 95% CIs from the model. Due to gaps in either FCB data or light data, only 236 d could be considered as input for the model. Confidence intervals reflect the uncertainty in the estimated division rates associated with sampling variability (presuming the model is correct). (C) Daily net growth rates obtained with Eq. 3 and daily averages of smoothed cell concentration (A, with a 24-h running mean to reduce tidal effects). Black curve is a 7-d running mean.
Application of the model to the time series of cell size distributions at MVCO in 2008 (Fig. 4B) reveals distinct seasonality in division rate. Division rate is very low in winter months and begins to increase almost linearly during spring. Division rate is highest during the summer months and slowly declines in autumn back to wintertime low values. The low rates in winter (0–0.2 d−1) suggest physiological limitation. In summer, however, division rates are the highest observed throughout the year (0.7–1.0 d−1) and suggest that the Synechococcus population is not experiencing much resource limitation. The rates produced by the model are consistent with known Synechococcus division rates (7, 11, 22), and maximum rates are similar to those observed for the Synechococcus strain isolated from this location (Fig. 2).
Discussion
Knowledge of division rates is crucial to understanding drivers of abundance change of phytoplankton populations. A major challenge is not only to partition changes in abundance into growth and loss processes but also to have this information at a resolution that is relevant for the organism under study. For populations that can be identified and measured at high frequency, the method we have presented makes it possible to obtain daily division rates. We conducted, to our knowledge, the first evaluation of the model’s ability to estimate division rates from cell size distributions and found it is able to do so accurately for coastal Synechococcus. With this approach, we obtained an unprecedented record of daily division rates over an annual cycle at MVCO. These results provide insight not only into the environmental factors that may regulate division rate but also the quantitative role of cell division in producing changes in cell abundance.
Synechococcus division rates show a distinct seasonal cycle (Fig. 4B). Low values in winter are most likely due to temperature or light limitation. In temperate regions, temperature seems to be a driving force in shaping Synechococcus abundance (23–25). Waterbury et al. (11) suggested temperature as a limiting factor for Synechococcus in this region because initiation of the spring bloom did not occur until the water temperature reached 12 °C. Our observations support this hypothesis as weekly averaged division rates have a strong positive correlation with temperature during the first half of the year (Fig. 5C) when they are only weakly related to light (Fig. S5). The increase in division rate begins around mid-April, when water temperature reaches ∼8 °C and continues to increase until July, when the highest water temperatures occur (∼22 °C). During the second half of the year, division rates are consistently lower than those encountered in spring for the same temperature. This finding suggests that other factors limit division rate during this time. Nitrate concentrations are typically low (undetectable or <1 μM) at MVCO, but higher values are encountered intermittently in fall and winter, likely associated with storms or other mixing processes. High division rates in summer do not indicate extensive physiological limitation, and given undetectable nitrate concentrations, this suggests rapid turnover of nutrients.
Fig. 5.
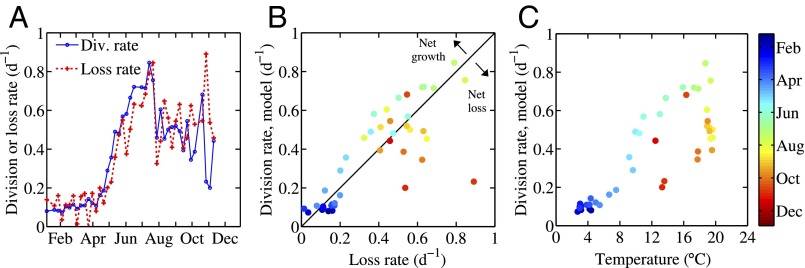
(A) Weekly averaged division rates, obtained from the model, and computed loss rates for Synechococcus at MVCO for 2008. Daily loss rates were calculated by subtracting net growth rate (Fig. 4C) from model-produced division rate. (B) Comparison of weekly averaged loss and division rates. (C) Relationship between weekly averaged division rates and temperature. In B and C, symbol color denotes time of year.
With net change in abundance and division rates quantified, we can calculate bulk loss rates as the difference between these quantities (Fig. 4C). These loss rates reflect both mortality (e.g., predation, viral lysis) and the net balance of immigration and emigration due to processes such as advection and mixing. Comparison of weekly averaged division and loss rates (Fig. 5) illustrates how the combination of division and loss processes produce the observed changes in cell abundance. During the winter and summer months, cell abundance is nearly constant over time scales of several days to weeks, so new cells produced from division must be balanced by losses. As a result, loss rates are low in winter and high in summer. Calculated loss rate tends to be correlated with division rate, suggesting that losses are mainly biological in nature rather than associated with advection or mixing of patchy cell distributions. If advection or mixing was dominant, it is unlikely that losses due to these processes would match division rate in magnitude. For Synechococcus, the majority of the biological loss term is most likely due to heterotrophic grazers rather than viral lysis (26–28). Grazers of picophytoplankton are capable of responding rapidly to increases in prey concentration, as their own division rates can match or exceed that of their prey (29). A tight balance between division of picophytoplankton and loss by predation has been demonstrated in both open ocean and coastal systems (24, 29–33). Our results also demonstrate a tight coupling between division and loss, suggestive of grazing, and reveal that this balance is present over time during the winter and summer months.
At MVCO for 2008, Synechococcus population abundance underwent roughly a 1,000-fold change during its spring bloom. As required for this bloom to occur, the division rate was higher than loss rate during this time (Fig. 5). Compared to the overall magnitude of the division and loss rates themselves, the difference between these two rates, however, was small. The mirror situation occurred in autumn, when cell concentration began to decline. During this time, loss rate was generally higher than division rate but by only a small amount. An exception occurred during an event in late October, when cell abundance increased by roughly an order of magnitude in the span of a few days. Although we only have division rate estimates for just before and after this period of drastic abundance change, these rates were relatively constant and moderate. We surmise that this large increase in abundance may have been due to a different water mass with higher Synechococcus cell concentration moving into the study area. In contrast to the dramatic multiday event in October, the large seasonal cell abundance changes appear to result from small (0.1–0.3 d−1), but systematic deviations from 0 weekly averaged net growth rate (Fig. 4C, solid curve). Spring blooms in temperate locations are usually attributed to temporary escape from predation, especially for the larger eukaryotic phytoplankton. For the Synechococcus population at this site, this does not appear to be the case; high biological loss appears to be a constant attribute of the system. The prolonged Synechococcus spring bloom is a result of increasing division rates (associated with increasing water temperature) during a 3-mo period that allow for a small, but persistent, positive difference over the ongoing losses. These small differences between division and loss processes can have an enormous effect on the evolution of coastal picophytoplankton blooms.
The calculated loss rates presented here also raise interesting questions surrounding the grazing community. Currently, we do not know the identities of Synechococcus predators at MVCO. The same type of grazer may persist over the seasonal cycle or different grazers could be selected for by changing Synechococcus division rates and abundance. It is important to understand the mechanisms behind the lags in magnitude between loss rate and division rate. Time lags could occur from grazer feeding thresholds or possibly due to differences in temperature responses. Answers to these questions hold important information on the fate of carbon fixed by Synechococcus.
Natural Synechococcus assemblages are believed to be composed of multiple ecotypes (34, 35), each of which may respond differently to its environment. Our model approach provides a composite division rate for the entire Syenchococcus assemblage. Although our model incorporates two subpopulations, these may very well represent composites of even more finely divided types. Further research is needed to determine if the model can accurately resolve subpopulation division rates of known mixed ecotypes. This resolution would depend on how well physiological differences between ecotypes are manifest in their cell size distributions. Inferences about the contribution of ecotypes to the composite division rate would require quantitative investigations into relative ecotype abundance with molecular approaches and basic knowledge about the physiology of the ecotypes present (growth response to light, nutrients, temperature).
This analysis of Synechococcus abundance change demonstrates how our knowledge of population dynamics hinges not only on measurement and observational capability, but also on innovations in modeling and interpretation. The method presented here fills the gap in our current ability to estimate division rate on relevant time scales over extended periods of time. Although our model evaluation and experiments focused on Synechococcus, this method could be applicable to other phytoplankton (and possibly bacteria) if high-resolution, taxon-specific, diel changes can be characterized. This characterization is more feasible for certain groups of phytoplankton (i.e., Prochlorococcus and Synechococcus) than others, but current automated imaging technology may make other taxon-specific characterization feasible (36). Even if taxon-specific changes cannot be realized, this model formulation may also be useful to quantify bulk or average division rate properties. For instance, a version of this approach has been applied by Dall’Olmo et al. (37) to estimate carbon biomass of phytoplankton and division rates from the diel cycle of spectral beam-attenuation coefficients.
For the Synechococcus assemblage at MVCO, this method allowed us to estimate daily division rates over an annual cycle and calculate loss rates at this same resolution. We find that throughout the year, growth and loss processes are tightly coupled. Very high cell division rates (up to 1 d−1) can persist for extended periods with little or no change in cell abundance, and the entire seasonal cycle of abundance (three orders of magnitude change) results from small (0.1–0.3 d−1) deviations from 0 net growth. We also document strong evidence that division rates are temperature limited during the first half of the year, whereas other environmental factors are important later. Temperature regulation of seasonal Synechococcus blooms may be a characteristic feature in temperate waters (23–25), suggesting this abundant picophytoplankter may be especially responsive to ongoing impacts of climate change. The knowledge gained from this approach contributes to our understanding of Synechococcus dynamics and sets the stage to further examine the role that these organisms play in ecological and biogeochemical cycles.
Materials and Methods
FlowCytobot.
The FCB was deployed at the MVCO (SI Text), sampling 4 m below mean water level. Details of the design and performance of the FCB are described elsewhere (15). Data analysis and enumeration of Synechococcus cells were as described in ref. 13. The FCB measures side angle scattering, which is converted to cell volume (15).
Culture Setup and Sampling.
The Synechococcus strain used for this study was isolated from coastal surface waters at MVCO in May 2006. Although this isolate did not go through any clonal isolation steps (i.e., no dilution to extinction, sorting, or plating), sequencing of the diversity marker ntcA for this culture shows only closely related representatives that belong to clade I of marine Synechococcus (SI Text). The isolate was grown as batch cultures in 1-L jacketed vessels with SNAX medium (11) with trace metal amount reduced to 20% to minimize precipitation. Cultures were kept in exponential growth at cell concentrations spanning the range typical at MVCO. A range of division rates was achieved by varying temperature and light intensity. Temperature was controlled between 10 °C and 28 °C by pumping water through the vessel jacket at ∼1 L⋅min−1 from a water bath. Vessels were illuminated by two 32-W white fluorescent lamps with controllable light output and a 14:10-h light:dark cycle. Light intensity was controlled and recorded by a MiniLab USB data acquisition interface connected to a scalar irradiance meter (QSL 100; Biospherical Instruments). Incident light followed a sinusoidal pattern with maximum intensity 80 μmol photons m−2 s−1 inside the vessels. Black plastic screens were used to decrease light intensity to 65%, 42%, 27%, and 18% (one to four layers of mesh, respectively) of maximum. To reduce the tendency of cells to clump and stick to the walls of the vessel, the walls were siliconized, and cultures were mixed at about 1.34 × g by 6-cm glass paddles.
Cultures were sampled with a laboratory version of the FCB. Data processing was the same as for field samples. The model was applied to cell size distributions from individual days of batch grow outs (Fig. S4). For estimate comparison, division rates from the culture were calculated with Eq. 3 using cell concentrations at dawn of one day and dawn of the next day. Culture observations were included in the final data set for model comparison only if they exhibited (i) division patterns phased to the diel cycle and (ii) a division rate consistent with other days under similar conditions (i.e., outlier or negative division rates were excluded).
Dilution Series Experiments.
Synechococcus daily division rate and grazing rate in water from Woods Hole Harbor were determined during 12 dilution series experiments (3) (6 d in June 2012 and 6 d in October 2012; Table S2 and SI Text). Incubations were conducted at ambient water temperature in a flow-through seawater tank where the FCB was also located. For each experiment, two bottles corresponding to the highest dilution and whole seawater were sampled by the FCB. Data processing was the same as that for the FCB deployed at MVCO. Irradiance was measured with the surface portion of a HyperPro radiometer (Satlantic LP). For a few days, when radiation data could not be obtained, radiation data from MVCO (located 15 mi south of Woods Hole Harbor) were used.
Bottles not connected to the FCB were sampled at time 0 (dawn local time) and 24 and 48 h. Samples were preserved with glutaraldehyde to a final concentration of 0.1% and incubated 10 min before being stored in liquid nitrogen until later flow cytometric analysis. Synechococcus in preserved samples were enumerated with a FACSCaliber (BD Biosciences) flow cytometer. Synechococcus cells were identified on the basis of their characteristic orange fluorescence from the accessory pigment phycoerythrin (38). Net division rate was calculated with Eq. 3, which assumes exponential growth and loss processes. We fit the data (net division against dilution level) with either a one-phase or two-phase linear regression model as some data suggested nonlinear dilution response (19) (SI Text). The y intercept of the regression line was taken as the division rate (net growth rate extrapolated to 0 fractions of whole sea water). Grazing rate was calculated as the difference between the intercept rate and the whole seawater net growth rate.
Supplementary Material
Acknowledgments
We thank A. Beet, H. Caswell, L. Thomas, S. W. Chisholm, and J. Waterbury for helpful discussions; A. Post and K. Hammar for culture sequencing assistance; S. Laney and R. Gast for instrument use and assistance; and E. Peacock and T. Crockford for logistical support. This work was supported by US National Science Foundation Grants OCE-0530830, OCE-1031256, and DEB-1257545, National Aeronautics and Space Administration Grant NNX11AF07G, Gordon and Betty Moore Foundation Grant GGA#934, and a National Defense Science and Engineering graduate fellowship from the US Department of Defense (to K.R.H.-C.).
Footnotes
The authors declare no conflict of interest.
This article is a PNAS Direct Submission.
This article contains supporting information online at www.pnas.org/lookup/suppl/doi:10.1073/pnas.1321421111/-/DCSupplemental.
References
- 1.Field CB, Behrenfeld MJ, Randerson JT, Falkowski P. Primary production of the biosphere: Integrating terrestrial and oceanic components. Science. 1998;281(5374):237–240. doi: 10.1126/science.281.5374.237. [DOI] [PubMed] [Google Scholar]
- 2.Campbell L, et al. First harmful Dinophysis (Dinophyceae, Dinophysiales) bloom in the U.S. is revealed by automated imaging flow cytometry. J Phycol. 2010;46(1):66–75. [Google Scholar]
- 3.Landry M, Hassett R. Estimating the grazing impacts of micro-zooplankton. Mar Biol. 1982;67(3):283–288. [Google Scholar]
- 4.Worden AZ, Binder BJ. Application of dilution experiments for measuring growth and mortality rates among Prochlorococcus and Synechococcus populations in oligotrophic environments. Aquat Microb Ecol. 2003;30(2):159–174. [Google Scholar]
- 5.McDuff R, Chisholm S. The calculation of in situ growth rates of phytoplankton populations from fractions of cells undergoing mitosis: A clarification. Limnol Oceanogr. 1982;27(4):783–788. [Google Scholar]
- 6.Campbell L, Carpenter EJ. Estimating the grazing pressure of heterotrophic nanoplankton on Synechococcus spp. using the sea water dilution and selective inhibitor techniques. Mar Ecol Prog Ser. 1986;33:121–129. [Google Scholar]
- 7.Binder BJ, Chisholm SW. Cell cycle regulation in marine Synechococcus sp. strains. Appl Environ Microbiol. 1995;61(2):708–717. doi: 10.1128/aem.61.2.708-717.1995. [DOI] [PMC free article] [PubMed] [Google Scholar]
- 8.DuRand MD. 1995. Phytoplankton growth and diel variations in beam attenuation through individual cell analysis. PhD thesis (Massachusetts Institute of Technology, Woods Hole Oceanographic Institution, Woods Hole, MA)
- 9.Binder BJ, Chisholm SW, Olson RJ, Frankel SL, Worden AZ. Dynamics of picophytoplankton, ultraphytoplankton and bacteria in the central equatorial Pacific. Deep Sea Res Part II Top Stud Oceanogr. 1996;43(4-6):907–931. [Google Scholar]
- 10.Vaulot D, Marie D. Diel variability of photosynthetic picoplankton in the equatorial Pacific. J Geophys Res. 1999;104(C2):3297–3310. [Google Scholar]
- 11.Waterbury JB, Watson SW, Valois FW, Franks DG. Biological and ecological characterization of the marine unicellular cyanobacterium Synechococcus. Can Bull Fish Aquat Sci. 1986;214:71–120. [Google Scholar]
- 12.Jacquet S, Partensky F, Lennon J-F, Vaulot D. Diel patterns of growth and division in marine picoplankton in culture. J Phycol. 2001;37(3):357–369. [Google Scholar]
- 13.Sosik HM, Olson RJ, Neubert MG, Shalapyonok A, Solow AR. Growth rates of coastal phytoplankton from time-series measurements with a submersible flow cytometer. Limnol Oceanogr. 2003;48(5):1756–1765. [Google Scholar]
- 14.Steele J, editor. Spatial Pattern in Plankton Communities, Nato Conference Series. Vol 3. New York: Springer; 1978. [Google Scholar]
- 15.Olson RJ, Shalapyonok AA, Sosik HM. An automated submersible flow cytometer for pico- and nanophytoplankton: FlowCytobot. Deep Sea Res Part I Oceanogr Res Pap. 2003;50(2):301–315. [Google Scholar]
- 16.Zinser ER, Kolter R. Mutations enhancing amino acid catabolism confer a growth advantage in stationary phase. J Bacteriol. 1999;181(18):5800–5807. doi: 10.1128/jb.181.18.5800-5807.1999. [DOI] [PMC free article] [PubMed] [Google Scholar]
- 17.Ryall B, Eydallin G, Ferenci T. Culture history and population heterogeneity as determinants of bacterial adaptation: The adaptomics of a single environmental transition. Microbiol Mol Biol Rev. 2012;76(3):597–625. doi: 10.1128/MMBR.05028-11. [DOI] [PMC free article] [PubMed] [Google Scholar]
- 18.Lawrence Lin AS, Hedayat BS, Yang M. Statistical methods in assessing agreement: Models, issues and tools. J Am Stat Assoc. 2002;97(457):257–270. [Google Scholar]
- 19.Gallegos CL. Microzooplankton grazing in phytoplankton in the Rhode River, Maryland: Nonlinear feeding kinetics. Mar Ecol Prog Ser. 1989;57:23–33. [Google Scholar]
- 20.Gonzalez JM, Sherr EB, Sherr BF. Size-selective grazing on bacteria by natural assemblages of estuarine flagellates and ciliates. Appl Environ Microbiol. 1990;56(3):583–589. doi: 10.1128/aem.56.3.583-589.1990. [DOI] [PMC free article] [PubMed] [Google Scholar]
- 21.Jürgens K, Matz C. Predation as a shaping force for the phenotypic and genotypic composition of planktonic bacteria. Antonie van Leeuwenhoek. 2002;81(1-4):413–434. doi: 10.1023/a:1020505204959. [DOI] [PubMed] [Google Scholar]
- 22.Moore LR, Goerickle R, Chisholm SW. Comparative physiology of Synechococcus and Prochlorococcus: Influence of light and temperature on growth, pigments, fluorescence and absorptive properties. Mar Ecol Prog Ser. 1995;116:259–275. [Google Scholar]
- 23.Li WKW. Annual average abundance of heterotrophic bacteria and Synechococcus in surface ocean waters. Limnol Oceanogr. 1998;43(7):1746–1753. [Google Scholar]
- 24.Agawin N, Sr, Duarte CM, Agustí S. Growth and abundance of Synechococcus sp. in a Mediterranean Bay: Seasonality and relationship with temperature. Mar Ecol Prog Ser. 1998;170:45–53. [Google Scholar]
- 25.Li WKW, Dickie PM. Monitoring phytoplankton, bacterioplankton, and virioplankton in a coastal inlet (Bedford Basin) by flow cytometry. Cytometry. 2001;44(3):236–246. doi: 10.1002/1097-0320(20010701)44:3<236::aid-cyto1116>3.0.co;2-5. [DOI] [PubMed] [Google Scholar]
- 26.Waterbury JB, Valois FW. Resistance to co-occurring phages enables marine synechococcus communities to coexist with cyanophages abundant in seawater. Appl Environ Microbiol. 1993;59(10):3393–3399. doi: 10.1128/aem.59.10.3393-3399.1993. [DOI] [PMC free article] [PubMed] [Google Scholar]
- 27.Baudoux A-C, Veldhuis MJ, Witte HJ, Brussaard CP. Viruses as mortality agents of picophytoplankton in the deep chlorophyll maximum layer during IRONAGES III. Limnol Oceanogr. 2007;52(6):2519–2529. [Google Scholar]
- 28.Tsai A-Y, et al. Viral lysis and nanoflagellate grazing as factors controlling diel variations of Synechococcus spp. summer abundance in coastal waters of Taiwan. Aquat Microb Ecol. 2012;66(2):159–167. [Google Scholar]
- 29.Landry MR, Calbet A. Microzooplankton production in the oceans. ICES J Marine Sci. 2004;61(4):501–507. [Google Scholar]
- 30.Landry MR, Constantinou J, Kirshtein J. Microzooplankton grazing in the central equatorial Pacific during February and August, 1992. Deep Sea Res Part II Top Stud Oceanogr. 1995;42(2-3):657–671. [Google Scholar]
- 31.Lui H, Campbell L, Landry MR. Growth and mortality rates of Prochlorococcus and Synechococcus measured with a selective inhibitor technique. Mar Ecol Prog Ser. 1995;116:277–287. [Google Scholar]
- 32.Agawin NSR, Duarte CM, Agustí S. Response of Mediterranean Synechococcus growth and loss rates to experimental nutrient inputs. Mar Ecol Prog Ser. 2000;206:97–106. [Google Scholar]
- 33.Strom S, Brainard M, Holmes J, Olson M. Phytoplankton blooms are strongly impacted by microzooplankton grazing in coastal North Pacific waters. Mar Biol. 2001;138(2):355–368. [Google Scholar]
- 34.Palenik B. Cyanobacterial community structure as seen from RNA polymerase gene sequence analysis. Appl Environ Microbiol. 1994;60(9):3212–3219. doi: 10.1128/aem.60.9.3212-3219.1994. [DOI] [PMC free article] [PubMed] [Google Scholar]
- 35.Ahlgren NA, Rocap G. Culture isolation and culture-independent clone libraries reveal new marine Synechococcus ecotypes with distinctive light and N physiologies. Appl Environ Microbiol. 2006;72(11):7193–7204. doi: 10.1128/AEM.00358-06. [DOI] [PMC free article] [PubMed] [Google Scholar]
- 36.Olson RJ, Sosik HM. A submersible imaging-in-flow instrument to analyze nano-and microplankton: Imaging FlowCytobot. Limnol Oceanogr Methods. 2007;5:195–203. [Google Scholar]
- 37.Dall’Olmo G, et al. Inferring phytoplankton carbon and eco-physiological rates from diel cycles of spectral particulate beam-attentuation coefficient. Biogeosciences. 2011;8(11):3423–3440. [Google Scholar]
- 38.Olson RJ, Chisholm SW, Zettler ER, Armbrust EV. Pigments, size, and distribution of Synechococcus in the North Atlantic and Pacific Oceans. Limnol Oceanogr. 1990;35(1):45–58. [Google Scholar]
Associated Data
This section collects any data citations, data availability statements, or supplementary materials included in this article.