

Significance
China’s fast socioeconomic growth increasingly strains national water resources, notably through rising urbanization and meat demand. Agriculture is located mainly in the dry north, where irrigation largely relies on groundwater reserves. This paper analyzes the role of international and interprovincial food trade in China’s national agricultural water-use and food supply. We combine a hydrological model with a trade model to quantify the volumes of irrigation and rainfall water transferred between provinces and other countries through agricultural trade. We find that China’s dry, irrigation-intensive provinces tend to export food commodities to wetter places, and identify specific provinces and products showing high potential for irrigation productivity enhancements. These findings are essential to inform sound policies aimed at improving agricultural sustainability in China.
Keywords: sustainable agriculture, environmental policy, trade policy
Abstract
China’s water resources are under increasing pressure from socioeconomic development, diet shifts, and climate change. Agriculture still concentrates most of the national water withdrawal. Moreover, a spatial mismatch in water and arable land availability—with abundant agricultural land and little water resources in the north—increases water scarcity and results in virtual water transfers from drier to wetter regions through agricultural trade. We use a general equilibrium welfare model and linear programming optimization to model interprovincial food trade in China. We combine these trade flows with province-level estimates of commodities’ virtual water content to build China’s domestic and foreign virtual water trade network. We observe large variations in agricultural water-use efficiency among provinces. In addition, some provinces particularly rely on irrigation vs. rainwater. We analyze the virtual water flow patterns and the corresponding water savings. We find that this interprovincial network is highly connected and the flow distribution is relatively homogeneous. A significant share of water flows is from international imports (20%), which are dominated by soy (93%). We find that China’s domestic food trade is efficient in terms of rainwater but inefficient regarding irrigation, meaning that dry, irrigation-intensive provinces tend to export to wetter, less irrigation-intensive ones. Importantly, when incorporating foreign imports, China’s soy trade switches from an inefficient system to a particularly efficient one for saving water resources (20 km3/y irrigation water savings, 41 km3/y total). Finally, we identify specific provinces (e.g., Inner Mongolia) and products (e.g., corn) that show high potential for irrigation productivity improvements.
China faces most of the major challenges to sustainable agriculture: fast socioeconomic development, rapid urbanization, and climate change along with very limited water resources and arable land per capita. Because arable land is available mainly in the water-scarce north, irrigation has become widespread, covering 45% of the country’s agricultural land and accounting for 65% of national water withdrawal [Food and Agriculture Organization of the United Nations (FAO), http://fao.org/nr/water/aquastat/countries_regions/china/index.stm]. However, this development appears unsustainable because of the associated environmental impacts, such as groundwater depletion (1, 2) [in the northern provinces of Inner Mongolia and Gansu, irrigation relies on groundwater at 67% and 64%, respectively (3)] and river pollution (4). China’s water resources are also strained by increasing demand from the rapidly growing industrial and residential sectors (5). Agriculture, the most water-intensive sector, may be a strong lever to reduce China’s rising national water use.
The water used throughout the production process of a good is referred to as “virtual water.” In the case of products containing virtual water (i.e., requiring water for their production), trade is a means of transferring water resources between regions. Moreover, domestic and international food trade may help save water at the national scale by encouraging exchanges of virtual water from highly productive countries or provinces to less productive locales, resulting in a smaller water use per unit crop grown (6). China’s role in the global virtual water trade (VWT) network has been increasingly important, with its food imports contributing to 36% of the global water savings associated with international food trade (7). This significant water-saving potential of food trade needs to be explored at the national level for more policy-relevant results. The need for China to include virtual water in its national policy has been pointed out (8, 9)—especially as the country’s virtual water imports will likely increase further because of projected population and economic growth (10)—and a fine-scale domestic analysis of the country’s virtual water trade is key to guiding such policy planning.
China’s internal VWT flows have been quantified with various methods to estimate trade [e.g., input/output (11), food balance method (12)]—required by a lack of detailed data—and commodities’ virtual water content (VWC). Most of these studies have been carried out at the large regional scale (i.e., eight administrative divisions). However, given the significant spatial variability of water resources and land endowments in China (13, 14), analyzing VWT between provinces (i.e., 31 divisions) encompasses a larger portion of domestic trade and provides crucial insights for national strategies to optimize water efficiency and agricultural production.
China’s interprovincial VWT may be described as a weighted and directed network, in which link direction is given by the orientation of trade (i.e., from exporting to importing province), and link weights are the volumes of virtual water traded between provinces. Interregional commodity trade [from the CHINAGRO economic model (15)] is downscaled to interprovincial trade flows through a linear programming optimization aimed at minimizing trade costs (Materials and Methods and SI Appendix). Interprovincial food trade volumes are then converted into virtual water volumes by using VWC estimates (16, 17), which quantify the amount of water used to produce a unit of each commodity in each province, distinguishing between two main sources of water: “green” water from direct rainfall and “blue” water from irrigation sources, such as rivers, surface reservoirs, and groundwater (following the approach in ref. 18; Materials and Methods and SI Appendix). We use the global hydrological model H08 (16, 17) to estimate crop water use at 0.5° spatial resolution before aggregating to the province level. In this study, we focus on the VWT network associated with trade of four major crops (corn, rice, soy, and wheat) and three livestock products (ruminant, pork, and poultry). These products accounted for about 93% of China’s domestic food supply in 2005 [in calories (FAO, http://faostat3.fao.org)]. We find that the total volume of virtual water traded by China in 2005, domestically and internationally, was 239 km3⋅y−1, accounting for ∼9% of world freshwater withdrawal for agriculture (Pacific Institute, http://worldwater.org/data.html).
In this paper, we construct and analyze China’s interprovincial and foreign VWT network to address the following questions: (i) What is the connectivity and flow structure of China’s interprovincial VWT network? (ii) Is China’s domestic food trade efficient in terms of blue and green water resources? (iii) What is the role of foreign trade in China’s VWT network and in the associated water savings? (iv) Which province or commodity might be targeted to reduce water use without decreasing current national food production levels?
Results
Virtual Water Content Heterogeneity Within China.
We observe significant differences in the VWC of crops and livestock among Chinese provinces. Indeed, when averaging the provincial VWC of corn, rice, soy, and wheat on the one hand and ruminant, pork, and poultry on the other, we obtain wide ranges of values. VWC ranges from about 700 kgwater/kgcrop for crops produced in Tibet to more than 2,300 kgwater/kgcrop in Hainan province, and from about 2,000 kgwater/kgmeat for meat produced in Guangdong to nearly 5,500 kgwater/kgmeat in Inner Mongolia (Fig. 1). Moreover, the share of blue and green water sources in total VWC also varies among provinces (Figs. 1 and 2). The mean share of irrigation is about 25% in crop’s VWC and 16% in livestock’s VWC, but in Xinjiang, Ningxia, and Inner Mongolia, irrigation water is used predominantly for crop production (85%, 69%, and 49% of VWC from irrigation, respectively; 54% of livestock’s VWC from irrigation in Ningxia). This reflects a climate with very little rainfall during the growing season. However, a few provinces, such as Chongqing and Guizhou, rely almost only on rainfall (only 2% and 3% of crop’s VWC from irrigation, respectively; Fig. 1).
Fig. 1.

Comparison across Chinese provinces of commodities’ VWC (kilograms of water per kilograms of product) averaged over corn, rice, soy, and wheat for crops (C; lower bars) and pork, poultry, and ruminant for livestock (L; upper bars) in 2005. Blue and green portions of the bars indicate irrigation water and rainfall, respectively. Top exporters and importers of crops and livestock are highlighted. Note the spatial variability and the general dominance of livestock VWC (which accounts for feed provenience) vs. crop VWC.
Fig. 2.
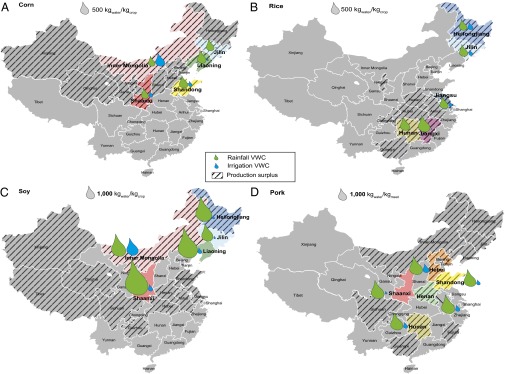
VWC (kilograms of water per kilogram) of corn (A), rice (B), soy (C), and pork (D) in the top five exporting provinces in 2005 (in units of domestic commodity weight). Blue and green drops indicate the volumes of the product’s VWC from irrigation sources and from rainfall, respectively (note the different scale in C and D). Hatched provinces present higher local production than consumption. Top exporting provinces are colored with the same scheme as in Fig. 3. Note the much larger water use for soy compared with other crops, and the particularly large blue-to-green water ratios in Inner Mongolia for corn and soy, in Heilongjiang for rice, and in Hebei for pork.
In addition, we observe differences in VWC among crops within the same province. In particular, soy always requires much more water than the other three main crops: rice, corn, and wheat (SI Appendix and Fig. 2; notice the different scale for soy and pork). For example, in Ningxia and Anhui provinces, soy requires as much as 4,000–5,000 kgwater/kgcrop whereas rice needs only 700 kgwater/kgcrop in most of China.
Virtual Water Trade.
The network’s flow distribution is remarkably homogeneous relative to that of the international VWT network, analyzed in the literature (7), as all provinces participate in VWT to a comparable extent. Indeed, the values of undirected node strength—VWT imports and exports of a given province—span a range of less than two orders of magnitude: (7.4 × 10⁸; 5.6 × 10¹⁰ m3/y) vs. (1011; 1015 m3/y) for the global network (7). We still identify important exporting provinces, such as Shaanxi, Shandong, and Henan (including trade of foreign goods or not) and major importers, such as Shaanxi, Guangdong, and Guangxi. The largest domestic trade link is from Liaoning to Shandong: 7.5 km3/y (mainly from soy and corn: 4.6 and 1.3 km3/y, respectively) (Fig. 3). To be able to track the re-export of foreign goods within Chinese borders, we have distinguished foreign and domestic commodities in our optimization procedure (Materials and Methods and SI Appendix). The international harbors in Tianjin, Liaoning, and Shanghai participate in 95% of the foreign trade analyzed here and export domestically more than 60% of the foreign commodities they import (SI Appendix, Fig. S10). Through these domestic re-exports of foreign goods, at least 14 provinces obtain a considerable quantity of foreign food and associated virtual water. When combining international and domestic trade flows, we observe the major role of Chinese imports from abroad: VWT associated with direct international imports account for 20% of Chinese total VWT (i.e., domestic trade of local goods and direct international trade) (Fig. 3).
Fig. 3.
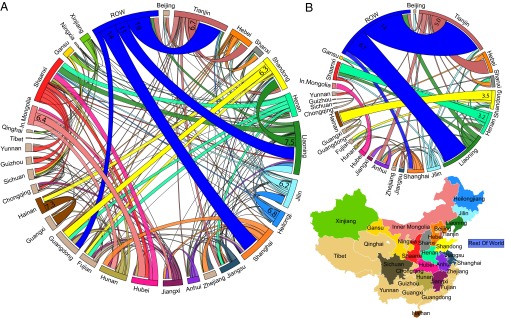
Virtual water trade between Chinese provinces and the ROW (A), and associated positive global water savings (B). Numbers indicate the volume of water in cubic kilometers, and the link color corresponds to the exporting province. The map at the lower right provides a key to the color scheme. Note that the largest water-saving links are foreign imports by Tianjin and Liaoning, and exports from Shandong to Hainan. This figure was created using the network visualization software from ref. 24.
Water Savings.
A trade relationship contributes to global water savings if it is directed from a relatively more efficient location (with lower VWC) to a relatively less efficient location (with higher VWC; Materials and Methods). In this case, trade saves water resources at the “global” level (i.e., the level encompassing all parties involved) compared with an autarky situation, in which each province produces what it consumes. Because we focus on China’s domestic and international trade, all global water savings correspond to national savings for China, except direct exports to abroad, which are negligible (i.e., 3% of Chinese total VWT), and direct international imports, which lead to national savings for China that are even greater than global savings. Indeed, in the latter case, water savings from the global perspective are the amount of water not used in China minus the water used abroad, whereas Chinese national savings are simply the amount of water not used in China.
We find that China’s domestic and international food trade leads to global water savings of 47 km3 (Fig. 4B). These savings represent about 13% of Chinese irrigation water use in 2005 (FAO, http://fao.org/nr/water/aquastat/countries_regions/china/index.stm). In particular, the water savings associated with trade of soy products (41 km3) largely dominate water savings from Chinese domestic and international VWT (Fig. 4B). However, domestic trade of local goods alone leads to a net loss of blue water sources: 3.1 km3 (vs. 5.9 km3 of green water savings) (Fig. 4A). Indeed, domestic wheat trade is the most efficient system (saving 7.7 km3), but corn, pork, and soy trade (losses of 8.2 km3, 0.9 km3, and 0.6 km3 of blue water, respectively) contribute to the national loss of blue water sources.
Fig. 4.

Total water savings due to (A) domestic trade of local food only (2.8 km3) and (B) all domestic and foreign food trade (47 km3) in 2005, by product and water source. Note that domestic corn trade loses 8.2 km3/y of blue water, whereas soy trade with foreign partners leads to significant blue and green water savings (21 and 20 km3, respectively).
Discussion
We found that foreign trade plays an important role in the Chinese VWT network. Indeed, direct international imports correspond to 20% of the total VWT volume in 2005, and are re-exported to multiple provinces throughout the country (SI Appendix, Fig. S10). Ninety-three percent of these foreign virtual water imports are associated with soy-based commodities. These soy imports from abroad contribute to 87% of the total water savings associated with China’s food trade, saving a significant part of Chinese blue and green water resources (21 km3 and 20 km3, respectively; Fig. 4B). Indeed, China imports soy mainly from Argentina, Brazil, and the United States, three countries that use significantly less water than China to produce soy (7), thanks to more adequate climates and advanced agricultural techniques. These savings play an even larger role (87%) in water savings from China’s VWT than they do in the savings from international VWT [36% (7)].
Focusing on China’s domestic food trade alone, we find that the network is efficient in saving green water (5.9 km3), but contributes to a significant loss of blue water resources (3.1 km3). This means that irrigation-intensive provinces tend to export to relatively more rainfed ones (using less irrigation and more rainwater per unit crop). This is particularly worrisome for the country, as blue water resources (e.g., rivers, reservoirs, aquifers) are becoming increasingly scarce or polluted (1, 2). Recently, this threat to water availability and quality triggered grand water projects, such as very large dams and canals [e.g., South–North Water Transfer, which has the opposite direction as most VWT flows, but does not compensate them (12)]. However, because most of water’s economic value is in the industrial and residential sectors rather than in agriculture, the government has neglected some required maintenance to irrigation systems across the country (2). Our findings support the urgency to implement water-saving means in agriculture, which might involve trade mechanisms.
The losses of blue water through domestic trade may be explained by the fact that large producers rely widely on irrigation. Indeed, some top exporting provinces have relatively low water use productivity (i.e., VWC higher than national average), such as Inner Mongolia for corn and soy production (with 58% of blue water for corn and 45% for soy), Heilongjiang for rice (with 40% of blue water), and Hebei for pork (33% of blue water) (Fig. 2). These provinces might be targets for agricultural policies that would improve water-use efficiency. However, in the case of wheat, top exporting provinces (Henan, Shaanxi, and Anhui) are relatively more water efficient than others (SI Appendix, Fig. S1), which is reflected in the water savings associated with China’s domestic wheat trade (Fig. 4A).
Domestic production of corn should also be a focus for trade and agricultural policies. Although Inner Mongolia is both a top corn exporter and a province that relies largely on irrigation to produce this crop (58% of VWC from blue water; Fig. 2A), other top corn exporters—Jilin and Shaanxi—use much less blue water resources (10% and 29%, respectively; Fig. 2A). Thus, it seems that a reorganization of corn production and trade, or an improvement in water-use efficiency targeted at corn in Inner Mongolia, would be important in reducing national water use.
Both a reorganization of crop trade into a more water-efficient system (i.e., with trade flows from relatively more water-efficient provinces to less efficient provinces) and improvements in local agricultural water productivity (i.e., reduction of provincial crops’ VWC) may help reduce the national water use in agriculture and increase the food supply. The latter option also carries resiliency benefits by enabling the national food supply to rely upon multiple production areas. A balance of both measures thus would be required to reduce the national water use in agriculture while avoiding an excessively geographically centralized agricultural system. Besides, possible reorganization of crop trade is limited by factors other than water, such as cropland availability and food self-sufficiency policies. However, for feed crops in particular (e.g., soybeans), foreign import restrictions—aimed at ensuring self-sufficiency—are likely to be weaker than for staple crops.
Reducing provincial VWC requires improving both water-use efficiency and crop yields. China’s crop yields have improved significantly in the past decades [e.g., corn yield per unit area nearly doubled since 1983 (FAO, http://faostat3.fao.org)], but some “yield gaps” remain to be filled. In their global study, Foley et al. (19) found that although many Chinese cornfields have reached the yield ceiling, some large areas remain nutrient limited, and a few are limited by both nutrient and water. However, Foley et al. also found that most Chinese croplands have excess nitrogen (up to 100 kg/ha), suggesting that nitrogen use efficiency and distribution can be greatly improved. If higher yields are achieved this way, water use would effectively decrease. Our study suggests locations where these improvements are most needed. China’s corn yields increased in the 1985–2005 period but not as fast as yields in Argentina or Brazil. Moreover, the northeastern provinces of China grow a large part of their crops for nondirect human uses, such as animal feed and biofuels. This is also the case in a few regions of the world: the midwestern United States, northwestern Europe, and some parts of Brazil and Argentina. A significant amount of food calories might be gained by diverting from these secondary uses (19), which might be another option to reduce water use.
We have shown that China’s interprovincial VWT network is highly connected and presents a relatively homogeneous strength distribution (108 − 1010 m3/y). Some provinces stand out as large players, but all of them trade virtual water to a meaningful extent, so the dominance of top players is not as strong as that of the top trading countries in the international VWT network (e.g., the United States, Brazil, or China).
China’s domestic food trade is efficient in terms of green water resources but inefficient regarding blue water resources. Indeed, domestic wheat trade saves both blue and green water at the national level, but domestic trade of corn loses more blue water (about 8 km3/y).
International imports play a major role in China’s VWT network, as well as in the associated savings, especially imports of soy (blue global water savings, 21 km3/y; total global water savings, 41 km3/y). Chinese water savings from foreign imports (at the national scale) actually are even greater than the global water savings (at the world scale), because foreign imported soy does not require any use of China’s water resources.
Corn production and trade at the domestic level might be a target for improvements and might contribute significantly to reducing national water use for irrigation. Specific provinces also might be targets for improvements of water-use efficiency: provinces that export large quantities of crops while relying significantly on irrigation, such as Inner Mongolia—which is the largest corn exporter and uses a great deal of irrigation—and the northeastern provinces (e.g., Heilongjiang for rice and Hebei for pork). These assessments rely on our scientific findings, and other important agricultural policy aspects, such as land and water rights, are beyond the scope of the present study.
These findings have important implications for trade and agricultural policy in China. They constitute an essential input for designing policies (e.g., targeted investment in agricultural research and development) and provide a framework for analyzing how these policies might change China’s VWT network and irrigation use in the near future.
Materials and Methods
In China’s VWT network, each node represents a province or the rest of the world (ROW), and each link between a pair of nodes is directed by the direction of trade and weighted by the volume of virtual water involved in the traded commodities. The ROW node can be linked directly only with the four main trading harbor provinces of Guangdong, Shanghai, Tianjin, and Liaoning.
We use two main pieces of information to construct the VWT network: the detailed interregional food trade, downscaled to the interprovincial level, and the VWC of each commodity in all provinces. We build the VWT (kilograms of water) network by multiplying the traded volume of a specific commodity (kilograms of product) by the VWC of this commodity (kilograms of water per kilograms of product) in the province of export.
The interregional trade of agricultural products was obtained from the CHINAGRO economic model (15) for four major crops (corn, rice, soybean, and wheat) and three livestock products (ruminant, pork, and poultry). The comprehensive model is a 17-commodity, eight-region general equilibrium welfare model. It comprises six income groups per region, with farm supply represented at the level of 2,433 administrative units (virtually all counties), and accommodates for every county outputs of 28 products and 14 land use types in cropping and livestock production. Consumption is depicted at the regional level, separately for the urban and rural populations, and domestic trade is interregional (SI Appendix). We use simulations of 2005 trade flows, a year for which the model has been calibrated with available data.
We apply a linear programming optimization procedure (20) to downscale the interregional trade matrices to interprovincial trade matrices by minimizing the total cost of trade for each commodity (see details in SI Appendix). The optimization constraints ensure the consistency with interregional trade simulated by CHINAGRO and the balance of commodity supply and demand in each province (involving production, consumption, storage change, other uses, and trade flows), including foreign and domestic goods. In addition, foreign commodities appear in each province trade balance, but we allow their net export to be no larger than China’s foreign import, whereas net export of domestic commodities is bounded by the local production. Finally, international trade flows through the four harbors (in Shanghai, Tianjin, Liaoning, and Guangdong) is imposed exogenously, based on reported data (21).
The VWC (kilograms of water per kilograms of product) of raw crops is defined as the evapotranspiration (ET) during a cropping period (kilograms of water per square meter) divided by the crop yield (kilograms of crop per square meter). It thus accounts for crop water consumption. The VWC of unprocessed livestock products is defined as water consumption per head of livestock (kilograms of water per head)—involving feed’s VWC and drinking and cleaning water—divided by the livestock production per head (kilograms of meat per head) (see details in SI Appendix). The VWC value of each commodity was calculated by using provincial crop yield estimates from CHINAGRO (15) (for rainfed and irrigated lands) and ET simulated with the H08 global hydrological model (16, 17). The ET simulation used the Global Meteorological Forcing Dataset (22), which cover the whole globe at 0.5° spatial resolution, from 1948 to 2008 at a daily interval; the average from 2002 to 2007 was used in this study. For specific crops, the rainfed and irrigated harvested area (23) were fixed circa 2000, for which detailed data are available. The VWT flows corresponding to direct international imports and to domestic trade of foreign commodities are obtained by multiplying the trade volumes by the VWC of the corresponding commodity in the ROW. We estimate this foreign VWC as an average of the VWC in China’s trade partners, weighted by the share of each country in Chinese imports that year (FAO, http://faostat3.fao.org).
Global water savings (WS) from a trade relationship represent the amount of water that is saved (if WS > 0) or lost (if WS < 0) by trade, compared with an autarky situation. The global water savings through trade of a local commodity x from an exporting province i to an importing province j are defined (6) as
| [1] |
and water savings from the trade of a foreign commodity from province i to j, because x actually is made abroad (in the ROW), are defined as
| [2] |
where the subscripts i, j, k, and ROW correspond to the exporting province, the importing province, other provinces, and the ROW, respectively. and are the volumes traded from i to j of commodity x locally or internationally produced, respectively. VWCj,x is the VWC of commodity x in province j, and VWCROW,x is a weighted average of VWC of x in international trade partners. Note in Eq. 2 that only the net import of foreign goods is considered to avoid double counting due to re-export.
We compute the global water savings for all trade relationships and aggregate WS values by the commodity’s base product (corn, rice, soy, wheat, ruminant, pork, and poultry) as follows:
| [3] |
where (i,j) corresponds to all pairs of nodes, including 31 provinces and the ROW.
Supplementary Material
Acknowledgments
C.D. acknowledges the support of the Science, Technology and Environmental Policy (STEP) Fellowship and the Hack Graduate Award from Princeton Environmental Institute, and the support of the Global Systemic Risk Fellowship from Princeton Institute for International and Regional Studies. H.Q. acknowledges the support of the National Natural Science Foundation of China (71222302, 71073154) and the support of the Newton Fellowship, United Kingdom. The funding support of the School of Engineering and Applied Sciences, the Global Collaborative Networks Fund, and the Council for International Teaching and Research of Princeton University is gratefully acknowledged.
Footnotes
The authors declare no conflict of interest.
This article contains supporting information online at www.pnas.org/lookup/suppl/doi:10.1073/pnas.1404749111/-/DCSupplemental.
References
- 1.Wada Y, van Beek LPH, Bierkens MFP. Nonsustainable groundwater sustaining irrigation: A global assessment. Water Resour Res. 2012;48:W00L06. [Google Scholar]
- 2.Liu J, et al. Water conservancy projects in China: Achievements, challenges and way forward. Glob Environ Change. 2013;23(3):633–643. [Google Scholar]
- 3.Wang J, et al. China’s water–energy nexus: Greenhouse-gas emissions from groundwater use for agriculture. Environ Res Lett. 2012;7(1):014035. [Google Scholar]
- 4.Economy E. The River Runs Black: The Environmental Challenge to China’s Future. Ithaca, NY: Cornell Univ Press; 2010. [Google Scholar]
- 5.Hubacek K, Guan D, Barrett J, Wiedmann T. Environmental implications of urbanization and lifestyle change in China: Ecological and water footprints. J Clean Prod. 2009;17(14):1241–1248. [Google Scholar]
- 6.Chapagain AK, Hoekstra AY, Savenije HHG. Water saving through international trade of agricultural products. Hydrol Earth Syst Sci. 2006;10:455–465. [Google Scholar]
- 7.Dalin C, Konar M, Hanasaki N, Rinaldo A, Rodriguez-Iturbe I. Evolution of the global virtual water trade network. Proc Natl Acad Sci USA. 2012;109(16):5989–5994. doi: 10.1073/pnas.1203176109. [DOI] [PMC free article] [PubMed] [Google Scholar]
- 8.Liu J, Zehnder AJB, Yang H. Historical trends in China’s virtual water trade. Water Int. 2007;32(1):78–90. [Google Scholar]
- 9.Shi J, Liu J, Pinter L. Recent evolution of China’s virtual water trade: Analysis of selected crops and considerations for policy. Hydrol Earth Syst Sci Discuss. 2013;10:11613–11641. [Google Scholar]
- 10.Dalin C, Suweis S, Konar M, Hanasaki N, Rodriguez-Iturbe I. Modeling past and future structure of the global virtual water trade network. Geophys Res Lett. 2012;39:L24402. doi: 10.1073/pnas.1203176109. [DOI] [PMC free article] [PubMed] [Google Scholar]
- 11.Cao X, Wu P, Wang Y, Zhao X, Li S. Application of virtual water trade theory in inter-regional grain allocation and transportation in China. Afr J Biotechnol. 2011;10(80):18463–18471. [Google Scholar]
- 12.Ma J, Hoekstra AY, Wang H, Chapagain AK, Wang D. Virtual versus real water transfers within China. Philos Trans R Soc Lond B Biol Sci. 2006;361(1469):835–842. doi: 10.1098/rstb.2005.1644. [DOI] [PMC free article] [PubMed] [Google Scholar]
- 13.Global Water System Project 2008. Digital Water Atlas. Map 7: Water Stress (V1.0) Available at http://atlas.gwsp.org. Accessed January 1, 2014.
- 14.Fischer G, et al. 2008. Global Agro-ecological Assessment for Agriculture IIASA (International Institute for Applied Systems Analysis, Schloss Laxenburg, Austria), IIASA Research Rep RR-02-002. [Google Scholar]
- 15.Fischer G, et al. 2007. China’s agricultural prospects and challenges: Report on scenario simulations until 2030 with the Chinagro welfare model covering national, regional and county level. Available at http://webarchive.iiasa.ac.at/Research/LUC/External-Chinagro/SOW-VU-CHINAGRO-prospects_challenges.pdf. Accessed June 1, 2014.
- 16.Hanasaki N, et al. An integrated model for the assessment of global water resources—Part 1: Model description and input meteorological forcing. Hydrol Earth Syst Sci. 2008;12:1007–1025. [Google Scholar]
- 17.Hanasaki N, et al. An integrated model for the assessment of global water resources—Part 2: Applications and assessments. Hydrol Earth Syst Sci. 2008;12(3-4):1027–1037. [Google Scholar]
- 18.Konar M, et al. Water for food: The global virtual water trade network. Water Resour Res. 2011;47:W05520. [Google Scholar]
- 19.Foley JA, et al. Solutions for a cultivated planet. Nature. 2011;478(7369):337–342. doi: 10.1038/nature10452. [DOI] [PubMed] [Google Scholar]
- 20.MathWorks 2012. MATLAB, The Language of Technical Computing (MathWorks, Natick, MA)
- 21.National Bureau of Statistics of China . China Statistical Yearbook. Beijing: China Statistics Press; 2006. [Google Scholar]
- 22.Sheffield J, Goteti G, Wood EF. Development of a 50-yr high-resolution global dataset of meteorological forcings for land surface modeling. J Clim. 2006;19(13):3088–3111. [Google Scholar]
- 23.Portmann FT, Siebert S, Doll P. MIRCA2000—global monthly irrigated and rainfed crop areas around the year 2000: A new high-resolution data set for agricultural and hydrological modeling. Global Biogeochem Cycles. 2010;24:GB1011. [Google Scholar]
- 24.Krzywinski M, et al. Circos: An information aesthetic for comparative genomics. Genome Res. 2009;19(9):1639–1645. doi: 10.1101/gr.092759.109. [DOI] [PMC free article] [PubMed] [Google Scholar]
Associated Data
This section collects any data citations, data availability statements, or supplementary materials included in this article.