

Abstract
Background
The genetic polymorphisms of glutathione S-transferase (GSTs) have been suspected to be related to the development of lung cancer while the current results are conflicting, especially in the Chinese population.
Methods
Data on genetic polymorphisms of glutathione S-transferase Mu 1 (GSTM1) from 68 studies, glutathione S-transferase theta 1 (GSTT1) from 17 studies and GSTM1-GSTT1 from 8 studies in the Chinese population were reanalyzed on their association with lung cancer risk. Odds ratios (OR) were pooled using forest plots. 9 subgroups were all or partly performed in the subgroup analyses. The Galbraith plot was used to identify the heterogeneous records. Potential publication biases were detected by Begg's and Egger's tests.
Results
71 eligible studies were identified after screening of 1608 articles. The increased association between two vital GSTs genetic polymorphisms and lung cancer risk was detected by random-effects model based on a comparable heterogeneity. Subgroup analysis showed a significant relationship between squamous carcinoma (SC), adenocarcinoma (AC) or small cell lung carcinoma (SCLC) and GSTM1 null genotype, as well as SC or AC and GSTT1 null genotype. Additionally, smokers with GSTM1 null genotype had a higher lung cancer risk than non-smokers. Our cumulative meta-analysis demonstrated a stable and reliable result of the relationship between GSTM1 null genotype and lung cancer risk. After the possible heterogeneous articles were omitted, the adjusted risk of GSTs and lung cancer susceptibility increased (fixed-effects model: ORGSTM1 = 1.23, 95% CI: 1.19 to 1.27, P<0.001; ORGSTT1 = 1.18, 95% CI: 1.10 to 1.26, P<0.001; ORGSTM1-GSTT1 = 1.33, 95% CI: 1.10 to 1.61, P = 0.004).
Conclusions
An increased risk of lung cancer with GSTM1 and GSTT1 null genotype, especially with dual null genotype, was found in the Chinese population. In addition, special histopathological classification of lung cancers and a wide range of gene-environment and gene-gene interaction analysis should be taken into consideration in future studies.
Introduction
Lung cancer is the most common malignancy in the world and the leading cancer in males, accounting for 17% of the total new cancer cases and 23% of the total cancer deaths [1]–[3]. The burden of lung cancer mortality in females in developing countries is up to 11% of the total female cancer deaths [2]. In the United States, there were 226,160 newly diagnosed cases and 160,340 deaths due to lung cancer in 2012 [4]. In China, although females have a lower prevalence of smoking, there is still higher lung cancer rates (21.3 cases per 100,000 females) than those in European countries [5], due to indoor air pollution, cooking fumes, occupational and environmental pollutions. Besides, due to the incurable nature and less than a five-year survival rate (only 16%), lung cancer has attracted a huge attention across the whole world [6].
Lung cancer can be divided into several types by pathological classification, such as squamous cell carcinoma (SC), adenocarcinoma (AC) and large or small cell carcinoma. It is also classified as small cell lung carcinoma (SCLC) and non-small cell lung carcinoma (NSCLC), which accounts for about 85% of all lung cancer [7]. Given the possible relapses in the local respiratory system and the metastasis in other systems after the classical treatments of radical surgery, immunotherapy has provided an innovative method for lung cancer treatment in the past 30 years to enhance the clinical outcome, alleviate the disease burden, prevent recurrences and attenuate toxicity [8]–[14].
Tobacco smoking has clearly been demonstrated to be a strong exogenous factor for lung cancer risk [15]–[17]. Polycyclic aromatic hydro-carbons (PAHs) and the tobacco-specific nitrosamine 4-(methylnitrosamino)-1-(3-pyridyl)-1-butanone (NNK) are considered to be the major carcinogens, which can interact with DNA and cause the formation of DNA adducts [17]. In the meantime, free radicals from tobacco smoking can induce oxidative damage to lung tissues, and also damage DNA, which provides another clue to lung cancer development [18]–[21]. In this process, DNA was damaged by superoxide anions (O2 −) and hydroxyl radicals (OH−) and was repaired by antioxidant enzymes. This balance can be broken by both environmental and genetic factors. Available molecular epidemiology studies have shown that genetic polymorphisms play a major role in the progress of carcinoma [22], [23]. Among these studies, genetic variants of carcinogen-metabolizing enzymes have received much attention, especially glutathione S-transferase (GST) genes and cytochrome P450 genes. The cytochrome P450 (CYP450) family, as the first-pass metabolism enzymes, plays an important role in many physiological and biochemical reactions in the human body, and participates in the metabolic process of endogenous and exogenous substrates (biosynthesis and degradation) [24]. Toxic materials like benzo[a]-pyrene and other PAHs could be metabolized to oxygenated intermediates and then degraded sequentially to lower toxic or non-toxic substances by the second-pass metabolic enzymes such as the glutathione S-transferases (GSTs) family [25], [26]. Therefore, the polymorphisms of both gene families might affect the metabolism of tobacco toxicants in lung and finally influence the advancement of cancer.
The GSTs family can detoxify environmental carcinogens and toxins, oxidative stress products, and several covalent conjugated electrophilic compounds [27], [28]. GSTM1 and GSTT1 are two critical GSTs family genes, separately encoded mu and theta GST classes and located in 1p13.3 and 22q11.23 in the human chromosome, respectively. The common GSTM1 polymorphisms include three alleles, GSTM1*A, GSTM1*B and GSTM1*0, where GSTM1*0 means a null mutation [29]. Another gene, GSTT1 is polymorphic with two alleles (GSTT1*1 and GSTT1*0). The homozygous combinations of GSTM1*0 allele as a null genotype could lead to a functional deficiency [29], as well as GSTT1*0 [30], while other genotypes remain functional [31]–[34].
Most molecular epidemiologic studies suggested an association between GST genetic polymorphisms and lung cancer risk, especially when deletion of GSTM1 is observed in the Asian population [35]–[44]. However, the current research results are conflicting, especially in the Chinese population [36], [38], [42], [44]–[46]. Due to the difference in sample size, smoking status and environmental factors, etc., conflicting or vague results were found in these studies.
To identify the association of two vital GST genetic polymorphisms (GSTM1 and GSTT1) with lung cancer risk, an updated systematic meta-analysis was performed in this study by selecting all eligible studies in the Chinese population.
Methods
1. Literature research strategy
A computer-based literature search was carried out in EMBASE, PubMed, ISI Web of Knowledge, Chinese Biomedical Database (CBM), VIP database, Chinese National Knowledge Infrastructure (CNKI), and Wanfang Data (the latest research retrospect until October 2013) to collect articles related to the association of GSTM1 and/or GSTT1 polymorphisms and lung cancer susceptibility in the Chinese population. Additionally, relevant references of the articles were also collected. We also searched two websites (http://www.baidu.com and http://scholar.google.com) to identify additional eligible studies. MeSH terms (“glutathione S-transferase” or “GST” or “GSTM1” or “GSTT1”) and (“lung carcinoma” or “lung cancer” or “lung neoplasms”) and (“China” or “Chinese” or “Taiwan”) were used in the databases. Eligible research articles not captured by the above research strategies were further searched by bibliographies without language limitation.
2. Inclusion and exclusion criteria
Inclusion criteria: (1) individuals or samples in all eligible studies were examined and diagnosed by polymerase chain reaction (PCR), pathologic diagnosis or other methods to get a full picture of GST genetic polymorphisms and lung cancer types; (2) Chinese living in China; (3) articles providing raw data including odds ratio (OR) with 95% confidence interval (CI) and respective variance, or the relevant information could be calculated.
Exclusion criteria: (1) Chinese out of China; (2) raw data not available; (3) when there were multiple publications by the same researchers, only the latest or the largest population study was adopted; (4) meeting abstract, case reports, editorials, newsletter and review articles were excluded.
3. Data extraction and synthesis
To decide inclusively or exclusively, articles were identified by three independent work groups (group 1-Kui Liu and Lu Zhang; group 2-Xia Yue and Xialu Lin; group 3-Jian Chen and Guixiu Jin) using a standardized data extraction form designed by ourselves. Discrepancies among three groups were further discussed by all parties. If consenses was still not reached, another group (group 4-Huiqin Wang and Qi Zhou) would make the final decision. Firstly, the titles and abstracts of all studied articles were screened to determine their relevance. If the titles and abstracts were ambiguous, full articles would be investigated. In order to make full use of the available data, it was counted as two separated studies if two different control groups were employed in the same article, such as two different controls versus the same control. If there were more than one region to be investigated in one article, information for each region was also counted as a separated study. Information collected from each eligible study included: first author, year of publication, region, study time, pathologic diagnosis, source of control, characteristics of cases and controls, genotype frequency of null GSTM1, null GSTT1, and null of both genotypes (Table 1). Hardy Weinberg Equilibrium(HWE) argues that genotype frequencies at any locus are a simple function of allele frequencies under the precondition of no migration, mutation, natural selection, and assortative mating [47]. HWE test was usually assessed in the control group [48]. Furthermore, details of eligible studies used for detecting GSTs genotype, combined evaluation of other genes, HWE test results of CYP1A1 polymorphisms, the percent of null GSTs genotype in the control groups, smoking status, study type and quality score were also elicited (Table 2). Study types also consisted of epidemiological design and non-epidemiological design. Epidemiological designs were comprised of case-control, cohort and nested case-control studies, all of which must satisfy three conditions for both cases and controls: explicit diagnosis of status (histology or cytology), clear description of the age period, and the same source population [49]. Those not meeting the conditions were considered non-epidemiological designs. The quality score of epidemiological studies was evaluated by Newcastle-Ottawa Scale (NOS).
Table 1. Characteristics of the studies related to the effects of GSTs genetic polymorphisms and lung cancer risk.
| No. | First author(ref.) | Region | Study time | Pathologic diagnosis¶ | Sourceof controls | Characteristic of Cases | Characteristic of Controls | Null GSTM1/Group number | Null GSTT1/Group number | Dual Null/Group number | |||
| case | control | case | control | case | control | ||||||||
| 1* | Liu DZ 2012 [54] | Heilongjiang (Harbin) | 2010–2012 | ALL | Population | 360 cases in Han population (142 SC, 140 AC, 37 SCLC, 41 others) | 360 cancer-free controls matched by gender and age in Han population | 145/360 | 107/360 | ||||
| 2 | Wang N 2012 [55] | Henan | 2008.2–2008.8 | ALL | Population | 209cases(103 SC, 69 AC, 28 SCLC and 9 others | 256 controls, comparable in age and gender in Han population | 122/209 | 113/256 | 90/209 | 100/256 | ||
| 3* | Li WY 2012 [56] | Beijing | 2005.8–2006.6 | ALL | Population | 217 cases (NSCLC) | 198 healthy controls with comparable in age and gender | 127/217 | 93/198 | ||||
| 4 | Chen CM 2012 [57] | Zhejiang | NA | ALL | Population | 200 cases (59 AC, 104SC, 37 other NSCLC) | 200 controls without any tumor with comparable in gender and age | 123/200 | 110/199 | ||||
| 5 | Yao ZG 2012 [58] | Beijing | 2006.6–2010.6 | ALL | Population | 150 cases including 97 males and 53 females | 150 healthy controls including 89 males and 61 females | 96/150 | 68/150 | ||||
| 6 | Liu JN 2012 [59] | NA | NA | NA | Population | 100 cases including 29 SC, 40 AC, 18SCLC and 13 mixed style | 135 healthy controls with comparable in gender, age and smoking status in Han population | 57/100 | 56/135 | ||||
| 7 | Han RL 2012 [60] | InnerMongolia | NA | ALL | Hospital | 128 cases | 214 hospital controls without tumors, rheumaticdisease and pulmonary disease | 79/128 | 89/214 | ||||
| 8* | Jin YT 2011[61] | Anhui | 2006–2007 | ALL | Hospital | 154 cases (NSCLC) | 154 controls without any tumors and chronic respiratory disease, matched by age, gender and ethnicity. | 64/154 | 58/154 | ||||
| 9 | Ai C 2011 [62] | NA | 2007.5–2010.5 | ALL | Population | 50 cases (38 males) | 50 controls with comparable in gender, age, ethnicity, smoking status and occupational group | 36/50 | 23/50 | ||||
| 10 | Zhang JQ 2011 [63] | Yunnan (Xuanwei) | NA | ALL | Population | 50 cases | 50 controls, comparable in gender, age, residential township, weight and combustion method of coal | 34/50 | 22/50 | ||||
| 11 | Du GB 2011 [64] | Sichuan | NA | ALL | Hospital | 125 cases (57 SC, 31 AC, 37 others) | 125 controls with comparable in age and gender | 73/125 | 71/125 | ||||
| 12 | Li Y2011 [65] | Henan (Zhengzhou) | 2003–2006 | ALL | Population | 103 cases including 64 SC, 13 AC,21SCLC and 5 others | 138 healthy controls, comparable in age and gender | 63/103 | 61/138 | ||||
| 13 | Bai TY 2011[66] | InnerMongolia | 2006–2009 | ALL | Hospital | 106 cases | 250 controls without tumors, rheumaticdisease and pulmonary disease | 50/106 | 111/250 | ||||
| 14* | Jin YT 2010[67] | Anhui | 2005.6–2007.12 | ALL | Hospital | 150 cases (83 SC, 33AC, 34 mixed types) | 150 controls matched by age and gender. | 95/150 | 79/150 | ||||
| 15 | Zheng DJ 2010[68] | Tianjin | 2008.3–2009.7 | ALL | Population | 265 cases including 120 SC, 99AC, 23 SCLC and 23 others | 307 healthy controls without respiratory disease and family history of lung cancer, comparable in age and gender | 150/265 | 175/307 | ||||
| 16 | Zhu XX 2010[69] | Hunan | 2009.3–2009.12 | ALL | Population | 160 female cases (19SC, 109AC, 17SCLC, 15 others) | 160 healthy female controls, comparable in age and residential township | 93/160 | 72/160 | ||||
| 17 | Fan J 2010 [70] | Guangxi | 2009.3–2010.5 | ALL | Population | 58 cases | 60 healthy controls, comparable in age and residential township | 40/58 | 33/60 | 38/58 | 29/60 | 29/58 | 20/60 |
| 18 | Chang FH 2009 [71] | InnerMongolia | NA | NA | Population | 263 cases | 263 healthy controls matched by age, gender and ethnicity | 152/263 | 126/263 | ||||
| 19 | Chen H 2008 [72] | Anhui | 2005.9–2007.12 | ALL | Population | 158 cases (86 SC, 36AC, 36 other) | 455 controls with comparable in gender and age | 99/158 | 246/454 | ||||
| 20 | Liu Q 2008[73] | Shandong | 2006.3–2007.5 | PARTIAL | Population | 110 cases (70 males) including 68 SC and 1 AC, 11 others | 125 controls (82 males) matched by age and gender | 66/110 | 57/125 | ||||
| 21 | Qi XS 2008 [74] | Gansu | 2005–2007 | ALL | Hospital | 53 cases (27SC, 3 AC, 230 others) | 72 controls with comparable in gender and smoking status | Δ34/53 | Δ41/72 | 17/53 | 27/72 | 10/53 | 17/72 |
| 22 | Xia Y 2008 [75] | Gansu (Qinyang) | 2005–2007 | ALL | Hospital | 58 cases (age in 40–75 years, 52 males) | 116 controls (age in 38–75 years, 104 males) | 34/58 | 61/116 | ||||
| 23 | Gu YF 2007[76] | Beijing | 2000.11–2005.6 | ALL | Hospital and Population | 279 cases (84 SC, 110 AC, 45 SCLC and others 40) | 684 (575 healthy controls and 109 benign pulmonary disease cases) equally with comparable in age, gender and ethnicity | 164/279 | 325/684 | ||||
| 24 | Wang YS 2007 [77] | Anhui | NA | ALL | Population | 47 NSCLC (31 SC, 7 AC, 9 others) | 94 healthy controls (84 males) with comparable in age and gender | 27/47 | 50/94 | ||||
| 25 | Lei FM 2007 [78] | Sichuan (Chengdu) | 2004.1–2006.1 | NA | Population | 42 cases (age 64.7±11.03 years) | 103 controls (age 50.8±7.02 years) with comparable in residential township, gender and occupation | 24/42 | 57/103 | ||||
| 26 | Chang FH 2006 [79] | InnerMongolia | NA | ALL | Hospital | 163 cases (92 males) | 163 controls without tumors, rheumaticdisease and pulmonary disease, matched by age, gender, residential township | 106/163 | 78/163 | ||||
| 27* | Chen HC 2006 [80] | Hunan | NA | ALL | Population | 97non-smoker cases (42 males) including 51 SC, 43 AC, 3 unknown) | 197 healthy controls (96 males) matched by age and gender in non-smokers | 60/97 | 89/197 | 59/97 | 85/197 | 36/97 | 44/197 |
| 28 | Li Y 2006 [81] | Henan | 2003.3–2003.8 | ALL | Population | 98 cases including 64 SC, 13 AC and 21 SCLC | 136 controls, comparable in age and gender | 60/98 | 60/136 | ||||
| 29 | Yao W 2006 [82] | Henan (Zhengzhou) | NA | ALL | Population | 77 cases including 42 SC, 24 AC and 11 others | 107 healthy controls (57 males) | 45/77 | 45/107 | 44/77 | 54/107 | 26/77 | 25/107 |
| 30 | Qian BY 2006 [83] | Tianjin | 2004.3–2005.3 | ALL | Population | 108 cases in han population in Tianjin city | 108 controls (66 males) with comparable in age and occupational status | 69/108 | 53/108 | ||||
| 31 | Wang QM 2006 [84] | NA | NA | PARTIAL | Population | 56 cases (age 64.86±12.53 years, 50 males) | 42 controls (age 59.12±12.51 years, 38 males) | 40/56 | 19/42 | ||||
| 32 | He DX 2006[85] | Yunnan (Kunming) | NA | NA | Population | 61 cases (age in 40–60 years) | 46 healthy controls (age in 40–55 years) | 33/61 | 29/46 | ||||
| 33* | Chan EC 2005 [86] | NA | NA | ALL | Population | 75 cases (31 SC and 44 AC) | 162 healthy controls without history of pulmonary disease, matched by age and gender | 31/75 | 91/162 | ||||
| 34 | Yuan TZ 2005 [87] | Sichuan | NA | ALL | Population | 150 cases (70 SC, 61 AC, other 19) | 152 controls with comparable in age and gender in Han population | 82/150 | 58/152 | ||||
| 35 | Li DR 2005 [88] | Sichuan | 2001.7–2004.2 | ALL | Hospital | 99 NSCLC cases (age 58.4±10.6 years,74 males) including 41 SC, 42 AC, 16 mixed style | 66 controls (age 42.4±14.9 years, 37 males) with lung benign disease. | 57/99 | 27/66 | ||||
| 36 | Ye WY 2005 [89] | Guangdong (Guangzhou) | NA | ALL | Hospital | 58 cases | 62 controls without tumor and respiratory disease, comparable in age and gender | 23/58 | 33/62 | ||||
| 37* | Chou YC 2005 [90] | Taiwan | 1990.7–2000.12 | NA | Population | 30 cases | 60 cancer-free controls matched for gender, age and residential township | 18/30 | 39/60 | ||||
| 38 | Liang GY 2004[91] | Jiangsu (Nanjing) | NA | ALL | Hospital | 152 cases (107 males) including 63 SC and 89 AC | 152 controls without lung disease matched for gender, age (±5) | 82/152 | 79/152 | 85/152 | 58/152 | ||
| 39* | Yang XHR 2004 [92] | Heilongjiang (Shenyang) | 1985.9–1987.9 | ALL | Population | 200 cases | 144 healthy controls, matched by age | 108/186 | 75/139 | ||||
| 40* | Moira CY 2004 [93] | Hong Kong | 1999.7–2001.6 | ALL | Population | 229 cases (127 AC and 38 SC) | 197 healthy controls, significantly younger | 130/229 | 117/197 | 143/229 | 102/197 | ||
| 41* | Lan Q 2004 [94] | Yunnan (Xuanwei) | 1995.3–1996 | NA | Population | 122 cases | 122 controls matched by age, gender and smoking status | 82/122 | 60/122 | 73/122 | 64/122 | ||
| 42 | Gu YF 2004 [95] | Beijing | NA | ALL | Hospital and Population | 180 cases (124 males) including 52 SA, 66 AC, 29 SCLC, 11 mixed style and 22 others | 224 controls (117 controls with lung benign disease and 107 healthy controls), equally comparable in gender, age, ethnicity | 101/180 | 102/224 | ||||
| 43 | Dong CT 2004 [96] | Sichuan | 2001.1–2001.11 | ALL | Hospital | 82 cases | 91 respiratory system disease controls without tumor, comparable in age, gender and ethnicity | 48/82 | 36/91 | ||||
| 44 | Luo CL 2004 [97] | Guangzhou | NA | ALL | Population | 63 cases (49 males) including 24 SC, 28 AC, 7 SCLC and 4 others | 47 healthy controls, comparable in age, gender and ethnicity | 45/63 | 24/47 | ||||
| 45 | Cao YF 2004 [98] | Hunan | NA | ALL | Population | 104 cases | 205 controls, comparable in age, gender | 65/104 | 95/205 | 69/104 | 87/205 | 43/104 | 46/205 |
| 46 | Chen SD 2004 [99] | Guangdong | 2000–2001 | NA | Hospital | 91 cases | 91 controls, comparable in age and gender | 56/91 | 51/91 | ||||
| 47 | Huang XH 2004 [100] | Guangdong (Guangzhou) | 2000.10–2002.1 | ALL | Hospital and Population | 91 cases including 54 SC, 31 AC and 6 SCLC | 138 control (91 hospital patients and 47 healthy controls), matched by age, gender, and residence | 56/91 | 73/138 | ||||
| 48 | Ye WY 2004 [101] | Guangdong (Guangzhou) | 2000.10–2002.1 | ALL | Hospital | 58 cases (age in 35–85 years, 38 males and 20 females) | 62 controls without respiratory disease and tumor (age in 35–85 years, 42 males),comparable in gender and age | 35/58 | 29/62 | ||||
| 49* | Wang JW 2003 [102] | Beijing | 1998–2000 | ALL | Population | 112AC cases | 119 healthy controls matched for age and gender | Δ69/112 | Δ60/119 | 53/112 | 54/119 | 36/112 | 29/119 |
| 50* | Wang JW 2003 [103] | Beijing/Tianjin | 1998–2000 | ALL | Population | 164 AC cases (112 in Beijing, 52 in Tianjin) | 181 cancer-free controls matched for gender and age | 97/164 | 90/181 | ||||
| 51 | Chen LJ 2003 [104] | Anhui (Wuhu) | NA | ALL | Population | 38 cases | 99 healthy controls, comparable in age and gender | 24/38 | 57/99 | ||||
| 52 | Li WY 2003 [105] | Beijing | NA | ALL | Hospital | 217 cases | 200 non-cancer controls, comparable in age, gender and township of residence | 127/217 | 95/200 | ||||
| 53* | Lu WF 2002 [106] | Beijing and surrounding regions | 1997.1–2000.12 | ALL | Population | 314 cases (177 SC and 137 AC) | 320 normal controls, matched for age, gender and smoking status | 158/314 | 155/314 | ||||
| 54a | Qiao GB 2002 [107] | Guangzhou | 1997.1–1999.12 | ALL | Hospital | 213 cases (106 SC, 62 AC, 45 others) | 64 with lung benign disease | 130/213 | 31/64 | ||||
| 54b | Qiao GB 2002 [107] | Guangzhou | 1997.1–1999.12 | ALL | Population | 213 cases (106 SC, 62 AC, 45 others) | 135 healthy cases | 130/213 | 64/135 | ||||
| 55 | Zhang LZ 2002 [108] | Jiangsu (Xuzhou) | 1999.3–2000.10 | ALL | Hospital | 65 cases (age 59.4±8.4 years, 56 males) including 34 SC, 25 AC, 2 SCLC and 4 others | 60 controls (age 55.6±7.5 years, 54 males) | 41/65 | 27/60 | ||||
| 56 | Shi Y 2002 [109] | Hubei | NA | ALL | Hospital | 120 cases | 120 noncancer controls, comparable in age and gender in Han population | 74/120 | 53/120 | ||||
| 57 | Zhang JK 2002 [110] | Guangdong (Guangzhou) | 1999.1–2000.5 | ALL | Population | 42 females cases | 55 healthy females match by age in Han population | Δ28/42 | Δ30/55 | Δ19/42 | Δ21/55 | 12/42 | 10/55 |
| 58 | Zhang JK 2002 [111] | Guangdong (Guangzhou) | 1999.1–2000.5 | ALL | Population | 161 cases | 165 healthy controls, comparable in age and gender | 94/161 | 92/165 | 74/161 | 72/165 | ||
| 59 | Xin Y 2002 [112] | Yunnan | NA | NA | Population | 56 cases | 99 healthy controls | 43/56 | 65/99 | ||||
| 60* | Cheng YW 2001 [113] | Taiwan | NA | NA | Hospital | 62 nonsmoking cases | 20 noncancer controls with lung disease and comparable in age and gender | 25/62 | 10/20 | ||||
| 61* | Chen SQ 2001[114] | Jiangsu | NA | ALL | Population | 106 cases | 106 healthy controls matched for gender and age | 56/106 | 39/106 | ||||
| 62* | Stephanie J London 2000 [115] | Shanghai | 1986.1–1997.3 | PARTIAL | Population | 234 cases | 714 controls matched for age and residential township | 122/232 | 427/710 | 134/232 | 426/710 | 85/232 | 275/710 |
| 63* | Cheng YW 2000 [116] | Taiwan | NA | NA | Hospital | 73 cases | 33 noncancer controls with lung cancer and comparable in age, gender and smoking status | 34/73 | 17/33 | ||||
| 64 | Lan Q 1999 [117] | Yunnan (Xuanwei) | 1994.7–1995.11 | PARTIAL | Population | 86 cases | 86 controls equally comparable in age and gender | 56/86 | 38/86 | 52/86 | 52/86 | ||
| 65a* | Gao Y 1999 [118] | Guangdong (Guangzhou) | 1996.11–1997.3 | ALL | Population | 59 cases (26 AC, 23 SC and 10 mixed style) | 73 healthy controls in Han population matched by age and gender | 34/59 | 36/73 | ||||
| 65b* | Gao Y 1999 [118] | Guangdong (Guangzhou) | 1996.11–1997.3 | ALL | Hospital | 59 cases (26 AC, 23 SC and 10 mixed style) | 59 free-cancer controls without hereditary disease matched by age and gender | 34/59 | 29/59 | ||||
| 66 | Chen SQ 1999 [119] | Jiangsu | NA | NA | Population | 68 cases | 105 healthy controls | 39/68 | 42/105 | ||||
| 67 | Gao JR1998 [120] | Guangdong | 1995.11–1996.4 | ALL | Population | 46 cases | 70 controls equally comparable in age, gender, ethnicity and residential township | 27/46 | 25/70 | ||||
| 68a | Qu YH 1998[121] | Shanghai | NA | NA | Population | 100 female cases (age 60.18±12.18 years) | 95 healthy controls (age 60.48±12.29 years) | 56/100 | 49/94 | ||||
| 68b | Qu YH 1998 [121] | Heilongjiang (Haerbin) | NA | NA | Population | 82 female cases (age 47.99±12.17) | 85 healthy controls (age 47.36±11.17 years) | 46/82 | 45/85 | ||||
| 69* | Sun GF 1997 [122] | Liaoning | 1992.1–1994.12 | ALL | Population | 207 cases including 86 SC, 68 AC and 53 SCLC | 364 controls | 147/207 | 186/364 | ||||
| 70a* | Ge H 1996 [123] | Hong Kong | 1989–1994 | ALL | Population | 98 NSCLC cases (61 males), including 66AC, 26 SCC, 6 others) | 25 healthy controls | 59/89 | 16/25 | ||||
| 70b* | Ge H 1996 [123] | Hong Kong | 1989–1994 | ALL | Hospital | 89 NSCLC cases | 28 bronchiectasis patients | 59/89 | 19/28 | ||||
| 71 | Sun GF 1995 [124] | NA | NA | ALL | Population | 175 cases | 104 healthy controls | 125/175 | 54/104 | ||||
Pathologic diagnosis¶: ALL means that all lung cancer cases were confirmed by pathologic diagnosis; PARTIAL means that partial cases were confirmed by pathologic diagnosis; NA means that relative data were not available in original studies.
SC: Squamous Carcinoma; AC: Adenocarcinoma; SCLC: Small Cell Lung Carcinoma; NSCLC: Non-small-cell Lung Carcinoma. *: Articles published in English.
: These data were omitted because of a larger sample from the same studied population by the same research group.
a/b: A study with two distinct controls encompassed population-based and hospital-based could been analyzed, respectively.
Table 2. The contextual details of subgroup analysis included in this meta-analysis.
| No. | Study | Material used for detecting GSTs genotype | Combined evaluation of other genes | Gene | CYP1A1 (Msp1) HWE | Null GSTs genotype (%) | Non-smokerФ | smoker | Study type | Quality scoreζ | ||
| Case | Control | Case | Control | |||||||||
| 2012 | ||||||||||||
| 1 | Liu DZ et al[54] | WBC | NA | GSTM1 | NA | 29.7 | 42/105 | 52/175 | 103/255 | 55/185 | EG | 8 |
| 2 | Wang N et al[55] | WBC | CYP1A1,mEH, XRCC1 | GSTM1/GSTT1 | YES | 44.1/39.1 | NA | NA | NA | NA | EG | 8 |
| 3 | Li WY et al[56] | WBC | CYP1A1,CYP2E1, CYP2D6 | GSTM1 | YES | 47.0 | 55/96 | 70/135 | 72/121 | 23/63 | EG | 8 |
| 4 | Chen CM et al[57] | WBC | CYP1A1 | GSTM1 | YES* | 55.3 | 34/54 | 47/76 | 89/146 | 63/113 | EG | 7 |
| 5 | Yao ZG et al[58] | WBC | NA | GSTM1 | NA | 45.3 | 29/45 | 38/78 | 67/105 | 30/72 | EG | 8 |
| 6 | Liu JN et al[59] | WBC | NA | GSTT1 | NA | 41.5 | 26/51 | 38/85 | 31/49 | 18/50 | EG | 6 |
| 7 | Han RL et al[60] | WBC | NA | GSTM1 | NA | 41.6 | 26/45 | 54/115 | 60/83 | 35/99 | EG | 5 |
| 2011 | ||||||||||||
| 8 | Jin YT et al [61] | WBC | CYP1A1 | GSTM1 | NO/YES* | 37.7 | OR 95% CI = 0.76(0.18–3.17) | OR 95% CI = 2.11(0.66–6.88) | EG | 6 | ||
| 9 | Ai C et al[62] | WBC | NA | GSTM1 | NA | 46.0 | NA | NA | NA | NA | EG | 8 |
| 10 | Zhang JQ et al[63] | WBC | NA | GSTM1 | NA | 44.0 | 13/22 | 9/24 | 21/28 | 13/26 | EG | 7 |
| 11 | Du GB et al[64] | WBC | NA | GSTM1 | NA | 56.8 | 32/49 | 46/82 | 41/76 | 23/43 | EG | 6 |
| 12 | Li Y et al[65] | cases: BALF cells, controls: WBC | CYP1A1 | GSTM1 | YES/YES* | 44.2 | 20/27 | 28/64 | 43/76 | 33/74 | EG | 7 |
| 13 | Bai TY et al[66] | NA | NA | GSTT1 | NA | 44.4 | 24/63 | 20/71 | 32/76 | 30/40 | NA | 4 |
| 2010 | ||||||||||||
| 14 | Jin YT et al[67] | WBC | CYP1A1 | GSTM1 | NA | 52.7 | 25/37 | 28/63 | 70/113 | 51/87 | EG | 7 |
| 15 | Zheng DJ et al[68] | WBC | NA | GSTM1 | NA | 57.0 | NA | NA | NA | NA | EG | 8 |
| 16 | Zhu XX et al[69] | WBC | CYP1A1 | GSTM1 | YES/YES* | 45.0 | NA | NA | NA | NA | EG | 8 |
| 17 | Fan J et al[70] | WBC | NA | GSTM1 | NA | 55.0 | 23/32 | 22/40 | 17/26 | 11/20 | EG | 7 |
| GSTT1 | NA | 48.3 | 20/32 | 21/41 | 18/26 | 8/19 | EG | |||||
| 2009 | ||||||||||||
| 18 | Chang FH et al[71] | WBC | CYP1A1 | GSTM1 | NA | 47.9 | 60/97 | 101/145 | 92/166 | 25/118 | EG | 7 |
| 2008 | ||||||||||||
| 19 | Chen H et al[72] | WBC | CYP1A1 | GSTM1 | NO | 54.2 | 26/39 | 126/246 | 73/119 | 120/208 | EG | 8 |
| 20 | Liu Q et al[73] | WBC | CYP1A1 | GSTM1 | NO | 45.6 | NA | NA | NA | NA | EG | 8 |
| 21Ψ | Qi XS et al[74] | WBC | NA | GSTT1 | NA | 37.5 | 0/5 | 4/13 | 17/47 | 23/59 | EG | 7 |
| GSTM1 | NA | 56.9 | NA | NA | NA | NA | ||||||
| 22 | Xia Y et al[75] | WBC | CYP1A1 | GSTM1 | YES | 37.5 | NA | NA | NA | NA | EG | 6 |
| 2007 | ||||||||||||
| 23 | Gu YF et al[76] | WBC | CYP1A1,2D6,2E1 | GSTM1 | NA | 47.5 | NA | NA | NA | NA | EG | 7 |
| 24‡ | Wang YS et al[77] | WBC/Adjacent normal tissue | NA | GSTM1 | NA | 53.2 | OR 95% CI = 1.07(0.19–5.96) | OR = 1 | OR 95% CI = 1.57(0.48–5.27) | OR 95% CI = 1.29(0.37–4.68) | EG | 7 |
| 25 | Lei FM et al[78] | WBC | NA | GSTM1 | NA | 55.3 | NA | NA | NA | NA | EG | 8 |
| 2006 | ||||||||||||
| 26 | Chang FH et al[79] | WBC | CYP1A1 | GSTM1 | NA | 47.9 | 44/62 | 62/96 | 62/101 | 16/67 | EG | 6 |
| 27 | Chen HC et al[80] | WBC | NAT2,GSTP1 | GSTM1 | NA | 45.2 | NA | NA | NA | NA | EG | 7 |
| GSTT1 | NA | 43.1 | NA | NA | NA | NA | EG | |||||
| 28 | Li Y et al[81] | case: BALF cells control: WBC | CYP1A1 | GSTM1 | YES/YES* | 44.1 | 19/26 | 28/63 | 41/72 | 32/73 | EG | 8 |
| 29 | Yao W et al[82] | case: lung cancer tissue/control: WBC | NA | GSTM1 | NA | 42.1 | NA | NA | NA | NA | NEG | NA |
| GSTT1 | NA | 50.5 | NA | NA | NA | NA | NA | |||||
| 30 | Qian BY et al[83] | NA | CYP1A1 | GSTM1 | YES | 49.1 | 15/23 | 22/46 | 54/85 | 31/62 | NEG | NA |
| 31 | Wang QM et al[84] | WBC | CYP2C9 | GSTM1 | NA | 45.2 | 10/19 | 7/19 | 30/37 | 12/23 | EG | 4 |
| 32 | He DX et al[85] | WBC | NA | GSTT1 | NA | 63.0 | NA | NA | NA | NA | EG | 5 |
| 2005 | ||||||||||||
| 33 | Chan EC et al[86] | case: uninvolved lung tissue/control: WBC | GSTP1, MPO etc. | GSTM1 | NA | 56.2 | NA | NA | NA | NA | EG | 5 |
| 34 | Yuan TZ et al[87] | WBC | NA | GSTT1 | NA | 38.2 | 12/52 | 39/100 | 70/98 | 19/52 | EG | 7 |
| 35 | Li DR et al[88] | WBC | CYP2E1 | GSTM1 | NA | 40.9 | 22/36 | 17/50 | 35/63 | 10/16 | EG | 5 |
| 36 | Ye WY et al[89] | WBC | NA | GSTM1 | NA | 53.2 | NA | NA | NA | NA | EG | 6 |
| 37 | Chou YC et al[90] | WBC | NA | GSTM1 | NA | 65.0 | NA | NA | NA | NA | EG | 8 |
| 2004 | ||||||||||||
| 38 | Liang GY et al[91] | WBC | CYP1A1, 2E1, GSTP1 etc. | GSTM1/GSTT1 | YES | 52.0/38.2 | NA | NA | NA | NA | EG | 6 |
| 39 | Yang XHR et al[92] | WBC | CYP1A1 | GSTM1 | NA | 54.0 | OR 95% CI = 1.05(0.56–2.00) | OR 95% CI = 1.61(0.80–3.25) | EG | 7 | ||
| 40 | Moira CY et al[93] | WBC | GSTP1 | GSTM1 | NA | 59.4 | NA | NA | EG | 6 | ||
| GSTT1 | NA | 51.8 | OR a 95% CI = 2.18(1.21–3.94) | NA | ||||||||
| 41 | Lan Q et al[94] | buccal cells | p53 | GSTM1/GSTT1 | NA | 49.2/52.5 | NA | NA | NA | NA | NEG | NA |
| 42 | Gu YF et al[95] | WBC | CYP1A1, 2D6, 2E1 | GSTM1 | NA | 45.5 | OR 95% CI = 2.01(0.53,8.22) | OR 95% CI = 5.50(1.43,22.89)I | EG | 5 | ||
| 43 | Dong CT et al[96] | WBC | CYP1A1 | GSTM1 | NA | 39.6 | NA | NA | NA | NA | EG | 7 |
| 44 | Luo CL et al[97] | WBC | p53 | GSTM1 | NA | 51.1 | NA | NA | NA | NA | EG | 6 |
| 45 | Cao YF et al[98] | WBC | NA | GSTM1/GSTT1 | NA | 46.3/42.4 | NA | NA | NA | NA | EG | 7 |
| 46 | Chen SD et al[99] | WBC | CYP2E1 | GSTM1 | NA | 56.0 | 25/36 | 31/59 | 31/55 | 18/32 | EG | 7 |
| 47 | Huang XH et al[100] | WBC | NA | GSTM1 | NA | 52.9 | 25/36 | 39/76 | 31/55 | 34/62 | EG | 7 |
| 48 | Ye WY et al[101] | WBC | NA | GSTM1 | NA | 46.8 | NA | NA | NA | NA | EG | 7 |
| 2003 | ||||||||||||
| 49Ψ | Wang JW et al[102] | WBC | GSTP1 | GSTM1 | NA | 50.4 | 40/64 | 36/71 | 29/48 | 24/48 | EG | 6 |
| GSTT1 | NA | 49.7 | 30/64 | 27/71 | 23/48 | 27/48 | ||||||
| 50 | Wang JW et al[103] | WBC | CYP2E1, 1A1 | GSTM1 | YES | 57.6 | 53/94 | 52/105 | 44/70 | 38/76 | EG | 8 |
| 51 | Chen LJ et al[104] | WBC | NA | GSTM1 | NA | 47.5 | 8/13 | 36/63 | 16/25 | 21/36 | EG | 7 |
| 52 | Li WY et al[105] | WBC | CYP1A1,2E1, 2D6 | GSTM1 | YES | 50.4 | 55/96 | 70/135 | 72/121 | 25/65 | EG | 6 |
| 2002 | ||||||||||||
| 53 | Lu WF et al[106] | case: “normal” tissue adjacent to tumor/control: WBC | MPO | GSTM1 | NA | 49.4 | 54/111 | 154/298 | 104/203 | 156/330 | EG | 8 |
| 54a | Qiao GB et al[107] | case: tumor tissue/control: benign lung tissue | NA | GSTM1 | NA | 48.4 | NA | NA | NA | NA | EG | 7 |
| 54b | Qiao GB et al[107] | case: tumor tissue/control: WBC | NA | GSTM1 | NA | 47.4 | NA | NA | NA | NA | EG | 6 |
| 55 | Zhang LZ et al[108] | case: lung cancer tissue/control: WBC | CYP1A1 | GSTM1 | NA | 45.0 | 8/14 | 14/28 | 33/51 | 13/32 | NEG | NA |
| 56 | Shi Y et al[109] | WBC | CYP2E1 | GSTM1 | NA | 44.2 | NA | NA | NA | NA | EG | 6 |
| 57Ψ | Zhang JK et al[110] | WBC | NA | GSTM1 | NA | 54.5 | 28/38 | 23/44 | NA | NA | Female/EG | 7 |
| GSTT1 | NA | 38.2 | 18/38 | 18/44 | NA | NA | ||||||
| 58 | Zhang JK et al[111] | WBC | NA | GSTM1 | NA | 55.8 | 39/57 | 52/100 | NA | NA | EG | 7 |
| GSTT1 | NA | 43.6 | 27/57 | 44/100 | NA | NA | ||||||
| 59 | Xin Y et al[112] | WBC | NA | GSTM1 | NA | 65.7 | NA | NA | NA | NA | EG | 4 |
| 2001 | ||||||||||||
| 60 | Cheng YW et al[113] | case: normal tissue surrounding lung tumor/control: NA | NA | GSTM1 | NA | 50.0 | NA | NA | NA | NA | NEG | NA |
| 61 | Chen SQ et al[114] | WBC | CYP1A1 | GSTM1 | NA | 36.8 | NA | NA | 42/80 | 29/80 | EG | 7 |
| 2000 | ||||||||||||
| 62 | Stephanie J London et al[115] | WBC | NA | GSTM1/GSTT1 | NA | 60.1/60.0 | NA | NA | NA | NA | EG | 7 |
| 63 | Cheng YW et a[116]l | non-tumorous area cell | CYP1A1 | GSTM1 | YES | 51.5 | NA | NA | NA | NA | NEG | NA |
| 1999 | ||||||||||||
| 64 | Lan Q et al[117] | buccal cells | NA | GSTM1/GSTT1 | NA | 44.2/60.5 | NA | NA | NA | NA | NEG | NA |
| 65a | Gao Y et al[118] | NA | NA | GSTM1 | NA | 49.3 | 14/21 | 26/51 | 20/38 | 10/22 | EG | 8 |
| 65b | Gao Y et al[118] | NA | NA | GSTM1 | NA | 49.2 | 14/21 | 20/34 | 20/38 | 9/25 | EG | 7 |
| 66 | Chen SQ et al[119] | WBC | CYP1A1 | GSTM1 | NA | 40.0 | NA | NA | NA | NA | EG | 5 |
| 1998 | ||||||||||||
| 67 | Gao JR et al[120] | WBC | CYP2D6 | GSTM1 | NA | 35.7 | NA | NA | NA | NA | EG | 8 |
| 68a | Qu YH et al[121] | WBC: | CYP1A1 | GSTM1 | YES | 52.1 | 56/100 | 49/94 | NA | NA | Female/EG | 5 |
| 68b | Qu YH et al[121] | WBC | CYP1A1 | GSTM1 | YES | 52.9 | 46/82 | 45/85 | NA | NA | Female/EG | 4 |
| 1997 | ||||||||||||
| 69 | Sun GF et al[122] | WBC | NA | GSTM1 | NA | 51.1 | 49/67 | 97/191 | 98/140 | 89/173 | EG | 6 |
| 1996 | ||||||||||||
| 70a | Ge H et al[123] | case: normal lung tissue, WBC/control: WBC | L-myc | GSTM1 | NA | 64.0 | NA | NA | NA | NA | EG | 6 |
| 70b | Ge H et al[123] | case: normal lung tissue, WBC/control: WBC | L-myc | GSTM1 | NA | 67.9 | NA | NA | NA | NA | EG | 5 |
| 1995 | ||||||||||||
| 71 | Sun GF et al[124] | WBC | NA | GSTM1 | NA | 51.9 | 36/52 | 38/74 | 89/123 | 16/30 | EG | 5 |
HWE: Hardy-Weinberg Equilibrium; WBC: White blood cells; BALF: bronchoalveolar lavage fluid; NA: not available.
*: The HWE test results of CYP1A1 Msp1 that could be calculated were shown in the table, and the items with * meant the result that had been reported in the articles.
: Due to different setting of smoking status in papers, people who had smoked were calculated as smokers.
ORa: Adjusted OR. ED: Epidemiological Design; NED: Non-epidemiology Design; WBC: blood, White blood cell lymphocytes, and serum. ζ: Newcastle-Ottawa Scale (NOS).
: The OR 95% CI was captured from logistic analysis; I: Heavy-smoker; a: healthy control; b: hospital control.
: The GSTM1 data of this study was omitted because of a bigger sample in the other study published in the same year.
4. Statistical analysis
(1) The pooled ORs and 95% CIs were determined by the Z test, P≤0.05 was considered statistically significant. (2) Statistical heterogeneity among studies was assessed by Q and I2 statistics [50]. In heterogeneity tests, when P≤0.1, a random-effects model was used; when P>0.1, a fixed-effects model was performed [51]. Meanwhile, if I2≥50%, 50%>I2≥25% or I2<25%, we identified the studies as high, middle or low heterogeneity, respectively. (3) Sensitivity analysis was performed by removing one study at a time to calculate the overall homogeneity and effect size; the Galbraith plot was also performed to examine the possible distinct articles. (4) The possible reasons for heterogeneity between studies were investigated by subgroup analyses. Nine subgroups were analyzed as follows: histopathological classification (SC, AC or SCLC), geographical location (North, Northeast, Northwest, East, Central, South, or Southwest of China) (See Figure S1), smoking status (smoker vs. non-smoker), CYP1A1(Msp1) polymorphisms, case number (<100 vs. ≥100), source of controls (population-based vs. hospital-based), research design (epidemiological design vs. non-epidemiological design), test material (white blood cells, involved tissues or other cells, or not available) and quality score (4–5, 6, 7–8). The last five items listed above were used to assess the study quality. (5) Cumulative meta-analysis was used to explore any significant changes in the variation of sample size or publication year. (6) Publication bias was investigated by the Begg's test [52], Egger's linear regression test and Trim and Fill test [53]. (7) All analyses were performed with the software Stata version 12.0 (StataCorp LP, College Station, Texas, USA), and all P values were two sided.
Results
1. Study selection and study characteristics
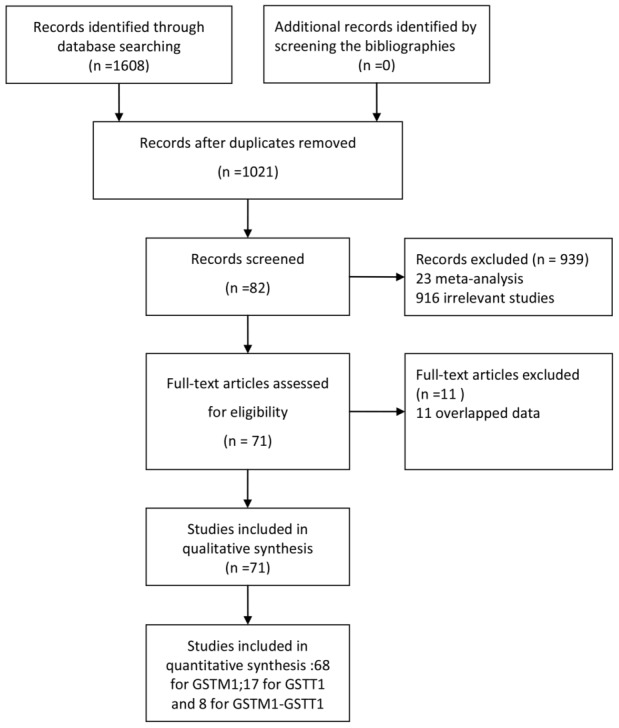
We ultimately identified a total of 71 articles [54]–[124] reporting the relationship between GSTM1 and/or GSTT1 genetic polymorphisms and lung cancer risk from both Chinese and English databases (Figure 1). There were 68 studies about GSTM1 (8649 cases and 10380 controls) [54]–[58], [60]–[65], [67]–[73], [75]–[84], [86], [88]–[101], [103]–[109], [111]–[124] published between 1995 and 2012, 17 studies about GSTT1 (2109 cases and 3031 controls) [55], [59], [66], [70], [74], [80], [82], [85], [87], [91], [93], [94], [98], [103], [111], [115], [117] between 1999 and 2012 and 8 studies about both GSTM1 and GSTT1 (775 cases and 1495 controls) [70], [74], [80], [82], [98], [102], [110], [115] between 2000 and 2010.
Figure 1. Study flow chart.
Most studies were published in Chinese (49/68 of GSTM1 studies, 13/17 of GSTT1, and 5/8 of both GSTM1 and GSTT1). According to our criterion, 61 (89.7%) studies of GSTM1, 13 (76.5%) of GSTT1, and 7 (87.5%) of both GSTM1 and GSTT1 were evaluated as epidemiological designs. In both control and case groups, 50 (73.5%) studies of GSTM1, 13 (76.5%) of GSTT1 and 7 (87.5%) of both GSTM1 and GSTT1 used white blood cells for GSTs genotype detection. The rest of the studies used adjacent lung tissue, tumor tissue, BALF cells or buccal cells, etc., for GSTs genotype detection in cases or controls. Only two studies reported the HWE test results for the GSTM1 or GSTT1 and satisfied HWE [57], [81]. In the eligible studies, the null genotype frequency of GSTM1 and GSTT1 ranged from 29.7% to 67.9% (Mean = 49.5%) and 37.5% to 63.0% (Median = 44.4%), respectively. The CYP1A1 (Msp1) polymorphisms satisfied the HWE in the controls of 15 (68%) studies about GSTM1 and CYP1A1 (Msp1). More details are shown in Table 1, Table 2 and Figure 2.
Figure 2. Cases and controls of 71 published studies included in this meta-analysis.

(a) 68 literatures about GSTM1 genetic variants and lung cancer risk; (b) 17 literatures about GSTT1 genetic variants and lung cancer risk; (c) 8 literatures about GSTM1-GSTT1 genetic variants dual null genotype and lung cancer risk.
2. Synthesis results of all studies
The results showed a significant association between the GSTM1 null genotype and lung cancer risk in the Chinese population under the random-effects model (OR = 1.20, 95% CI: 1.16 to 1.25, I2 = 45.1%, P<0.001) (Table 3). The random-effects model showed that the GSTT1 null genotype was significantly correlated with lung cancer risk in the Chinese population (OR = 1.17, 95% CI: 1.07 to 1.28, I2 = 55.9%, P<0.001) (Table 4). Further analyses showed that dual-null genotype of GSTM1-GSTT1 had a significant higher association with lung cancer risk (OR = 1.29, 95% CI: 1.03 to 1.63, I2 = 61.7%, P = 0.011) (Table 5). Risk estimation for each study is shown in the Forest plots in Figure 3, Figure 4a and Figure 4b.
Table 3. Subgroup analysis of the association between GSTM1 null genotype and lung cancer risk.
| Polymorphism | Null vs. Present | No. of studies (cases/controls) | Odds ratio | M | Heterogeneity | PE | ||
| OR[95%CI] | POR | I2 (%) | PH | |||||
| GSTM1 | All studies | 68(8649/10380) | 1.20[1.16,1.25] | <0.001 | R | 45.1 | <0.001 | 0.245 |
| subgroup analyses by histopathology classification. | ||||||||
| Squamous Carcinoma | 14(1088/3218) | 1.20[1.12,1.27] | <0.001 | F | 19.5 | 0.241 | 0.790 | |
| Adenocarcinoma | 13(1060/3093) | 1.14[1.03, 1.26] | 0.008 | R | 50.3 | 0.020 | 0.491 | |
| Small Cell Lung Carcinoma | 5(179/1853) | 1.29[1.13,1.47] | <0.001 | F | 38.7 | 0.163 | 0.313 | |
| subgroup analyses by geographical location¤ | ||||||||
| North China | 11(2320/2792) | 1.19[1.13,1.25] | <0.001 | F | 35.6 | 0.114 | 0.099 | |
| Northeast of China | 4(835/948) | 1.24[1.07,1.43] | 0.004 | R | 54.1 | 0.088 | 0.252 | |
| Northwest of China | 1(58/116) | 1.11[0.85,1.47] | 0.442 | R | @ | @ | @ | |
| East China | 16(1745/2615) | 1.11[1.02,1.20] | 0.011 | R | 40.8 | 0.045 | 0.387 | |
| Central China | 8(968/1319) | 1.35[1.25,1.47] | <0.001 | F | 0 | 1.000 | 0.050 | |
| South China | 15(1577/1276) | 1.13[1.05,1.21] | <0.001 | F | 25.5 | 0.174 | 0.221 | |
| Southwest of China | 9(737/904) | 1.21[1.04,1.40] | 0.011 | R | 61.6 | 0.008 | 0.646 | |
| subgroup analyses by smoking status | ||||||||
| smoker• | 32(NA/NA) | 1.34[1.23,1.47] | <0.001 | R | 53.8 | <0.001 | 0.008‡ | |
| non-smoker | 35(NA/NA) | 1.20[1.13,1.26] | <0.001 | F | 14.6 | 0.226 | 0.052 | |
| subgroup analyses by CYP1A1(Msp1) | ||||||||
| wt/wt | 11(578/961) | 1.17[1.06,1.30] | 0.002 | F | 0 | 0.891 | 0.678 | |
| wt/mt | 10(732/926) | 1.23[1.12,1.35] | <0.001 | F | 12.7 | 0.326 | 0.631 | |
| mt/mt | 6(203/167) | 1.34[1.13,1.59] | 0.001 | F | 0 | 0.979 | 0.010‡ | |
| subgroup analyses by number of case | ||||||||
| <100 | 32(2152/2576) | 1.20[1.12,1.28] | <0.001 | R | 35.5 | 0.026 | 0.582 | |
| ≥100 | 36(6497/7804) | 1.20 [1.15,1.26] | <0.001 | R | 52.6 | <0.001 | 0.024‡ | |
| subgroup analyses by source of control | ||||||||
| Population-based | 45(5883/7304) | 1.21[1.15,1.27] | <0.001 | R | 53.3 | <0.001 | 0.026 | |
| Hospital-based | 20(2216/2030) | 1.20[1.13,1.27] | <0.001 | F | 30.1 | 0.101 | 0.150 | |
| Mixed-based | 3(550/1046) | 1.22[1.11,1.35] | <0.001 | F | 0 | 0.893 | 0.603 | |
| subgroup analyses by research design | ||||||||
| Epidemiological study | 61(8056/9844) | 1.20[1.15,1.24] | <0.001 | R | 46.4 | <0.001 | 0.175 | |
| Non-epidemiological study | 7(593/536) | 1.30[1.16,1.45] | <0.001 | F | 19.1 | 0.284 | 0.046‡ | |
| subgroup analyses by test material | ||||||||
| White blood cells | 50(6697/8616) | 1.21[1.16,1.26] | <0.001 | R | 46.7 | <0.001 | 0.069 | |
| Involved tissue or cell† | 15(1726/1524) | 1.17[1.06,1.30] | 0.003 | R | 52.2 | 0.009 | 0.554 | |
| Not available | 3(226/240) | 1.23[1.04,1.45] | 0.014 | F | 0 | 0.822 | 0.115 | |
| subgroup analyses by quality score¶ (Epidemiological study) | ||||||||
| 4–5 | 11(1108/1223) | 1.20[1.07,1.36] | 0.002 | R | 57 | 0.010 | 0.606 | |
| 6 | 13(1948/1960) | 1.15[1.06,1.26] | 0.002 | R | 52.8 | 0.013 | 0.240 | |
| 7–8 | 44(5593/7197) | 1.21[1.16,1.27] | <0.001 | R | 40.9 | 0.003 | 0.023‡ | |
¤: Geographical locations of China were divided into 7 parts: Northeast of China (Jilin province, Liaoning province, Heilongjiang province), North China (Beijing city, Tianjin city, Heber province, Shanxi Province (Taiyuan), Inner Mongolia), East China (Shanghai city, Anhui province, Jiangxi province, Jiangsu province, Zhejiang province, Fujian province, Shandong province, Taiwan), Central China (Henan province, Hubei province, Hunan province), South China (Guangdong province, Hainan province, Guangxi Zhuang Autonomous Region, Hongkong), Southwest of China (Chongqing City, Guizhou province, Sichuan Province, Yunnan Province, Tibet), Northwest of China (Shanxi province (xi'an), Gansu province, Ningxia Hui Autonomous Region, Xinjiang Uyghur autonomous region).
M: model of meta-analysis; R: random-effects model; F: fixed-effects model.PH: p value of heterogeneity test. PE:p value of Egger's test.POR: P<0.001 replace P = 0.000 and P less than 0.001. @: p values could not be calculated.
: the publication bias was detected in this group. ¶: Newcastle-Ottawa Scale (NOS).
: test materials of case or control was from the normal lung tissues, BALF cells, buccal cells or lung cancer tissue.
:the study of Wang YS et al was not included because of the unavailable data.
Table 4. Subgroup analysis of the association between GSTT1 null genotype and lung cancer risk.
| Polymorphism | Null vs. Present | No.ofstudies (cases/controls) | Odds ratio | M | Heterogeneity | PE | ||
| OR[95%CI] | POR | I2(%) | PH | |||||
| GSTT1 | All studies | 17(2109/3031) | 1.17[1,07,1.28] | <0.001 | R | 55.9 | 0.003 | 0.510 |
| subgroup analyses by histopathology classification | ||||||||
| Squamous Carcinoma | 5(240/680) | 1.38[1.20,1.59] | <0.001 | F | 38.9 | 0.162 | 0.222 | |
| Adenocarcinoma | 4(389/620) | 1.23[1.08,1.40] | 0.001 | F | 0 | 0.546 | 0.993 | |
| Small Cell Lung Carcinoma | NA | NA | NA | NA | NA | NA | NA | |
| subgroup analyses by geographical location¤ | ||||||||
| North China | 2(218/369) | 1.05[0.88,1.27] | 0.576 | F | 0 | 0.922 | @ | |
| Northeast of China | NA | NA | NA | NA | NA | NA | NA | |
| Northwest of China | 1(53/72) | 0.86[0.52,1.40] | 0.534 | @ | @ | @ | @ | |
| East China | 2(384/862) | 1.17[0.77,1.77]] | 0.454 | R | 88.9 | 0.003 | @ | |
| Central China | 4(487/765) | 1.30[1.09,1.54] | 0.003 | R | 55.4 | 0.081 | 0.485 | |
| South China | 3(448/422) | 1.17[1.03,1.33] | 0.013 | F | 0 | 0.440 | 0.876 | |
| Southwest of China | 4(419/406) | 1.10[0.90,1.35] | 0.341 | R | 59.4 | 0.060 | 0.487 | |
| subgroup analyses by smoking status | ||||||||
| smoker | 6(344/268) | 1.15[0.73,1.81] | 0.541 | R | 85.8 | <0.001 | 0.301 | |
| non-smoker | 8(NA/NA) | 1.16[0.93,1.45] | 0.187 | R | 41.7 | 0.100 | 0.596 | |
| subgroup analyses by number of case | ||||||||
| <100 | 6(432/568) | 1.11[0.94,1.32] | 0.221 | R | 49.8 | 0.077 | 0.327 | |
| ≥100 | 11(1677/2463) | 1.19[1.08,1.33] | 0.001 | R | 61.8 | 0.004 | 0.094 | |
| subgroup analyses by source of control | ||||||||
| Population-based | 14(1798/2557) | 1.17[1.07,1.29] | 0.001 | R | 57.7 | 0.004 | 0.284 | |
| Hospital-based | 3(311/474) | 1.15[0.86,1.54] | 0.335 | R | 62.2 | 0.071 | 0.587 | |
| subgroup analyses by research design | ||||||||
| Epidemiological study | 13(1718/2466) | 1.20[1.07,1.34] | 0.001 | R | 64.9 | 0.001 | 0.464 | |
| Non-epidemiological study | 3(285/315) | 1.09[0.95,1.26] | 0.214 | F | 0 | 0.695 | 0.971 | |
| subgroup analyses by test material | ||||||||
| White blood cells | 13(1718/2466) | 1.20[1.07,1.34] | 0.001 | R | 64.9 | 0.001 | 0.464 | |
| Involved tissue or cell† | 3(285/315) | 1.09[0.95,1.26] | 0.214 | F | 0 | 0.695 | 0.971 | |
| Not available | 1(106/250) | 1.06[0.83,1.36] | 0.628 | @ | @ | @ | @ | |
| subgroup analyses by quality score¶ (Epidemiological study) | ||||||||
| 4–5 | 4(366/525) | 1.07[0.94,1.22] | 0.310 | F | 0 | 0.510 | 0.158 | |
| 6 | 4(593/603) | 1.26[1.13,1.41] | <0.001 | F | 23.1 | 0.272 | 0.860 | |
| 7–8 | 9(1150/1903) | 1.18[1.03,1.36] | 0.020 | R | 69.6 | 0.001 | 0.380 | |
¤: geographical locations of China were divided into 7 parts: Northeast of China (Jilin province, Liaoning province, Heilongjiang province), North China (Beijing city, Tianjin city, Heber province, Shanxi Province (Taiyuan), Inner Mongolia), East China (Shanghai city, Anhui province, Jiangxi province, Jiangsu province, Zhejiang province, Fujian province, Shandong province,Taiwan), Central China (Henan province, Hubei province, Hunan province), South China (Guangdong province, Hainan province, Guangxi Zhuang Autonomous Region, Hongkong), Southwest of China (Chongqing City, Guizhou province, Sichuan Province, Yunnan Province, Tibet), Northwest of China (Shanxi province (Xi'an), Gansu province, Ningxia Hui Autonomous Region, Xinjiang Uyghur autonomous region).
M: model of meta-analysis; R: random-effects model; F: fixed-effects model.PH: p value of heterogeneity test. PE:p value of
Egger's test. POR: P<0.001 replace the P = 0.000 and the P less than 0.001. @: p values could not be calculated.
NA: not available.
Table 5. Subgroup analysis of the association between GSTM1-GSTT1 null genotype and lung cancer risk.
| Polymorphism | Null vs. Present | No. of studies (cases/controls) | Odds ratio | M | Heterogeneity | PE | ||
| OR [95%CI] | POR | I2(%) | PH | |||||
| GSTM1-GSTT1 | All studies | 8(775/1495) | 1.29[1.03,1.63] | 0.028 | R | 61.7 | 0.011 | 0.320 |
| subgroup analyses by number of case | ||||||||
| <100 | 5(327/461) | 1.33[1.07,1.65] | 0.009 | F | 21.6 | 0.277 | 0.407 | |
| ≥100 | 3(448/1034) | 1.30[0.84,2.00] | 0.238 | R | 82.8 | 0.003 | 0.387 | |
| subgroup analyses by source of control | ||||||||
| Population-based | 7(722/1423) | 1.34[1.06,1.71] | 0.016 | R | 64.5 | 0.010 | 0.126 | |
| Hospital-based | 1(53/72) | 0.80[0.40,1.60] | 0.528 | R | @ | @ | @ | |
| subgroup analyses by research design | ||||||||
| Epidemiological study | 7(698/1418) | 1.34[1.03,1.73] | 0.029 | R | 66.4 | 0.007 | 0.293 | |
| Non-epidemiological study | 1(77/77) | 1.04[0.66,1.63] | 0.864 | R | @ | @ | @ | |
M: model of meta-analysis; R: random-effects model; F: fixed-effects model.PH: p value of heterogeneity test. PE: p value of Egger's test. POR: P<0.001 replace the P = 0.000 and the P less than 0.001. @: p values could not be calculated.
Figure 3. Association between GSTM1 null genotype and lung cancer susceptibility analyzed by the Forest plot.

The Forest plots of pooled OR with 95% CI (Null genotype vs. Present genotype; OR = 1.20, 95% CI: 1.16 to 1.25; Random-effects model, P<0.001).
Figure 4.

(a) Association between GSTT1 null genotype and lung cancer susceptibility analyzed by the Forest plot. The Forest plots of pooled OR with 95% CI (Null genotype vs. Present genotype; OR = 1.17, 95% CI: 1.07 to 1.28; Random-effects model, P<0.001). (b) Association between GSTM1-GSTT1 dual-null genotype and lung cancer susceptibility analyzed by the Forest plot The Forest plots of pooled OR with 95% CI (Dual-null genotype vs. Present genotype; OR = 1.29, 95% CI: 1.03 to 1.63; Random-effects model, P<0.001).
3. Cumulative meta-analysis
The cumulative meta-analysis was used to examine the fluctuation of the eligible studies with changes in the publication year or sample size. With the publication year development and sample size increase, the cumulative meta-analysis of GSTM1 tended to be stable. However, no significant difference in the trend was found in the GSTT1 and GSTM1-GSTT1 cumulative meta-analysis. The results for cumulative meta-analysis are shown in Figure 5 and Figure 6.
Figure 5. Cumulative meta-analysis of the association between GSTM1 null genotype and lung cancer susceptibility.

(a) publication time cumulative meta-analysis of GSTM1 variants and lung cancer risk; (b) sample size cumulative meta-analysis of GSTM1 variants and lung cancer risk.
Figure 6. Cumulative meta-analysis of the association between GSTT1/GSTM1-GSTT1 genetic polymorphisms and lung cancer susceptibility.

(a) publication time cumulative meta-analysis of GSTT1 variants and lung cancer risk; (b) sample size cumulative meta-analysis of GSTT1 variants and lung cancer risk; (c) publication time cumulative meta-analysis of GSTM1-GSTT1 variants and lung cancer risk; (d) sample size cumulative meta-analysis of GSTM1-GSTT1 variants and lung cancer risk.
4. Subgroup analysis
Due to the fact that all studies were middle to high heterogeneities, analyses on nine subgroups as mentioned above were performed accordingly. No significant increase in the risk of lung cancer was detected in either null genotype of GSTM1 in the northwest, or null genotype of GSTT1 in the north, southwest or northwest of China (Table 3, Table 4). The excess lung cancer risk was found associated with null GSTM1 genotype, but not with null GSTT1 genotype, in both smokers and nonsmokers. Besides, smokers had a higher risk than non-smokers in the association between GSTM1 null genotype and lung cancer risk. The interaction of CYP1A1 (Msp1) with mt/mt genotype and GSTM1 null genotype could enhance the risk of lung cancer, and the OR of which were a little higher than the other two CYP1A1 (Msp1) genotypes with GSTM1 null.
However, high heterogeneities in the analysis of the association between GSTM1 variants and lung cancer were found in the studies from northeast and southwest China. The subgroups of AC and smokers also showed greater heterogeneities (I2:53.8% and 50.3%, respectively). Meanwhile, the subgroup analyses of GSTT1 genetic polymorphisms and lung cancer susceptibility demonstrated high heterogeneities in the subgroups of central China, southwest China, and smokers.
When analyzing the five subgroups of case numbers ≥100, population-based controls, epidemiological studies, test material from white blood cells, and quality score (7–8), all pooled results showed significant association between GSTT1 genetic polymorphisms and lung cancer risk, but high heterogeneities also appeared. However, subgroups of case numbers <100, hospital-based controls, non-epidemiological studies, test materials from involved tissue or cells or not available, and quality score (4–5), all pooled results showed no significant association between GSTT1 genetic polymorphisms and lung cancer risk (Table 4).
In the analysis of the relationship of GSTM1-GSTT1 genetic polymorphisms with lung cancer risk, no significant association was found in the subgroup of case numbers (≥100). Along with significant increase risks in the subgroup of population-based controls and epidemiological studies, high heterogeneity was also found (Table 5).
5. Galbraith plot and sensitivity analysis
In Figure 7a, 7 articles were identified in the Galbraith plot as the outliers [60], [68], [86], [89], [93], [115], [122]. After omitting these records, the adjusted association of GSTM1 null genetype and lung cancer risk showed a lower heterogeneity and an increased susceptibility (fixed-effects model: OR = 1.23, 95% CI: 1.19 to 1.27, P<0.001). Besides, according to the Galbraith plot of the association of GSTT1 or GSTM1-GSTT1 interaction polymorphisms with lung cancer risk, 2 articles [98], [115] were obviously spotted as the outliers, which were the possible sources for the heterogeneities. After adjustment, the association of both groups were all increased (fixed-effects model: ORGSTT1 = 1.18, 95% CI: 1.10 to 1.26, P<0.001; ORGSTM1-GSTT1 = 1.33, 95% CI: 1.10 to 1.61, P = 0.004) and the I2 indexes were decreased to 29.5% for GSTT1 and 2.1% for GSTM1-GSTT1, respectively (Figure 7, Table 6). Then, the sensitivity analysis was carried out in each group (data not shown).
Figure 7. Galbraith plot of association between GSTs polymorphisms and lung cancer risk.

Each figure represents a unique article in this meta-analysis. The figures outside the three lines were spotted as the outliers and the possible sources of heterogeneity in the analysis pooled from the total available number. (a) Galbraith plot result of GSTM1 polymorphisms and lung cancer risk; (b) Galbraith plot result of GSTT1 polymorphisms and lung cancer risk; (c) Galbraith plot result of GSTM1-GSTT1 dual null genotype and lung cancer risk.
Table 6. Subgroup analysis of $the adjusted association between GSTM1 null genotype, GSTT1 null genotype and GSTM1-GSTT1 dual null genotype and lung cancer risk.
| Polymorphism | Null vs. Present | No. of studies (cases/controls) | Odds ratio | M | Heterogeneity | PE | ||
| OR[95%CI] | POR | I2 (%) | PH | |||||
| GSTM1 | All studies | 61(7455/8364) | 1.23[1.19,1.27] | <0.001 | F | 2.2 | 0.427 | 0.337 |
| GSTT1 | All studies | 15(1773/2116) | 1.18[1.10,1.26] | <0.001 | F | 29.5 | 0.135 | 0.296 |
| GSTM1-GSTT1 | All studies | 6(439/580) | 1.33[1.10,1.61] | 0.004 | F | 2.1 | 0.403 | 0.349 |
M: model of meta-analysis; R: random-effects model; F: fixed-effects model.PH: p value of heterogeneity test.PE: p value of Egger' test. POR: P<0.001 replace the P = 0.000 and the P less than 0.001. $: adjusted association (after omitting several articles from Galbraith plot).
6. Potential publication bias
Begg's funnel plots and Egger's linear regression test were used to evaluate the potential publication bias (Figure 8a and Figure 8b for GSTM1; Figure 8c and Figure 8d for GSTT1; Figure 8e and Figure 8f for GSTM1-GSTT1). No publication bias was detected by Egger's test (PE = 0.245 for GSTM1, PE = 0.510 for GSTT1 and PE = 0.320 for dual-null genotype of GSTM1-GSTT1). The Trim and Fill test further confirmed the results (data not shown).
Figure 8. Begg's funnel plot and Egger's linear regression test of the association between GSTs polymorphisms and lung cancer risk.

Begg's funnel plot is used to detect potential publication bias in which a symmetric funnel shape means no publication bias. Egger's linear regression test is used to quantify the potential presence of publication bias; (a) (b) GSTM1: No publication bias has been found from 68 inclusive studies about the association between GSTM1 polymorphisms and lung cancer risk by Begg's??? test and Egger's test, respectively; (c)(d) GSTT1: No publication bias has been found from 17 inclusive studies about the association between GSTT1 polymorphisms and lung cancer risk by Begg's test and Egger's test, respectively; (e)(f) GSTM1-GSTT1 dual-null genotype: No publication bias has been found from 8 inclusive studies about the association between GSTM1-GSTT1 dual-null genotype and lung cancer risk by Begg's test and Egger's test, respectively.
Discussion
To our knowledge, this is the first large-scale systematic meta-analysis on the correlation of two vital GSTs genetic polymorphisms with lung cancer risk in the Chinese population over the past decade. Our pooled analysis on the original studies in the Chinese population provided efficient and effective evidences of an increased association between null GSTM1, null GSTT1 or dual null GSTM1-GSTT1 genotypes and lung cancer risk when omitting some possible heterogeneous records. This large-scale systematic review on sufficient studies helps to reduce random error and increase the statistical power. Simultaneously, by using the same inclusive criteria, it can also ensure the pooled results more precise and exact. It is well known that different populations have different genetic variations and environmental exposure factors. Previous studies paid more attention to the Asian or special environmental population [35], [46]. We only focused on the Chinese ethnicity.
In subgroup analysis of GSTM1 genetic variants, the northeast and southwest of China were found to be a source of difference, and in subgroup analysis of GSTT1 genetic variants, the southwest regions of China was also suggested as the major heterogeneous source. Furthermore, no association between GSTs and lung cancer susceptibility was evident in the Chinese population living in the above regions. To our knowledge, the greatest population in the southwest and northwest areas of China is the Chinese ethnic minorities. The complex genetic backgrounds of various ethnic minorities might have an influence on lung cancer susceptibility. In the subgroup of histopathological classification, increased association between the genetic polymorphisms and SC (OR and 95% CI:1.20 [1.12,1.27]) and SCLC (OR and 95% CI:1.29[1.13,1.47]) risk were found with a low heterogeneity. These results for the first time imply a clue that SCLC could have a stronger association with GSTM1 deficiency than the other two types while no statistic difference was found among 3 pathological types from available data. Due to the limited number of studies and comparatively diversity among various studies, more well designed epidemiological studies should be performed for various pathological types of lung cancers (especially for pulmonary AC). Additionally, we found that there was increased susceptibility between GSTM1 null genotype and lung carcinoma risk in different phase I isoenzymes of CYP1A1. These results not only further confirm our conclusion, but also imply some enlightenments. For instance, under a higher OR with no heterogeneity, people with CYP1A1 (mt/mt) and GSTM1 null genotype should pay more attention to avoiding exposure to harmful environmental factors associated with lung cancer. Naturally, more studies including a genome-wide association study (GWAS) are necessary to prove this hypothesis. Due to the limited number of studies, the same analysis for the GSTT1 null genotype was not performed.
The subgroup analyses of the smoking status for GSTM1 studies further suggested that the possible risk factor of GSTM1 null genotype is different. However, eligible studies for GSTT1 failed to reach a significant association, which might be caused by a limited number of studies with high heterogeneities. Unclear smoking definition and inconsistent classification of the amount of tobacco consumed among different studies might all have an influence on the stability, reliability, as well as further in-depth analyses of the results. Therefore, clear smoking definition and consistent classification for the smoking status are necessary in any future research.
In the sensitivity analyses and Galbraith plot, 7 heterogeneous articles for GSTM1 were detected by the Galbraith plot. The potential bias of these articles might be the result of small sample size, complex population composition, distinction of testing materials [86], and/or unknown reasons [115]. After omitting these articles, no heterogeneity was detected. Additionally, the Galbraith plot for the GSTT1 and GSTM1-GSTT1 groups spotted two of the same articles [98], [115] as the major source of between-heterogeneity. After removing these two articles, heterogeneity decreased substantially. Compared to the raw OR and 95% CI, the adjusted OR and 95% CI of GSTT1 and GSTM1-GSTT1 were both increased.
Cumulative meta-analysis showed a comparable change in the trend in the accumulated OR and 95% CI for GSTT1 or GSTM1-GSTT1 with the publication time development and sample size increase. Thus, to identify the real association between the GSTT1 null type, GSTM1-GSTT1 dual null type and lung cancer susceptibility, more large-scale case-control and cohort studies from multi-centers should be performed. At last, no publication biases were detected in our meta-analysis.
It's worth mentioning that Hardy-Weinberg equilibrium has been widely recommended in testing studies of genetic polymorphisms and diseases, the violations of which may have potential impacts on the results [125]. In this paper, no individual studies made any distinction between heterozygotes or homozygotes and GSTM1 and GSTT1 in the present genotype, so Hardy-Weinberg equilibrium tests could not be performed. Therefore, the Hardy-Weinberg equilibrium test results reported in some of the 71 articles might not be reliable.
It is worthy to note that several other limitations might be included in this study: (1) as common observational studies, case-control studies were susceptible to various biases (including recall bias of smoking status, different diagnostic criteria and the investigation bias of NOS score). These biases could influence the final findings of this study; (2) conclusions of this study were partly based on literatures obtained from the hospital-based population, which might not represent the whole population; (3) eligible studies for this study covered nearly all regions in China, but the article number was still insufficient in some less developed or relatively sparsely regions; (4) the interaction of genes with environmental factors, especially with special external occupational exposure and environmental pollution, might all contribute to the development of lung cancer. Factors above might also contribute to a possible source of heterogeneity of our results. Owning to the limitation of the data, this paper did not analyze the interaction effects of these factors; (5) absence of HWE test in the control group, some unbalance controls could lead to some bias in the final results.
Taken together, after a decade of extensive studying on this topic, our findings suggest that GSTM1 and GSTT1 genetic polymorphisms are associated with increased lung cancer risk in the Chinese population. Because of multifactor etiology of the interaction of gene-gene and gene-environment in the development of lung cancer, large-scale and methodologically sound studies with different environmental background and other genetic polymorphisms should be carried out to explore the real association between GSTs variants and various pathological types of lung cancer.
Supporting Information
PRISMA checklist.
(DOC)
Map of the seven regions in China.
(TIF)
Acknowledgments
The excellent assistance of Ms Linda Bowman and Miss Wei Lu in the preparation of this article is greatly appreciated.
Funding Statement
This work was supported by the National Nature Science Foundation of China (Grant No. 81273111), the Foundations of Innovative Research Team of Educational Commission of Zhejiang Province (T200907), the Nature Science Foundation of Ningbo city (Grant No. 2012A610185), the Ningbo Scientific Projects (2012C5019 and SZX11073), the Scientific Innovation Team Project of Ningbo (No. 2011B82014), Innovative Research Team of Ningbo (2009B21002), and K.C. Wong Magna Fund in Ningbo University. The funders had no role in study design, data collection and analysis, decision to publish, or preparation of the manuscript.
References
- 1. Tyczynski JE, Bray F, Maxwell Parkin D (2003) Lung cancer in Europe in 2000: epidemiology, prevention, and early detection. The Lancet Oncology 4: 45–55. [DOI] [PubMed] [Google Scholar]
- 2. Jemal A, Bray F (2011) Center MM, Ferlay J, Ward E, et al (2011) Global cancer statistics. CA: A Cancer Journal for Clinicians 61: 69–90. [DOI] [PubMed] [Google Scholar]
- 3. Zhao J, Kim JE, Reed E, Li QQ (2005) Molecular mechanism of antitumor activity of taxanes in lung cancer (Review). International Journal of Oncology 27: 247. [PubMed] [Google Scholar]
- 4. Siegel R, Naishadham D, Jemal A (2012) Cancer statistics, 2012. CA: A Cancer Journal for Clinicians 62: 10–29. [DOI] [PubMed] [Google Scholar]
- 5. Lam W, White N, Chan-Yeung M (2004) Lung cancer epidemiology and risk factors in Asia and Africa State of the Art. The International Journal of Tuberculosis and Lung Disease 8: 1045–1057. [PubMed] [Google Scholar]
- 6.American Cancer Society (2012) American Cancer Society: Cancer Facts & Figures 2012. Atlanta: American Cancer Society.
- 7. Paez JG, Janne PA, Lee JC, Tracy S, Greulich H, et al. (2004) EGFR mutations in lung cancer: correlation with clinical response to gefitinib therapy. Science 304: 1497–1500. [DOI] [PubMed] [Google Scholar]
- 8. Ramalingam SS, Owonikoko TK, Khuri FR (2011) Lung cancer: New biological insights and recent therapeutic advances. CA Cancer J Clin 61: 91–112. [DOI] [PubMed] [Google Scholar]
- 9. Tucker ZC, Laguna BA, Moon E, Singhal S (2012) Adjuvant immunotherapy for non-small cell lung cancer. Cancer Treat Rev 38: 650–661. [DOI] [PubMed] [Google Scholar]
- 10. Kimura H, Yamaguchi Y (1995) Adjuvant immunotherapy with interleukin 2 and lymphokine-activated killer cells after noncurative resection of primary lung cancer. Lung Cancer 13: 31–44. [DOI] [PubMed] [Google Scholar]
- 11. Ebina T, Fujimiya Y (2008) Cell transfer regimens in patients with highly advanced surgically unresectable non-small cell lung cancer: Significantly improved overall survival in patients with lower levels of serum immunosuppressive acidic protein. Lung Cancer 60: 246–251. [DOI] [PubMed] [Google Scholar]
- 12. Li R, Wang C, Liu L, Du C, Cao S, et al. (2012) Autologous cytokine-induced killer cell immunotherapy in lung cancer: a phase II clinical study. Cancer Immunology, Immunotherapy 61: 2125–2133. [DOI] [PMC free article] [PubMed] [Google Scholar]
- 13. Iwai K, Soejima K, Kudoh S, Umezato Y, Kaneko T, et al. (2012) Extended survival observed in adoptive activated T lymphocyte immunotherapy for advanced lung cancer: results of a multicenter historical cohort study. Cancer Immunology, Immunotherapy 61: 1781–1790. [DOI] [PMC free article] [PubMed] [Google Scholar]
- 14. Shi SB, Ma TH, Li CH, Tang XY (2011) Effect of maintenance therapy with dendritic cells: cytokine-induced killer cells in patients with advanced non-small cell lung cancer. 98(3): 314–319. [DOI] [PubMed] [Google Scholar]
- 15. Wingo PA, Ries LA, Giovino GA, Miller DS, Rosenberg HM, et al. (1999) Annual report to the nation on the status of cancer, 1973–1996, with a special section on lung cancer and tobacco smoking. Journal of the National Cancer Institute 91: 675–690. [DOI] [PubMed] [Google Scholar]
- 16. Sasco A, Secretan M, Straif K (2004) Tobacco smoking and cancer: a brief review of recent epidemiological evidence. Lung Cancer 45: S3–S9. [DOI] [PubMed] [Google Scholar]
- 17. Hecht SS (1999) Tobacco smoke carcinogens and lung cancer. Journal of the National Cancer Institute 91: 1194–1210. [DOI] [PubMed] [Google Scholar]
- 18. Loft S, Poulsen HE (1996) Cancer risk and oxidative DNA damage in man. J Mol Med (Berl) 74: 297–312. [DOI] [PubMed] [Google Scholar]
- 19. Jaruga P, Zastawny TH, Skokowski J, Dizdaroglu M, Olinski R (1994) Oxidative DNA base damage and antioxidant enzyme activities in human lung cancer. FEBS Lett 341: 59–64. [DOI] [PubMed] [Google Scholar]
- 20. Paz-Elizur T, Krupsky M, Blumenstein S, Elinger D, Schechtman E, et al. (2003) DNA repair activity for oxidative damage and risk of lung cancer. J Natl Cancer Inst 95: 1312–1319. [DOI] [PubMed] [Google Scholar]
- 21. Gackowski D, Speina E, Zielinska M, Kowalewski J, Rozalski R, et al. (2003) Products of oxidative DNA damage and repair as possible biomarkers of susceptibility to lung cancer. Cancer Research 63: 4899–4902. [PubMed] [Google Scholar]
- 22. Liu K, Zhang L, Lin X, Chen L, Shi H, et al. (2013) Association of GST Genetic Polymorphisms with the Susceptibility to Hepatocellular Carcinoma (HCC) in Chinese Population Evaluated by an Updated Systematic Meta-Analysis. PloS One 8: e57043. [DOI] [PMC free article] [PubMed] [Google Scholar]
- 23.de Mello RA, Ferreira M, Pires FS, Costa S, Luis M, et al. (2013) The role of genetic polymorphisms at the chromosomes 5p15, 6p12, 6p21 and 15q25 in non-small-cell lung cancer prognosis: a Portuguese prospective study. BioMed Central Ltd (Suppl 2):P57.
- 24. Hu L, Zhuo W, He YJ, Zhou HH, Fan L (2012) Pharmacogenetics of P450 oxidoreductase: implications in drug metabolism and therapy. Pharmacogenetics and Genomics 22: 812–819. [DOI] [PubMed] [Google Scholar]
- 25. Nebert DW, McKinnon RA, Puga A (1996) Human drug-metabolizing enzyme polymorphisms: effects on risk of toxicity and cancer. DNA Cell Biol 15: 273–280. [DOI] [PubMed] [Google Scholar]
- 26. Smith G, Stanley LA, Sim E, Strange RC, Wolf CR (1995) Metabolic polymorphisms and cancer susceptibility. Cancer Surv 25: 27–65. [PubMed] [Google Scholar]
- 27. Udomsinprasert R, Pongjaroenkit S, Wongsantichon J, Oakley AJ, Prapanthadara LA, et al. (2005) Identification, characterization and structure of a new Delta class glutathione transferase isoenzyme. Biochem J 388: 763–771. [DOI] [PMC free article] [PubMed] [Google Scholar]
- 28. Frova C (2006) Glutathione transferases in the genomics era: new insights and perspectives. Biomol Eng 23: 149–169. [DOI] [PubMed] [Google Scholar]
- 29. Fryer AA, Zhao L, Alldersea J, Pearson W, Strange R (1993) Use of site-directed mutagenesis of allele-specific PCR primers to identify the GSTM1 A, GSTM1 B, GSTM1 A, B and GSTM1 null polymorphisms at the glutathione S-transferase, GSTM1 locus. Biochem J 295: 313–315. [DOI] [PMC free article] [PubMed] [Google Scholar]
- 30. Pemble S, Schroeder K, Spencer S, Meyer D, Hallier E, et al. (1994) Human glutathione S-transferase theta (GSTT1): cDNA cloning and the characterization of a genetic polymorphism. Biochem J 300: 271–276. [DOI] [PMC free article] [PubMed] [Google Scholar]
- 31. Dejong JL, Mohandas T, Tu CPD (1991) The human Hb (mu) class glutathioneS-transferases are encoded by a dispersed gene family. Biochemical and Biophysical Research Communications 180: 15–22. [DOI] [PubMed] [Google Scholar]
- 32. Seidegård J, Vorachek WR, Pero RW, Pearson WR (1988) Hereditary differences in the expression of the human glutathione transferase active on trans-stilbene oxide are due to a gene deletion. Proceedings of the National Academy of Sciences 85: 7293–7297. [DOI] [PMC free article] [PubMed] [Google Scholar]
- 33. Strange RC, Spiteri MA, Ramachandran S, Fryer AA (2001) Glutathione S-transferase family of enzymes. Mutation Research/Fundamental and Molecular Mechanisms of Mutagenesis 482: 21–26. [DOI] [PubMed] [Google Scholar]
- 34. Bolt H, Thier R (2006) Relevance of the deletion polymorphisms of the glutathione S-transferases GSTT1 and GSTM1 in pharmacology and toxicology. Current Drug Metabolism 7: 613–628. [DOI] [PubMed] [Google Scholar]
- 35. Ye Z, Song H, Higgins JP, Pharoah P, Danesh J (2006) Five glutathione s-transferase gene variants in 23,452 cases of lung cancer and 30,397 controls: meta-analysis of 130 studies. PLoS Med 3: e91. [DOI] [PMC free article] [PubMed] [Google Scholar]
- 36. Shukla R, Tilak A, Kumar C, Kant S, Kumar A, et al. (2013) Associations of CYP1A1, GSTM1 and GSTT1 Polymorphisms with Lung Cancer Susceptibility in a Northern Indian Population. Asian Pac J Cancer Prev 14: 3345–3349. [DOI] [PubMed] [Google Scholar]
- 37. Shi X, Zhou S, Wang Z, Zhou Z, Wang Z (2008) CYP1A1 and GSTM1 polymorphisms and lung cancer risk in Chinese populations: a meta-analysis. Lung Cancer 59: 155–163. [DOI] [PubMed] [Google Scholar]
- 38. Li C, Yin Z, Zhou B (2011) CYP1A1 gene and GSTM1 gene polymorphism and the combined effects and risk of lung cancer: a meta-analysis. Zhongguo Fei Ai Za Zhi 14: 660–668. [DOI] [PMC free article] [PubMed] [Google Scholar]
- 39. Yang X, Qiu MT, Hu JW, Wang XX, Jiang F, et al. (2013) GSTT1 null genotype contributes to lung cancer risk in asian populations: a meta-analysis of 23 studies. PLoS One 8: e62181. [DOI] [PMC free article] [PubMed] [Google Scholar]
- 40. Wang Y, Yang H, Li L, Wang H (2010) Glutathione S-transferase T1 gene deletion polymorphism and lung cancer risk in Chinese population: a meta-analysis. Cancer Epidemiol 34: 593–597. [DOI] [PubMed] [Google Scholar]
- 41. Zhou HF, Feng X, Zheng BS, Qian J, He W (2013) A meta-analysis of the relationship between glutathione S-transferase T1 null/presence gene polymorphism and the risk of lung cancer including 31802 subjects. Mol Biol Rep 40: 5713–5721. [DOI] [PubMed] [Google Scholar]
- 42. Lee KM, Kang D, Clapper ML, Ingelman-Sundberg M, Ono-Kihara M, et al. (2008) CYP1A1, GSTM1, and GSTT1 polymorphisms, smoking, and lung cancer risk in a pooled analysis among Asian populations. Cancer Epidemiol Biomarkers Prev 17: 1120–1126. [DOI] [PubMed] [Google Scholar]
- 43. Carlsten C, Sagoo GS, Frodsham AJ, Burke W, Higgins JP (2008) Glutathione S-transferase M1 (GSTM1) polymorphisms and lung cancer: a literature-based systematic HuGE review and meta-analysis. Am J Epidemiol 167: 759–774. [DOI] [PubMed] [Google Scholar]
- 44. Vlastos F, Hillas G, Anagnostopoulos N, Vignaud JM, Martinet N, et al. (2013) Polymorphisms of GSTs in Lung Adenocarcinoma Patients Followed in the Context of a Biobank. Journal of Cancer Therapy 04: 24–28. [Google Scholar]
- 45. Raimondi S, Paracchini V, Autrup H, Barros-Dios JM, Benhamou S, et al. (2006) Meta- and pooled analysis of GSTT1 and lung cancer: a HuGE-GSEC review. Am J Epidemiol 164: 1027–1042. [DOI] [PubMed] [Google Scholar]
- 46. Hosgood HD 3rd, Berndt SI, Lan Q (2007) GST genotypes and lung cancer susceptibility in Asian populations with indoor air pollution exposures: a meta-analysis. Mutat Res 636: 134–143. [DOI] [PMC free article] [PubMed] [Google Scholar]
- 47. Hardy GH (1908) Mendelian proportions in a mixed population. Science 28: 49–50. [DOI] [PubMed] [Google Scholar]
- 48. Schaid DJ, Jacobsen SJ (1999) Blased Tests of Association: comparisons of allele frequencies when departing from Hardy-Weinberg proportions. American Journal of Epidemiology 149: 706–711. [DOI] [PubMed] [Google Scholar]
- 49. Klug SJ, Ressing M, Koenig J, Abba MC, Agorastos T, et al. (2009) TP53 codon 72 polymorphism and cervical cancer: a pooled analysis of individual data from 49 studies. The Lancet Oncology 10: 772–784. [DOI] [PubMed] [Google Scholar]
- 50. Higgins JP, Thompson SG (2002) Quantifying heterogeneity in a meta-analysis. Stat Med 21: 1539–1558. [DOI] [PubMed] [Google Scholar]
- 51. Hedges LV, Vevea JL (1998) Fixed-and random-effects models in meta-analysis. Psychological methods 3: 486. [Google Scholar]
- 52. Begg CB, Mazumdar M (1994) Operating characteristics of a rank correlation test for publication bias. Biometrics 50: 1088–1101. [PubMed] [Google Scholar]
- 53. Egger M, Davey Smith G, Schneider M, Minder C (1997) Bias in meta-analysis detected by a simple, graphical test. BMJ 315: 629–634. [DOI] [PMC free article] [PubMed] [Google Scholar]
- 54. Liu DZ, Wang F, Wang QS, Guo XT, Xu H, et al. (2012) Association of Glutathione S-Transferase M1 Polymorphisms and Lung Cancer Risk in a Chinese Population. Clinica Chimica Acta 414: 188–190. [DOI] [PubMed] [Google Scholar]
- 55. Wang N, Wu YJ, Zhou XL, Wu YM (2012) Association Between Genetic Polymorphism of Metabolizing Enzymes and DNA Repairing Enzymes and the Susceptibility of Lung Cancer in Henan Population. Journal of Hygiene Research 41: 251–256. [PubMed] [Google Scholar]
- 56. Li WY, Yue WT, Zhang LN, Zhao XT, Ma L, et al. (2012) Polymorphisms in GSTM1, CYP1A1, CYP2E1, and CYP2D6 are associated with susceptibility and chemotherapy response in non-small-cell lung cancer patients. Lung 190: 91–98. [DOI] [PubMed] [Google Scholar]
- 57. Chen CM, Jin YT, Xu HY, Zhang CY, Zhang H, et al. (2012) Effects of Cyp1A1 and GSTM1 Gene Polymorphisms and Bpde-DNA Adducts On Lung Cancer. Chinese Journal of Medical Genetics 29: 23–27. [DOI] [PubMed] [Google Scholar]
- 58.Yao ZG, Yong E, Wang HY (2012) The Interacted Effects Between Glutathione S-Transferase Gene Polymorphism and Smoking in Lung Cancer. Chinese Journal of Medical Guide 14: : 185–186,188. [Google Scholar]
- 59. Liu JN, Zhou CC, Piao HM, An CS (2012) Relationship Between GSTT1 Genetic Polymorphism, Smoking and Lung Cancer Susceptibility. Basic &Clinical Medicine 32: 1194–1197. [Google Scholar]
- 60. Han RL, Bai TY, Chang FH, Lv XL, Li C, et al. (2012) GSTM1 Gene Polymorphism and Lung Cancer Susceptibility in Man Population. Central South Pharmacy 10: 1–4. [Google Scholar]
- 61. Jin YT, Zhang CY, Xu HY, Xue SL, Wang YS, et al. (2011) Combined Effects of Serum Trace Metals and Polymorphisms of Cyp1A1 Or GSTM1 On Non-Small Cell Lung Cancer: A Hospital Based Case-Control Study in China. Cancer Epidemiology 35: 182–187. [DOI] [PubMed] [Google Scholar]
- 62. Ai C (2011) Discuss the Influences of GSTM1 Gene Polymorphism of Lung Cancer. Contemporary Medicine 17: 50. [Google Scholar]
- 63.Zhang JQ, Long XY, Xiong GS, Fang LZ, Zhao ZH, et al. (2011) The Relationship Between Glutathione S-Transferase M1 and Susceptibility to Xuanwe's Lung Cancer. Journal of Kunming Medical University 32: 56–58,67.
- 64. Du GB, Ma DY, Tan BX, Liu M, Zhao YL, et al. (2011) Relationship Between Genetic Polymorphism of GSTM1 Gene and Susceptibility to Lung Cancer in the Population of Northern Sichuan of China. Chinese Clinical Oncology 16: 602–605. [Google Scholar]
- 65. Li Y, Chen J, Gao YX (2011) Influence of Smoking and the Polymorphisms of Cyp1A1 and GSTM1 On the Susceptibility of Lung Cancer. Journal of Chinese Practical Diagnosis and Therapy 25: 140–143. [Google Scholar]
- 66. Bai TY, Chang FH, Wang MJ, Wang G, Zhang S (2011) Relationship Between GSTT1 and Cyp1A1 Genetic Polymorphisms and Lung Cancer Susceptibility. Chinese Journal of Public Health 27: 723–725. [Google Scholar]
- 67. Jin YT, Xu HY, Zhang CY, Kong YM, Hou Y, et al. (2010) Combined Effects of Cigarette Smoking, Gene Polymorphisms and Methylations of Tumor Suppressor Genes On Non Small Cell Lung Cancer: A Hospital-Based Case-Control Study in China. BMC Cancer 10: 422. [DOI] [PMC free article] [PubMed] [Google Scholar]
- 68. Zheng DJ, Hua F, Mei CR, Wan HT, Zhou QH (2010) Association Between GSTM1 Genetic Polymorphism and Lung Cancer Risk by Sybr Green I Real-Time Pcr Assay. Chinese Journal of Lung Cancer 13: 506–510. [DOI] [PMC free article] [PubMed] [Google Scholar]
- 69. Zhu XX, Hu CP, Gu QH (2010) Cyp1 a1 Polymorphisms, Lack of Glutathione S-Transferase M1 (GSTM1), Cooking Oil Fumes and Lung Cancer Risk in Non-Smoking Women. Chinese Journal of Tuberculosis and Respiratory Diseases 33: 817–822. [PubMed] [Google Scholar]
- 70. Fan J, Gan LG, Liang KC, Liang XM (2010) Relationship of GSTM1 and GSTT1 Genetic Polymorphisms with Lung Cancer Susceptibility in Guangxi Zhuang Population. Journal of Oncology 16: 922–925. [Google Scholar]
- 71. Chang FH, Wang MJ, Qi J, Yin Q, Fan L, et al. (2009) Genetic Polymorphism of T6235C Mutation in 3'Non-Coding Region of Cyp1A1 and GSTM1 Genes and Lung Cancer Susceptibility in the Mongolian Population. Academic Journal of Xi'an Jiaotong University 21: 225–229. [Google Scholar]
- 72. Chen H, Yu ZC, Jin YT, Xue SL, Kong YM, et al. (2008) Influence of Genetic Polymorphism of Cyp1A1 Gene and GSTMl Gene On Lung Cancer. Shandong Medical Journal 48: 20–22. [Google Scholar]
- 73. Liu Q, Liu J, Song B, Wang ZH (2008) Relationship Between Susceptibility to Lung Cancer and Genetic Polymorphism in Cyp1A1 and GSTM1. Shandong Medical Journal 48: 32–34. [Google Scholar]
- 74.Qi XS, Lv HM, Xia Y, Shang B, Sun QF, et al. (2008) A Primary Case-Control Study On the Relationship Between Genetic Polymorphisms of GSTT1 and Lung Cancer Susceptibility to the People Living in High Radon-Exposed Area. China Occupational Medicine 35: : 361–363,367. [Google Scholar]
- 75. Xia Y, Sun QF, Shang B, Lv HM, Feng SZ, et al. (2008) Polymorphisms of the Cytochrome P450 and Glutathione S-Transferase Genes Associated with Lung Cancer Susceptibility for the Residents in High Radon-Exposed Area. Chinese Journal of Radiological Medicine and Protection 28: 327–332. [Google Scholar]
- 76. Gu YF, Zhang ZD, Zhang SC, Zheng SH, Jia HY, et al. (2007) Combined Effects of Genetic Polymorphisms in Cytochrome P450S and GSTM1 On Lung Cancer Susceptibility. National Medical Journal of China 87: 3064–3068. [PubMed] [Google Scholar]
- 77.Wang YS, Jin YT, Xue SL, Yu ZC, Xu YC, et al. (2007) Study On the Methylation of P16 Gene and Genetic Polymorphism of GSTM1 Gene Related with Susceptibility to Non-Small Cell Lung Cancer. Modern Preventive Medicine 34: 1207–1209,1212.
- 78. Lei FM, Li SF, Zhou WD, Luo WH, He JY, et al. (2007) A Case-Control Study of the Impact of Glutathione S-Transferase M1 Polymorphism On the Risk of Lung Cancer. Modern Preventive Medicine 34: 724–726. [Google Scholar]
- 79. Chang FH, Hu TM, Wang G (2006) Relationship Between Cyp1A1 and GSTM1 Genetic Polymorphisms and Lung Cancer Susceptibility in Population of Inner Mongolia. Chinese Journal of Lung Cancer 9: 413–417. [DOI] [PubMed] [Google Scholar]
- 80. Chen HC, Cao YF, Hu WX, Liu XF, Liu QX, et al. (2006) Genetic Polymorphisms of Phase Ii Metabolic Enzymes and Lung Cancer Susceptibility in a Population of Central South China. Disease Markers 22: 141–152. [DOI] [PMC free article] [PubMed] [Google Scholar]
- 81. Li Y, Chen J, He X, Gao SS, Fan ZM, et al. (2006) Cyp1A1 and GSTM1 Polymorphisms and Susceptibility to Lung Cancer. Journal of Zhengzhou Univeristy(Medical Sciences) 41: 1061–1064. [Google Scholar]
- 82. Yao W, Wang N, Wu YJ, Wu YM (2006) Relationship Between Deletion of GSTM1, GSTT1 Genes and Susceptibility to Lung Cancer. Chinese Journal of Public Health 22: 1070–1072. [Google Scholar]
- 83. Qian BY, Han HW, Gu F, He M, Li HX, et al. (2006) Case-Control Study Genetic Polymorphism in Cyp1A1 and GSTM1 and Smoking and Susceptibility to Lung Cancer. Chinese Journal of Clinical Oncology 33: 500–502. [Google Scholar]
- 84. Wang Q, Lu QL, Zhen HN, Bao M, Zhang HJ (2006) Relationship Between Cyp2C9 and Gst M1 Genetic Polymorphism and Lung Cancer Susceptibility. Cancer Research On Prevention and Treatment 33: 8–10. [Google Scholar]
- 85.He DX, Chan Y (2006) The Relationship of GSTT1 Polymorphism and Chromosome 15 Aberration in Lung Cancer Patients. Cancer Research On Prevention and Treatment 33: : 308–310,383. [Google Scholar]
- 86. Chan EC, Lam SY, Fu KH, Kwong YL (2005) Polymorphisms of the GSTM1, Gstp1, Mpo, Xrcc1, and Nqo1 Genes in Chinese Patients with Non-Small Cell Lung Cancers: Relationship with Aberrant Promoter Methylation of the Cdkn2a and Rarb Genes. Cancer Genetics and Cytogenetics 162: 10–20. [DOI] [PubMed] [Google Scholar]
- 87. Yuan TZ, Zhou QH, Zhu W, Guo ZL, Li DY, et al. (2005) Relationship Between Genetic Polymorphism of GSTT1 Gene and Inherent Susceptibility to Lung Cancer in Han Population in Sichuan, China. Chinese Journal of Lung Cancer 8: 107–111. [DOI] [PubMed] [Google Scholar]
- 88. Li DR, Zhou QH, Yuan TZ, Guo ZL, Zhu W, et al. (2005) Study On the Association Between Genetic Polymorphism of Cyp2E1, GSTM1 and Susceptibility of Lung Cancer. Chinese Journal of Lung Cancer 8: 14–19. [DOI] [PubMed] [Google Scholar]
- 89. Ye WY, Chen SD, Chen Q (2005) Interaction Between Serum Selenium Level and Polymorphism of GSTM1 in Lung Cancer. Acta Nutrimenta Sinica 27: 17–20. [Google Scholar]
- 90. Chou YC, Wu MS, Wu CC, Yang T, Chu CM, et al. (2005) Total Urinary Isothiocyanates, Glutathione S-Transferase M1 Genotypes, and Lung Cancer Risk: A Preliminary Nested Case-Control Study in Taiwan. J Med Sci 25: 021–026. [Google Scholar]
- 91. Liang GY, Pu YP, Yin LH (2004) Studies of the Genes Related to Lung Cancer Susceptibility in Nanjing Han Population, China. Hereditas(Beijing) 26: 584–588. [PubMed] [Google Scholar]
- 92. Yang XR, Wacholder S, Xu Z, Dean M, Clark V, et al. (2004) Cyp1A1 and GSTM1 Polymorphisms in Relation to Lung Cancer Risk in Chinese Women. Cancer Letters 214: 197–204. [DOI] [PubMed] [Google Scholar]
- 93. ChanYeung M, TanUn KC, Ip MSM, Tsang KWT, Ho SP, et al. (2004) Lung Cancer Susceptibility and Polymorphisms of Glutathione-S-Transferase Genes in Hong Kong. Lung Cancer 45: 155–160. [DOI] [PubMed] [Google Scholar]
- 94. Lan Q, He XZ (2004) Molecular Epidemiological Studies On the Relationship Between Indoor Coal Burning and Lung Cancer in Xuan Wei, China. Toxicology 198: 301–305. [DOI] [PubMed] [Google Scholar]
- 95. Gu YF, Zhang SC, Lai BT, Wang H, Zhan XP (2004) Relationship Between Genetic Polymorphism of Metabolizing Enzymes and Lung Cancer Susceptibility. Chinese Journal of Lung Cancer 7: 112–117. [DOI] [PubMed] [Google Scholar]
- 96. Dong CT, Yang Q, Wang MZ, Dong QN (2004) A Study On the Relationship Between Polymorphism of Cyp1A1, Lack of GSTM1 and Susceptibility to Lung Cancer. Journal of Environmental and Occupational Medicine 21: 440–442. [Google Scholar]
- 97.Luo CL, Qing C, Cao WF, Chen SD (2004) Combined Analysis of Polymorphisms of GSTM1 and Mutations of P53 Gene in the Patients with Lung Cancer. Chinese Journal of Clinical Oncology 31: : 1218–1220,1224. [Google Scholar]
- 98. Cao YF, Chen HC, Liu XF, Liu QX, Zhang J, et al. (2004) Study On the Relationship Between the Genetic Polymorphisms of GSTM1 and GSTT1 Genes and Lung Cancer Susceptibility in the Population of Hunan Province of China. Life Science Research 8: 126–132. [Google Scholar]
- 99. Chen SD, Zeng M, Li ZB, Wang BG, Chen MX, et al. (2004) A Case Control Study On the Impact of Cyp2E1 and Gst-M1 Polymorphisms On the Risk of Lung Cancer. Tumor 24: 99–103. [PubMed] [Google Scholar]
- 100. Huang XH, Chen SD, Wang BG, Zhou WP, Cai XL (2004) Study On the Impact of GSTM1 Polymorphisms On the Risk of Histologic Types of Lung Cancer: A Case-Control Study. Journal of Public Health and Preventive Medicine 15: 24–26. [Google Scholar]
- 101. Ye WY, Chen Q, Chen SD (2004) Study On Relationship Between GSTM1 Polymorphism, Diet Factors and Lung Cancer. Chinese Journal of Public Health 20: 1120–1121. [Google Scholar]
- 102. Wang JW, Deng YF, Cheng JL, Ding JM, Tokudome S (2003) Gst Genetic Polymorphisms and Lung Adenocarcinoma Susceptibility in a Chinese Population. Cancer Lett 201: 185–193. [DOI] [PubMed] [Google Scholar]
- 103. Wang JW, Deng YF, Li L, Kuriki K, Ding JM, et al. (2003) Association of GSTM1, Cyp1A1 and Cyp2E1 Genetic Polymorphisms with Susceptibility to Lung Adenocarcinoma: A Case-Control Study in Chinese Population. Cancer Sci 94: 448–452. [DOI] [PMC free article] [PubMed] [Google Scholar]
- 104. Chen LJ, Sun HL, Xu YQ (2003) Study On the Allele Frequency of GSTM1 Gene in Normal Han Population in Wan-Nan Area and the Relationship Between GSTM1 Genotype and the Risk of Lung Cancer. Acta Academiae Medicinae Wannan 22: 13–16. [Google Scholar]
- 105. Li WY, Lai BT, Zhan XP (2003) Polymorphism of Metabolic Enzyme Genes Associated with Lung Cancer Susceptibility. Tuberculosis and Thoracic Tumor 4: 280–286. [Google Scholar]
- 106. Lu WF, Xing DY, Qi J, Tan W, Miao XP, et al. (2002) Genetic Polymorphism in Myeloperoxidase but Not GSTM1 is Associated with Risk of Lung Squamous Cell Carcinoma in a Chinese Population. Int J Cancer 102: 275–279. [DOI] [PubMed] [Google Scholar]
- 107. Qiao GB, Wu YL, Zeng WS, Jiang RC, Wang SY, et al. (2002) Case-Control Study of GSTM1 Gene Deletion and Non-Small Cell Lung Cancers. Academic Journal of Sun Yat-Sen University of Medical Sciences 23: 25–27. [Google Scholar]
- 108. Zhang LZ, Wang X, Hao XZ, Shi YX, Liu ZH (2002) Relationship Between Susceptibility to Lung Cancer and Genetic Polymorphism in P4501a1, GSTM1. Chinese Journal of Clinical Oncology 29: 536–540. [Google Scholar]
- 109. Shi Y, Zhou XW, Zhou YK, Ren S (2002) Analysis of Cyp2E1, GSTM1 Genetic Poi Ymorphismsin Relation to Human Lung Cancer and Esophageal Carcinoma. Journal of Huazhong University of Science and Technology(Health Sciences) 31: 14–17. [Google Scholar]
- 110. Zhang JK, Hu YL, Hu CF, Wang SY (2002) Relationship Between Genetic Polymorphisms of GSTM1 as Well as GSTT1 and Lung Cancer. Chinese Journal of Pathophysiology 18: 352–355. [Google Scholar]
- 111. Zhang JK, Hu YL, Hu CF, Wang SY (2002) Study On Genetic Polymorphisms of GSTM1 and GSTT1 Related with Inherent Susceptibility to Lung Cancer in Women. China Public Health 18: 273–275. [Google Scholar]
- 112. Xin Y, Wang X, Wang XY, Liang ZQ (2002) A Study of Genetic Polymorphism of GSTM1 Gene in Normal Population and Lung Cancer Population in Yunnan. Journal of Yunan Normal University (Natural Sciences Edition) 22: 52–54. [Google Scholar]
- 113. Cheng YW, Hsieh LL, Lin PP, Chen CP, Chen CY, et al. (2001) Gender Difference in Dna Adduct Levels Among Nonsmoking Lung Cancer Patients. Environ Mol Mutagen 37: 304–310. [DOI] [PubMed] [Google Scholar]
- 114. Chen SQ, Xue KX, Xu L, Ma GJ, Wu JZ (2001) Polymorphisms of the Cyp1A1 and GSTM1 Genes in Relation to Individual Susceptibility to Lung Carcinoma in Chinese Population. Mutat Res 458: 41–47. [DOI] [PubMed] [Google Scholar]
- 115. London SJ, Yuan JM, Chung FL, Gao YT, Coetzee GA, et al. (2000) Isothiocyanates, Glutathione S-Transferase M1 and T1 Polymorphisms, and Lung-Cancer Risk: A Prospective Study of Men in Shanghai, China. Lancet 356: 724–729. [DOI] [PubMed] [Google Scholar]
- 116. Cheng YW, Chen CY, Lin P, Huang KH, Lin TS, et al. (2000) DNA Adduct Level in Lung Tissue May Act as a Risk Biomarker of Lung Cancer. Eur J Cancer 36: 1381–1388. [DOI] [PubMed] [Google Scholar]
- 117. Lan Q, He XZ, Costa D, Tian LW, Lu XB, et al. (1999) Glutathione S-Transferase GSTM1 and GSTT1 Genotypes and Susceptibility to Lung Cancer. Journal of Hygiene Research 28: 9–11. [PubMed] [Google Scholar]
- 118. Gao Y, Zhang Q (1999) Polymorphisms of the GSTM1 and Cyp2D6 Genes Associated with Susceptibility to Lung Cancer in Chinese. Mutat Res 444: 441–449. [DOI] [PubMed] [Google Scholar]
- 119. Chen SQ, Xu L, Ma GJ, Wu JZ, Xue KX (1999) Identification of Genetic Polymorphism of Cyp1A1 and GSTM1 in Lung Cancer Patients by Using Allele—Specific PCR and Multiplex Differential Pcr. Carcinogenesis,Teratogenesis & Mutagenesis 11: 119–121. [Google Scholar]
- 120. Gao JR, Zhang Q (1998) Study On the Relationship Between GSTM1 Polymorphism and Lung Cancer Susceptibility. Carcinogenesis, Teratogenesis & Mutagenesis 10: 149–151. [Google Scholar]
- 121. Qu YH, Shi YB, Zhong LJ, Sun L, Sun XW, et al. (1998) The Genotypes of Cytochrome P450 1a1 and GSTM1 in Nonsmoking Female Lung Cancer. Tumor 18: 80–82. [Google Scholar]
- 122. Sun GF, Shimojo N, Pi J, Lee S, Kumagai Y (1997) Gene Deficiency of Glutathione S-Transferase Mu Isoform Associated with Susceptibility to Lung Cancer in a Chinese Population. Cancer Lett 113: 169–172. [DOI] [PubMed] [Google Scholar]
- 123. Ge H, Lam WK, Lee J, Wong MP, Yew WW, et al. (1996) Analysis of L-myc and GSTM1 genotypes in Chinese non-small cell lung carcinoma patients. Lung Cancer 15: 355–366. [DOI] [PubMed] [Google Scholar]
- 124. Sun GF, Pi JB, Zheng QM, Zheng QM, Harada B, et al. (1995) Study on relationship between Glutathione S-transferase μ gene deficiency and Lung cancer. Chinese Journal Tuberculosis and Respiratory Diseases 18: 167–169. [Google Scholar]
- 125. Trikalinos TA, Salanti G, Khoury MJ, Ioannidis JP (2006) Impact of violations and deviations in Hardy-Weinberg equilibrium on postulated gene-disease associations. Am J Epidemiol 163: 300–309. [DOI] [PubMed] [Google Scholar]
Associated Data
This section collects any data citations, data availability statements, or supplementary materials included in this article.
Supplementary Materials
PRISMA checklist.
(DOC)
Map of the seven regions in China.
(TIF)