Abstract
Protein hydration shell dynamics play an important role in biochemical processes including protein folding, enzyme function, and molecular recognition. We present here a comparison of the reorientation dynamics of individual water molecules within the hydration shell of a series of globular proteins: acetylcholinesterase, subtilisin Carlsberg, lysozyme, and ubiquitin. Molecular dynamics simulations and analytical models are used to access site-resolved information on hydration shell dynamics and to elucidate the molecular origins of the dynamical perturbation of hydration shell water relative to bulk water. We show that all four proteins have very similar hydration shell dynamics, despite their wide range of sizes and functions, and differing secondary structures. We demonstrate that this arises from the similar local surface topology and surface chemical composition of the four proteins, and that such local factors alone are sufficient to rationalize the hydration shell dynamics. We propose that these conclusions can be generalized to a wide range of globular proteins. We also show that protein conformational fluctuations induce a dynamical heterogeneity within the hydration layer. We finally address the effect of confinement on hydration shell dynamics via a site-resolved analysis and connect our results to experiments via the calculation of two-dimensional infrared spectra.
Introduction
The hydration shell of a protein is known to have a critical influence on protein structure and function. In particular, the dynamic properties of the hydration shell play a role in biochemical processes including protein folding, enzyme function, and molecular recognition.1−3 A complete understanding of such processes therefore requires a detailed picture of protein hydration shell dynamics.
It has been shown both by experiments4−16 and simulations1,17−27 that the proximity of a biomolecule such as a protein perturbs water dynamics in its hydration shell. However, our understanding of this perturbation remains incomplete, and questions such as the magnitude and molecular origins of the perturbation are still actively discussed. Some studies, including, e.g., NMR5,6 and molecular dynamics25,26 results, indicate that, for the majority of the hydration shell, the water reorientation dynamics is moderately slowed down, by a factor of 2–3, compared to bulk water. This is in contrast to, e.g., time-resolved fluorescence spectroscopy,7,28 which suggests that a significant proportion of the water population is slowed down by at least an order of magnitude. In addition to the magnitude of the slowdown, its molecular origin is still not well established. The distribution of the retardation factor is known to be heterogeneous across the protein surface,8,10,25,29 and a complete understanding of this heterogeneity requires spatially resolved information on hydration shell dynamics, which to date has come from fluorescence spectroscopy,8,30 from NMR experiments,31 and from molecular dynamics studies.19,20,25−27,32 One such site-resolved computational study by one of us25 has shown that, for most water molecules within the hydration shell of the protein lysozyme, the dynamical perturbation is mainly due to an excluded volume effect dependent on local surface topology. A question then arises regarding the generality of conclusions drawn from a study of the hydration shell of any one protein.
Here, we expand the previous study of reorientational hydration shell dynamics recently presented for the enzyme lysozyme25 to three other proteins with very different sizes and functions, acetylcholinesterase, subtilisin Carlsberg, and ubiquitin, in order to examine the applicability of our previous results to any given protein. We use molecular dynamics simulations to access site-resolved information on hydration shell dynamics via a decomposition of the protein surface into sites of different chemical nature. We elucidate the molecular origins of the perturbation induced by each protein, using a theoretical framework previously established for water dynamics next to solutes, including proteins.25,33,34 We then go on to discuss the applicability of our conclusions to globular proteins in general, and to explore the effect of protein conformational fluctuations on hydration shell dynamics.
An understanding of the effect of confinement on protein hydration shell dynamics is also required, in order to provide a link between the dilute conditions employed in many experimental and theoretical studies and the macromolecular crowding conditions relevant for in vivo processes, as well as a link to results from those experimental techniques which employ high protein concentrations or conditions of confinement (see, e.g., refs (29, 31, and 35)). We study here the effect of confinement on hydration shell dynamics via solvation of a partially hydrated protein in an organic apolar solvent, and establish an additional link to experiment via the calculation of two-dimensional infrared (2D-IR) spectra for the water stretch vibration.
The outline of the paper is as follows. First, we provide details of the simulation protocols followed and of the extended jump model,36 the theoretical framework used to analyze water dynamics. Next, we present a comparison of hydration shell dynamics for the four protein systems in aqueous solution, addressing both spatial and dynamical heterogeneities within the hydration layer and their molecular origin. The following section discusses the effect of confinement on hydration shell dynamics, before we end with concluding remarks.
Methodology
Simulation Details
We performed molecular dynamics simulations of dilute aqueous solutions of four globular proteins, which cover a wide range of functions and molecular weights. This includes three enzymes: acetylcholinesterase (59 kDa), an esterase whose biological role is to break down the neurotransmitter acetylcholine, subtilisin Carlsberg (27 kDa), a serine protease (i.e., an enzyme that hydrolyzes peptidic bonds), and lysozyme (14 kDa), a glycoside hydrolase that breaks glycosidic bonds in bacterial cell walls.37 The fourth system is a regulatory protein, ubiquitin (9 kDa), which tags proteins for destruction and also directs protein transport.37,38 This choice was motivated by prior studies of hydration dynamics around these systems which employed different techniques and led to some conflicting conclusions,5,7,23−25,27,31,35 and by the wide range of functions and sizes covered by these four proteins. Table 1 lists some of their key structural properties, and Figure 1 shows the great heterogeneity of their surface charge distributions.
Table 1. Protein Molecular Weight, Secondary Structure in Terms of Helical and β-Sheet Composition, Surface Composition in Terms of the Total Time-Averaged OH-Bond Population of the Hydrophobe, H-Bond Donor or H-Bond Acceptor Sites, and Total Charge.
| secondary
structure |
relative OH-bond population |
||||||
|---|---|---|---|---|---|---|---|
| molecular weight (kDa) | helical | β-sheet | hydrophobe | donor | acceptor | total charge | |
| ubiquitin | 9 | 23% | 34% | 68% | 15% | 17% | 0 |
| lysozyme | 14 | 40% | 10% | 72% | 15% | 13% | +8 |
| subtilisin Carlsberg | 27 | 28% | 19% | 71% | 13% | 16% | –1 |
| acetylcholinesterase | 59 | 36% | 17% | 74% | 14% | 12% | –9 |
Figure 1.
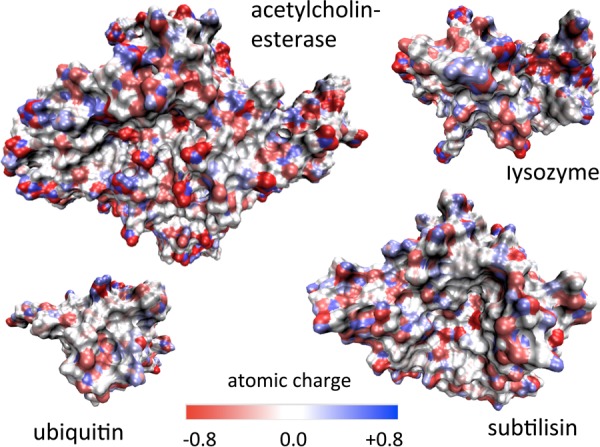
Mapping of atomic charge distribution onto the protein surface, for the four investigated systems.
The initial protein configurations were obtained from the crystallographic structures with PDB codes 4ARA (acetylcholinesterase), 1SCN (subtilisin Carlsberg), 2LYM (lysozyme), and 1UBQ (ubiquitin). Each protein was solvated in a simulation box adapted to its size, containing between 4982 water molecules for ubiquitin, the smallest protein, and 28626 water molecules for acetylcholinesterase, the largest, corresponding to effective concentrations in the millimolar range, respectively, 1.8, 5.6, 5.3, and 10.3 mM for acetylcholinesterase, subtilisin, lysozyme, and ubiquitin. The proteins were described using the CHARMM22 force field with CMAP corrections.39 The water force field was SPC/E40 for lysozyme, subtilisin, and acetylcholinesterase systems and TIP4P/200541 for the ubiquitin system. These water force fields were chosen because they have been shown to correctly reproduce the dynamics of water at room temperature.36,42 However, of the two water models, only TIP4P/2005 provides a qualitatively correct description of water’s phase diagram.41 TIP4P/2005 was therefore used in one protein system in order to open the way to a future study of the temperature dependence of protein hydration shell dynamics. Since the comparison between results for the different proteins studied here is made via the ratio of hydration shell and bulk values, meaningful comparisons can be obtained from these different water models.
Simulations were performed using NAMD43 with periodic boundary conditions, at densities determined via equilibration in the NPT ensemble. Long-range electrostatics were treated using the particle mesh Ewald method. Switching functions were applied to nonbonded interactions from 10 Å, with a cutoff of 12 Å. Bonds between hydrogen and heavy atoms were constrained using the SHAKE and SETTLE algorithms. Simulations with pressure control used the Nosé–Hoover Langevin piston with a piston period of 100 fs and a damping time scale of 50 fs. Simulations with temperature control used the Langevin thermostat with a damping coefficient of 1 ps–1. All systems were equilibrated in the NPT ensemble at 300 K and 1 atm for at least 0.5 ns, followed by equilibration in the NVT ensemble at 300 K for at least 1 ns. Finally, production runs were between 4 and 20 ns long. Coordinates were output every 100 fs. Production runs for lysozyme, subtilisin, and acetylcholinesterase systems were in the NVT ensemble at 300 K with a 2 fs time step. The production run for the ubiquitin system was in the NVE ensemble with a 1 fs time step, and the resulting average temperature was 300 ± 2 K. Again, this difference was due to the use of the ubiquitin system in a temperature-dependence study.
We also studied the effect of confinement on hydration shell dynamics using systems containing subtilisin Carlsberg in hexane solvent at three hydration levels. Simulation details were identical to those for subtilisin in aqueous solution. The hexane molecules were described using standard CHARMM parameters.39
Analysis of Water Dynamics
We analyze the molecular dynamics trajectories to provide a site-resolved analysis of water reorientational dynamics in the protein hydration shell, as outlined below.
We focus on the dynamics of individual water molecules and monitor the reorientation of a water molecule by following the dynamics of the water OH-bond vector u, via the second-order Legendre polynomial time-correlation function (tcf)33
| 1 |
This is related to experimentally accessible values, namely, anisotropy decays from ultrafast infrared spectroscopy, and orientation relaxation times from magnetic relaxation techniques.33 After a sub-picosecond decay due to fast librational relaxation, the reorientational tcf is monoexponential for homogeneous systems such as bulk water at ambient temperature,33 while non-monoexponentiality is an indication of heterogeneity in the water dynamics. For tcf’s calculated for a subset of water molecules with homogeneous water dynamics, the reorientation time τreor can be extracted via an exponential fit, performed here over the interval 2–10 ps in order to avoid contributions at short times from librational motions, and contributions at long times from water molecules which are no longer in the same environment as at the time origin.
The underlying mechanism of bulk water reorientation has been shown to be dominated by hydrogen-bond (H-bond) partner exchange via large-amplitude angular jumps from initial to final H-bond acceptors.33,34 It has been demonstrated that this is true not only in the bulk but also in the hydration shell of a range of solutes,33 including proteins.25 H-bond partner exchange is an activated process, passing through a transition state, and can usefully be seen as a chemical reaction. Jump kinetics can be followed via the cross time-correlation function33 between stable states44 I (initial) and F (final)
| 2 |
where nX = 1 if the OH bond is in stable state X (i.e., forming a stable H-bond with the initial or final acceptor, respectively) and nX = 0 otherwise. Absorbing boundary conditions are used in the product state in order to ensure that only the first jump from each initial H-bond acceptor is considered. The jump time τjump is the inverse of the rate constant for the H-bond exchange process, and can be found by fitting 1 – Cjump(t) with an exponential exp(−t/τjump).36
We perform a site-resolved analysis of hydration shell reorientational dynamics and jump kinetics for each protein system studied here. The spatial resolution is performed as follows. The protein surface is divided into H-bond acceptor, H-bond donor, and hydrophobic sites. The hydration shell is defined as containing all water OH groups that are H-bonded to or within the hydrophobic cutoff of these protein surface sites, with each OH group in the hydration shell being assigned to a particular site at each time step. In cases of ambiguity in the assignment of an OH group, sites are given the priority acceptor > donor > hydrophobe, as this has been shown to be the order of greatest influence on water reorientational dynamics.25 Individual hydrophobic distance or H-bond distance and angle criteria are determined for each protein site from radial distribution functions between water oxygen or hydrogen atoms and amino acid atoms, calculated via molecular dynamics simulations of amino acids in aqueous solution. Typical criteria for the assignment of an OH group to a surface site (and therefore to the hydration shell) are RCO < 4.5 Å for a hydrophobic site and RDA < 3.5 Å, RAH < 2.5 Å, and θHDA < 30° for a H-bond donor or acceptor site, where C is a protein carbon atom, O is a water oxygen atom, A is a H-bond acceptor atom, D is a H-bond donor atom, and H is a hydrogen atom either in the protein or in water. For the calculation of jump tcf’s using eq 2, tighter H-bond criteria are used to define stable H-bond states in the stable state picture.36 Typical values are RDA < 3.0 Å, RAH < 2.0 Å, and θHDA < 20°. We include only the first hydration shell in our analysis, as the perturbation induced by a biomolecule has been shown to fall off rapidly with distance from the surface.17,18,23
Individual reorientational and jump tcf’s are then calculated for the subset of water molecules next to each site at the time origin, and individual reorientation and jump times extracted. Distributions of reorientation and jump times are constructed by weighting each time value by the OH-bond population next to that site. All other site-resolved values and probability distributions in this work are calculated or constructed in the same manner. For each system in aqueous solution, values characterizing bulk water dynamics are extracted from the subset of water molecules which are initially farther than 15 Å from the protein surface. Typical values of τreorbulk and τjump are 2.5 and 3.3 ps, respectively, at ambient temperature.36
Hydration Shell Dynamics of Four Diverse Globular Proteins in Dilute Aqueous Solution
The reorientational time-correlation function (eq 1) averaged over all water OH groups initially present in the hydration shell is shown in Figure 2 for all four proteins in aqueous solution. It is highly non-monoexponential in each case, revealing the heterogeneity of hydration shell dynamics, i.e., the presence of a broad distribution of relaxation times. One can distinguish two different types of heterogeneity, which we refer to as spatial and dynamical heterogeneity, and which we define as follows. Spatial heterogeneity arises from the chemical heterogeneity (the protein surface has, e.g., charged, polar, and nonpolar groups) and topological heterogeneity (the protein surface contains, e.g., troughs, pockets, and protrusions) of a static protein surface. As shown below, it is the main cause of heterogeneity in protein hydration shell dynamics. Dynamical heterogeneity arises from the dynamic nature of the protein as it samples its conformational space. In other words, a single protein surface site can induce a varying perturbation of water dynamics as the local conformation of the protein surface fluctuates. The following two subsections respectively address these two types of heterogeneity.
Figure 2.
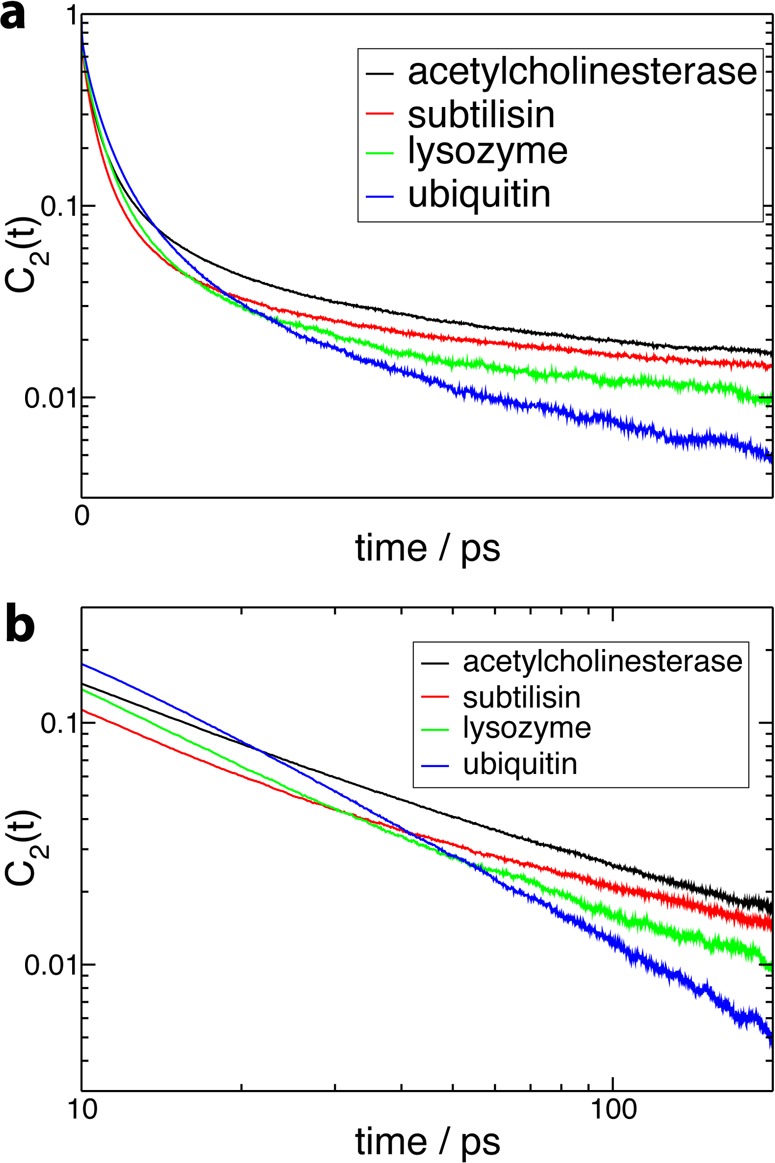
(a) Second-order reorientational time correlation function C2(t) (eq 1) for all OH groups initially in the protein hydration shell, for the four protein systems in aqueous solution. (b) Long-time part of C2(t) on a log–log scale.
Spatial Heterogeneity
Distributions and Mapping
The spatial heterogeneity within a protein hydration shell arises from the great variety of exposed groups and local topologies at the protein surface, which leads to a broad distribution of reorientation slowdown factors ρreor relative to the bulk situation, defined as
| 3 |
This distribution has already been determined in the case of lysozyme,25 and we extend it here to our set of four diverse proteins. For each system, we focus on the first hydration shell, since it has been shown that the perturbation is very limited in the second shell for dilute conditions and only sites with a large charge density induce a perturbation extending beyond the first shell.45 Figure 3 shows that the four distributions are surprisingly similar. They all exhibit the same peak centered on moderate ∼2 slowdown factors and a small amplitude tail at large slowdown factors. The value of the slowdown factor averaged over the fastest 90% water molecules within the hydration layer obtained from our simulations ranges between 1.8 and 2.6 for the four proteins, in good agreement with recent magnetic relaxation dispersion (MRD) studies of three globular proteins, including ubiquitin, also studied here (2.0 at 290 K).5 These moderate slowdown factors are also consistent with a recent 2D-IR study of lysozyme hydration dynamics.10
Figure 3.
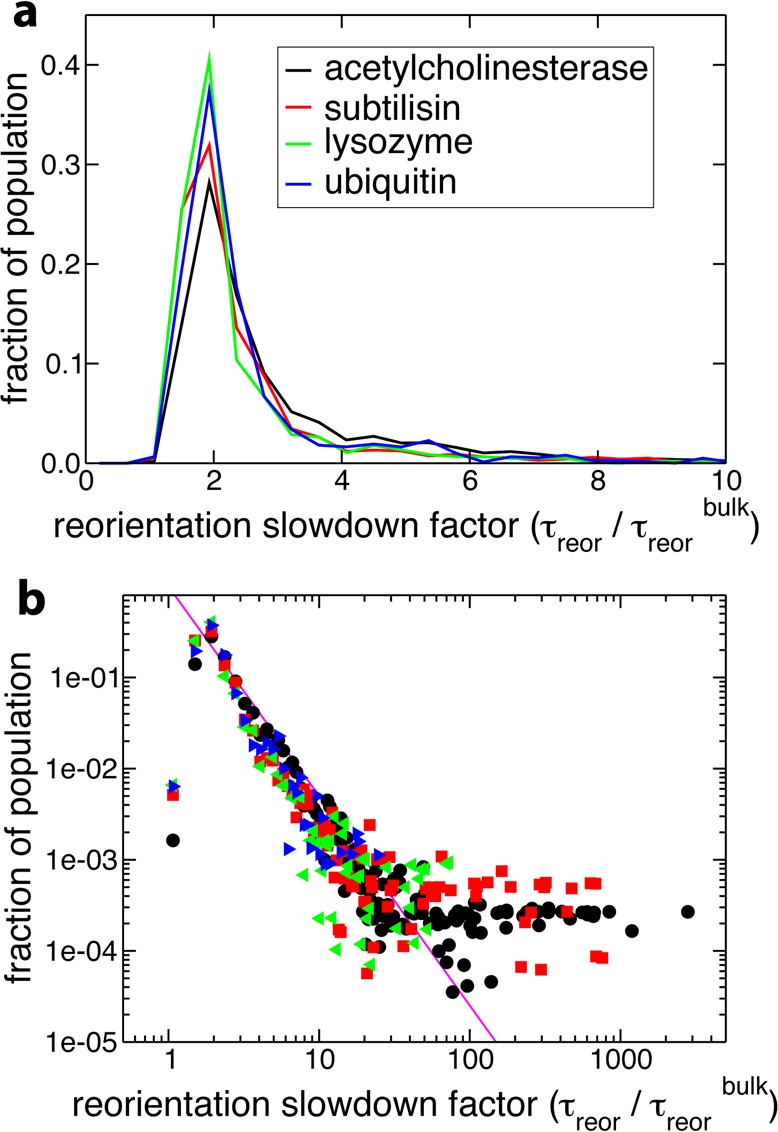
(a) Probability distribution of reorientation slowdown factors (ρreor) (eq 3) in the protein hydration shell, for the four protein systems in aqueous solution. (b) The same distribution on a log–log scale, with the same color scheme for the legend. Also shown is a power law (p(t) ∝ t–α) fit to the tails of the distributions, with exponent α = 2.1.
The lengths of the molecular dynamics trajectories employed to compute the reorientational time-correlation function and the distribution of reorientation slowdown factors range between 4 and 20 ns, which is not sufficient to sample the full conformational space of these proteins. The impact of conformational fluctuations on hydration dynamics will be analyzed in detail below, but the comparison of results obtained respectively from two independent 20 ns simulations and from a shorter 4 ns run of lysozyme (Figure 4) shows that the 4 ns trajectory already provides a reliable determination of these quantities and that the results are very similar for two independent trajectories. Therefore, the differences observed in the results for the four proteins in Figures 2 and 3 do not originate from simulation variability.
Figure 4.
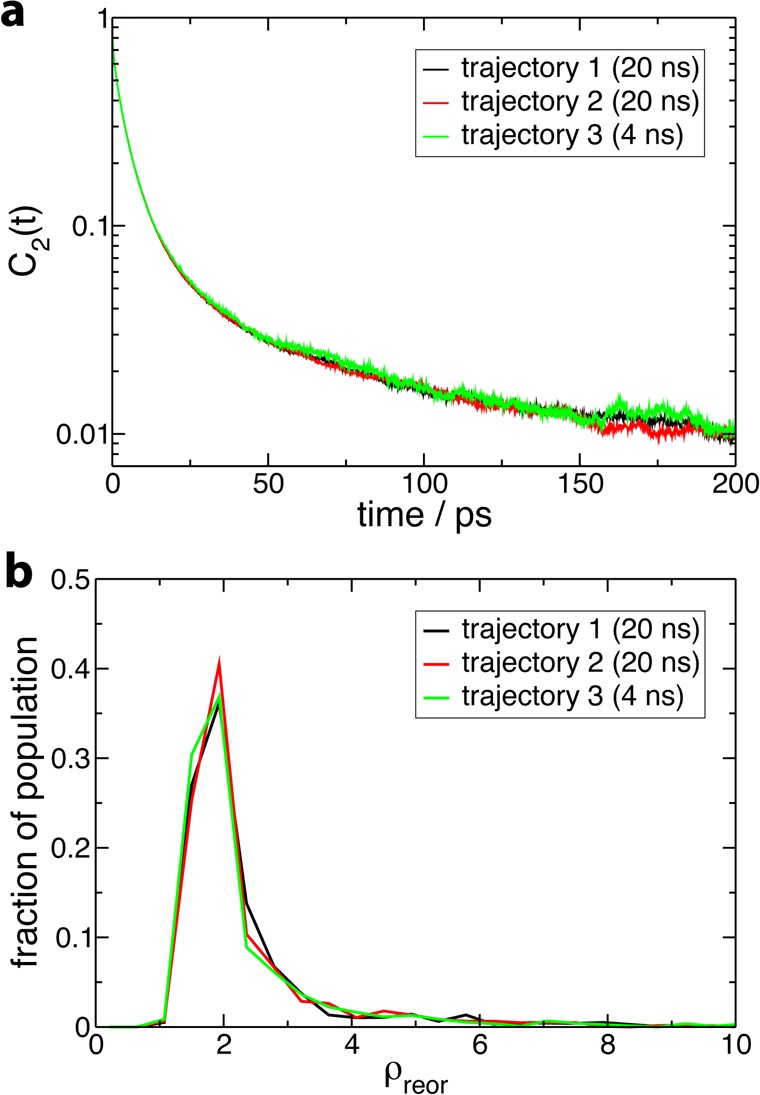
Assessment of simulation convergence illustrated for the case of lysozyme by comparing results respectively obtained from two independent 20 ns trajectories and from a shorter 4 ns trajectory for (a) the second-order reorientational time correlation function C2(t) (see Figure 2) and (b) the probability distribution of reorientation slowdown factors ρreor (see Figure 3).
Prior MD studies20,27 focusing on the mean residence time (MRT) of a water molecule within the protein hydration shell and an MRD investigation of water rotational dynamics5 have suggested that the distribution of water relaxation times within protein hydration shells can be described by a power law, p(t) ∝ 1/tα.5,20,27 The α exponent of such a power-law fit was, for example, used to compare hydration shell dynamics across different proteins.5 An MRD study of dilute aqueous solutions of three globular proteins (ubiquitin, bovine pancreatic trypsin inhibitor, and β-lactoglobulin) yielded α values ranging from 2.1 to 2.3,5 while a ∼2.3 exponent was found for the MRT distribution computed for cytochrome c.20,46 However, the MRT distribution from MD simulations of acetylcholinesterase yielded a much smaller power-law exponent of 0.84,27 which would indicate a much broader distribution of MRT. Since acetylcholinesterase is much larger than the proteins in the other studies listed above (see Table 1), this broader distribution could be caused by a size-dependent effect. However, our study of the reorientation time distributions shows that the acetylcholinesterase case is not different from the three smaller proteins (Figure 3), and a power-law fit of the tail of the reorientation time distribution (excluding internal water molecules) yields an exponent of ∼2.3 ± 0.1 in all four cases. The only difference is that the acetylcholinesterase distribution’s tail exhibits a slightly larger amplitude, as shown by the fraction of hydration shell water molecules whose slowdown factor is greater than 3, which is ∼30% in acetylcholinesterase and ∼20% for the three smaller proteins. We therefore propose that the low 0.84 value found previously for the acetylcholinesterase power-law exponent27 is due to the specific MRT definition used in that work, rather than to the protein size. It has been shown36 that different treatments of the transient escapes from the shell can critically affect the resulting MRT values. Our present reorientation results do not depend on such arbitrary choices and reveal no size-dependent effect over the range 9–59 kDa, apart from the trivial effect due to larger proteins containing more internal waters.
However, is it in fact meaningful to speak of a power law or any underlying analytical form for protein hydration shell dynamics? We first examine the power law 1/tα functional to describe the distribution of reorientation times. Figure 3b shows that a power law is an acceptable fit for intermediate slowdown factors (2 < ρreor < 10). However, the power law diverges at very low slowdown factors, and there is no clear power law behavior at long times in the reorientational tcf for all hydration shell water molecules. For the larger proteins subtilisin and acetylcholinesterase, the growing number of very slow internal water molecules leads to a plateau in the distribution at very large slowdown factor values, which cannot be properly described by a power law. On the basis of mode-coupling theory arguments, another functional that has been suggested to provide a good description of water relaxation dynamics within a protein hydration shell is the stretched exponential function exp[−(t/τ)β] (see, e.g., refs (22 and 47)). Figure 5 shows that a stretched-exponential functional form may appear to give a reasonable fit of the reorientational tcf (eq 1), at least at intermediate time delays. However, the corresponding probability distribution of reorientation times48 (i.e., the Laplace transform of the time decay) bears no resemblance to the distribution calculated explicitly from our simulations (Figure 5). This confirms prior suggestions5,25 and clearly shows that a stretched exponential should only be regarded as a fit without any physical meaning. (The stretched exponential Kohlrausch function was shown to be reached only in the limit of very large wavevectors, i.e., for displacements much smaller than the intermolecular distance.49,50) Therefore, while the stretched exponential and power-law fits remain a useful tool for analysis, our results unambiguously show that the global hydration shell dynamics is predominantly a sum of the dynamics of water molecules individually perturbed by local topological and chemical factors, with no simple underlying analytical form.
Figure 5.
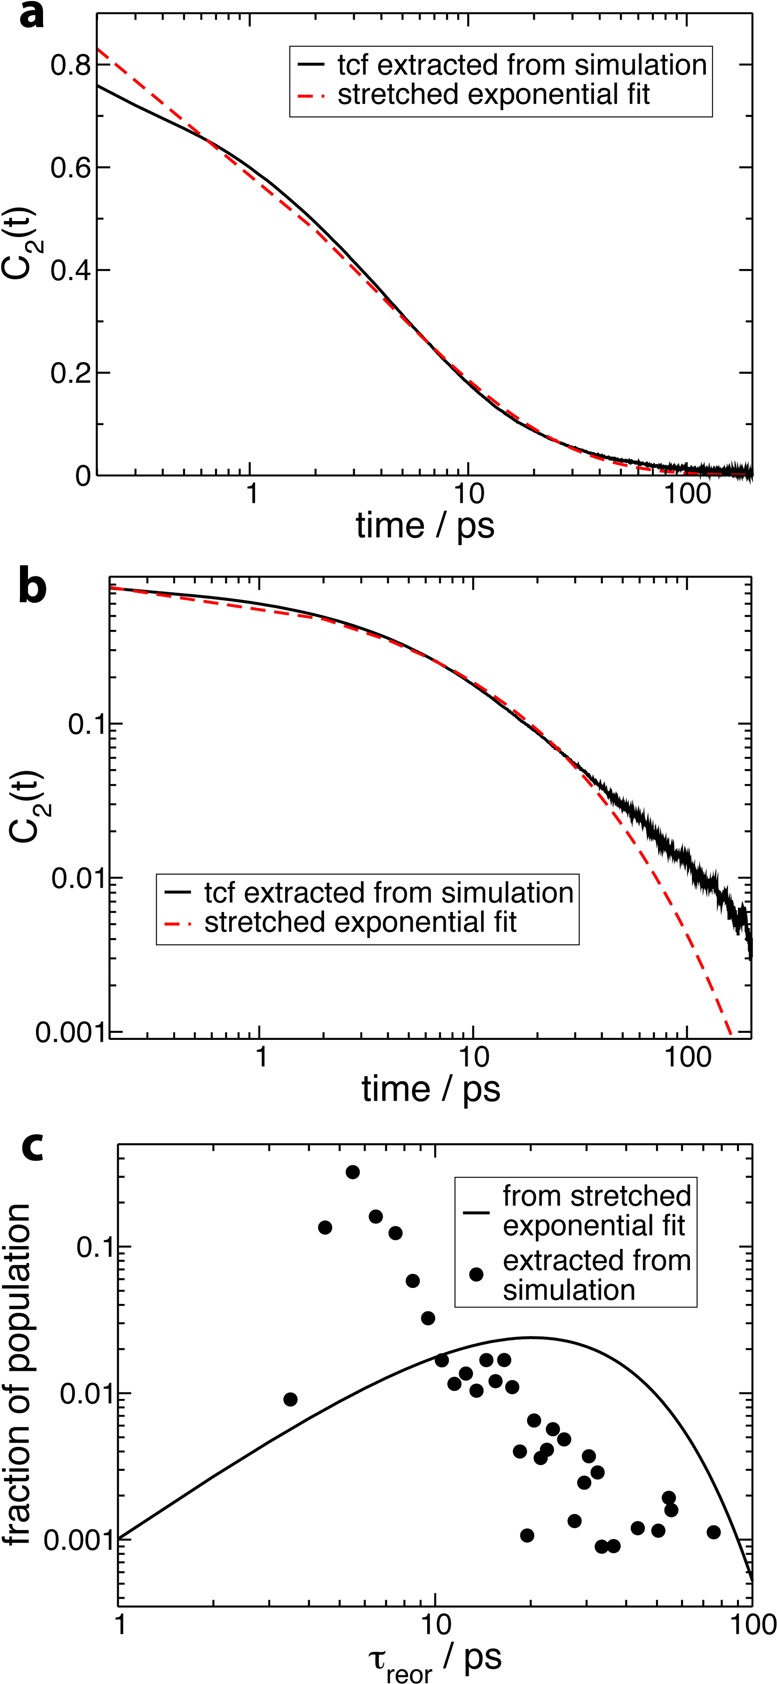
(a) Second-order reorientational time correlation function C2(t) (eq 1) for all OH groups initially in the hydration shell of ubiquitin in aqueous solution, with a stretched exponential fit of the data [functional form exp(−(t/τ)β), fit parameters τ = 3.61 ps, β = 0.51, fit interval between 2 and 50 ps]. (b) The same figure on a log–log scale. (c) The probability distribution of reorientation times in the hydration shell of ubiquitin in aqueous solution extracted directly from simulation and the probability distribution corresponding to the stretched exponential fit shown in parts a and b.
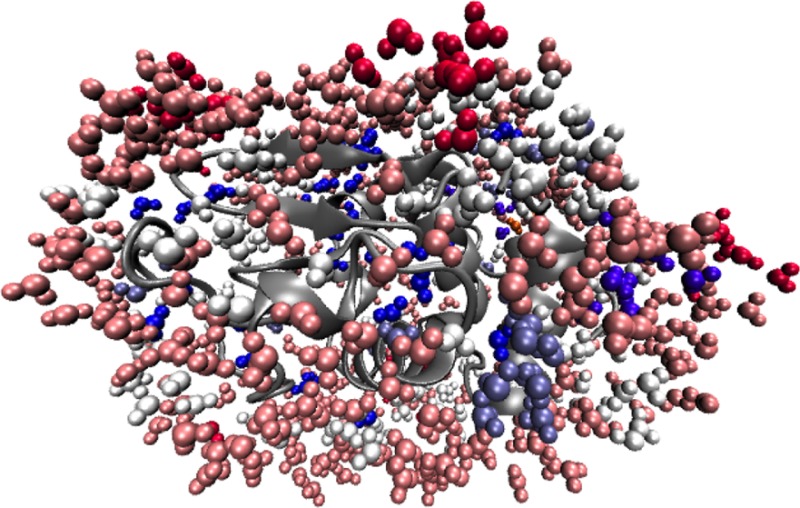
We have also investigated how these different reorientation times are distributed across the exposed surface of the protein. We have mapped individual reorientation times onto the protein surface for all four systems, as shown in Figure 6. Consistently with the distributions in Figure 3, we see that water molecules are moderately retarded throughout most of the hydration layer. More pronounced slowdown factors are observed especially in confined sites, e.g., the enzymatic active sites. We see a fairly uniform distribution of fast and slow dynamics across the hydration shell, with no large regions of similar water dynamics. This is in contrast to the “clustering” of water dynamics observed around one of the proteins, ubiquitin, in a recent NMR NOESY and ROESY study.31 However, we emphasize that these experimental results have been obtained under different conditions, since this technique requires encapsulation of the protein in a reverse micelle, while here the protein is studied in dilute aqueous solution.
Figure 6.
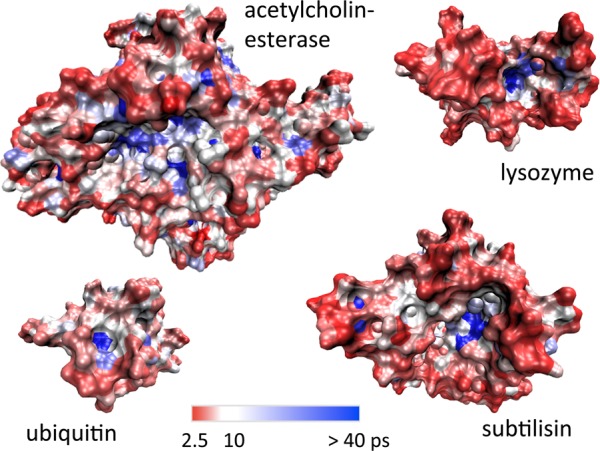
Mapping of reorientation times onto the protein surface, for the four protein systems in aqueous solution.
Our present results can also be compared with those obtained by time-dependent Stokes shift (TDSS) spectroscopy and which suggest a large proportion of the hydration water population to be retarded by up to several orders of magnitude.7 In particular, for subtilisin Carlsberg, also studied here, TDSS experiments have measured a bimodal dynamics in the hydration shell, involving a sub-picosecond component with a 61% amplitude assigned to “bulk-like” water molecules, and a slower (∼38 ps) component with a 39% amplitude assigned to water molecules in strong interaction with the protein.7 The natural chromophore used in these experiments is the tryptophan residue Trp113, around which our present results do not reveal a pronounced slowdown of water dynamics. However, we note that our present study focuses on the dynamics of individual water molecules within the protein hydration layer, while TDSS is sensitive to collective motions affecting several water molecules and possibly of the protein itself, since they all influence the chromophore’s fluorescence energy.2 The large-amplitude slow component in TDSS decays may thus originate from coupled protein–water motions and water molecules displaced by slow conformational rearrangements of the protein.9,51,52
Extended Jump Picture
In order to explain the great similarity in hydration dynamics around proteins whose sizes, secondary structures, functions, and charge distributions are so diverse (see Table 1 and Figure 1), we now analyze the molecular factors governing the distributions of hydration shell dynamics.
In the case of lysozyme, it was recently shown that large angular jumps bring a dominant contribution to the overall reorientation dynamics of water molecules in the great majority of the hydration layer sites.25 We have therefore computed the distribution of jump slowdown factors ρjump, defined as
| 4 |
The jump time τjump is the inverse of the rate constant for the process of H-bond exchange by large-amplitude angular jumps (see the Methodology section). Figure 7 shows that these distributions are qualitatively similar to those of the reorientation slowdown, which suggests that the slowdown in the jumps brings a key contribution to the overall slowdown in hydration shell reorientation dynamics.
Figure 7.
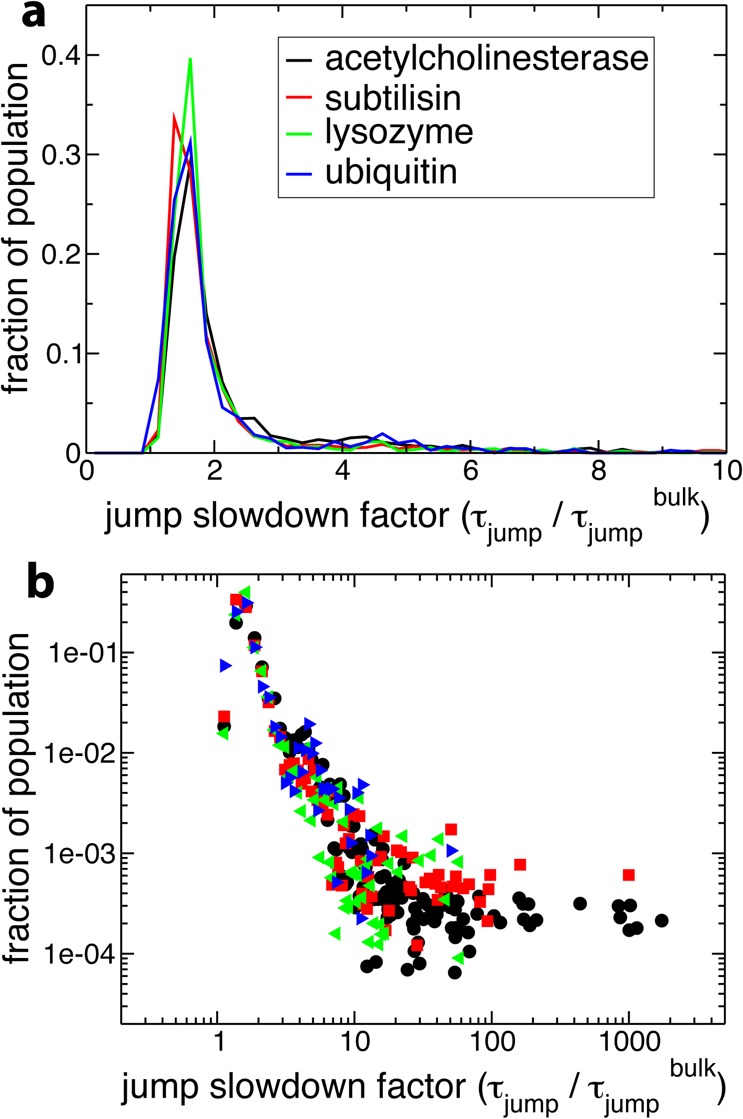
(a) Probability distribution of jump slowdown factors (ρjump) (eq 4) in the protein hydration shell, for the four protein systems in aqueous solution. (b) The same distribution on a log–log scale, with the same color scheme for the legend.
The molecular origins of the jump slowdown can be identified and quantified using a picture considering the transition state for the water H-bond exchange process.33 For water next to hydrophobic sites on the protein surface, reorientation is slowed by the hindrance induced by the protein to the approach of a new H-bond acceptor. This is quantified for each protein site using the transition state excluded volume (TSEV) slowdown factor
| 5 |
where F is the fraction of jump transition state locations excluded by the presence of the protein, i.e., which overlap with the excluded volume of the protein atoms.53 For water hydroxyl groups initially H-bonded to acceptor sites on the protein surface, there is an additional perturbative effect arising from the free energy cost to stretch the initial H-bond with the protein to its transition state length, compared to the same free energy cost for a water–water H-bond. This can lead to a slowdown or an acceleration in reorientational dynamics, when the initial H-bond is respectively stronger or weaker than a water–water H-bond.54 This is referred to as the transition state H-bond (TSHB) effect.54 Finally, for water molecules accepting a H-bond from a donor site on the protein surface, reorientation is slowed via an excluded volume effect, as for water next to hydrophobic sites. Although such H-bonds can also vary in strength, they act on the water oxygen about which the angular jump occurs, and the influence of the resulting torque on the OH reorientational dynamics is negligible. Further details are given in a recent review on water dynamics33 and another on water dynamics in biomolecular hydration shells.2
In the case of lysozyme,25 it has been shown that the slowdown is due primarily to the excluded-volume (TSEV) effect arising from the local protein surface topology, with an additional free energetic effect for the slowest water molecules, related to H-bond acceptor strength (TSHB).25 These observations are used as a basis for understanding the molecular origins of the hydration shell reorientational dynamics of the three additional proteins studied here.
Application of Jump Analysis
Applying the extended jump picture to protein hydration shell dynamics can provide further insights into the nature of the molecular factors which cause the presence of the same two features in the distributions of reorientation times for the four proteins investigated here: a peak at moderate slowdown values and a tail at larger slowdown values.
We first focus on the peak in the distribution at ρreor < 3 (Figure 3), which contains, respectively, 83, 85, 80, and 70% of the hydration shell of ubiquitin, lysozyme, subtilisin, and acetylcholinesterase. Decomposing the ρreor distribution into its contributions arising from water molecules perturbed by protein H-bond acceptors, H-bond donors, and hydrophobic groups shows that the peak corresponds principally to water molecules next to hydrophobic and H-bond donor sites. This is illustrated in Figure 8 for acetylcholinesterase, and similar results are found for the other proteins. Within the extended jump model, for these sites, water reorientation is moderately slowed down relative to bulk dynamics due to an excluded volume effect. The validity of the TSEV model53 is confirmed by Figure 9 which shows a strong correlation between ρjump and the excluded volume slowdown factor ρV for water next to hydrophobic and H-bond donor sites in all four proteins. This ρV factor successfully rationalizes the slowdown for the vast majority of these sites, which in turn make up the majority (83–88%) of the hydration shell population. Deviations from the TSEV prediction occur only for deeply buried hydrophobic sites (values of F, the fraction of excluded transition state locations, close to 1) where the situation is no longer that of a water molecule at the interface between a solute and bulk water and where the TSEV model53 based on the approach of a new H-bond acceptor from the bulk no longer holds true.
Figure 8.
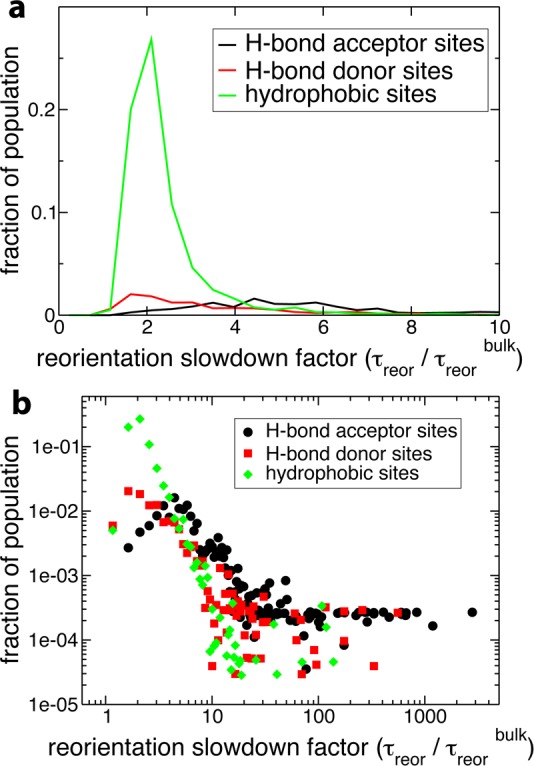
(a) Probability distribution of reorientation slowdown factors (ρreor) (eq 3) in the hydration shell of acetylcholinesterase in aqueous solution, decomposed by site type. Each distribution is weighted by the fraction of the total OH group population which corresponds to that site type. (b) The same distribution on a log–log scale.
Figure 9.
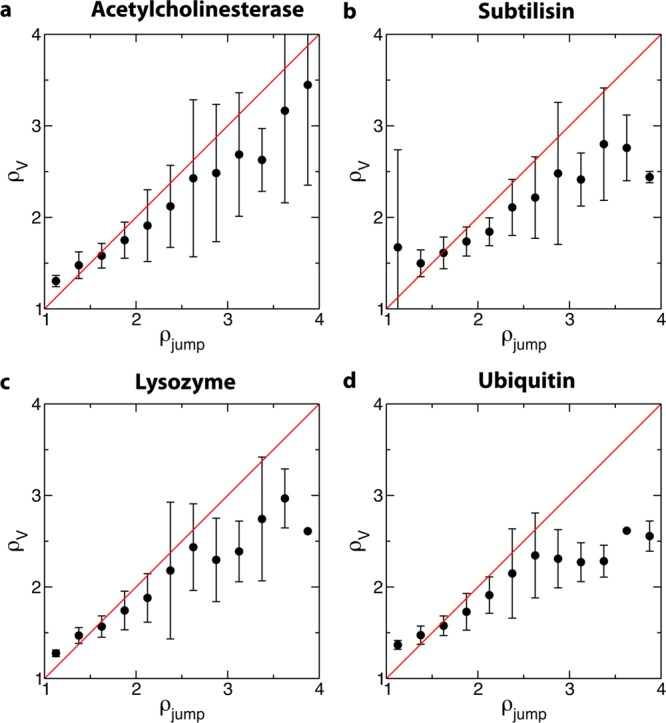
Correlation between ρV, the transition state excluded volume slowdown factor, and ρjump, the slowdown in τjump relative to the bulk calculated directly from simulation, for water OH groups next to hydrophobic and H-bond donor sites for the four proteins in aqueous solution. The plots show the average value of and standard deviation in ρV as a function of ρjump. The red line is f(x) = x.
We now turn to the distribution’s tail (3 < ρreor < 20), which is shown in Figure 8 to be mainly due to water molecules next to moderate to strong H-bond acceptor sites. Within the extended jump picture, these sites retard water reorientation via both the strength of the initial water–protein H-bond and an excluded volume effect.25 Although we do not explicitly quantify this effect here, it has already been shown to successfully rationalize water dynamics next to H-bond acceptor sites in both proteins and individual amino acids.25,54
Finally, the distributions for the larger proteins, acetylcholinesterase and subtilisin, have an even slower, low-amplitude tail (ρreor > 20, see Figure 3b) arising from water molecules in internal or deeply buried sites. This is consistent with the fact that larger proteins are known to contain more internal water molecules.55 These extremely slow sites correspond to ∼2% of the total hydration shell population in acetylcholinesterase and subtilisin and <1% in lysozyme and ubiquitin. The effect of these very slow internal water molecules is also seen in the reorientational tcf’s (Figure 2), where the amplitude of the tcf at long times scales with protein size.
Our analysis thus shows that the distribution of perturbation factors is dominated by an excluded volume effect, determined by local surface topology, i.e., the presence of pockets, protrusions, and clefts on the protein surface. The dominance of this effect is due in turn to a surface composition dominated by hydrophobic sites and H-bond donors. We now use these results to explain why the four proteins investigated here display very similar reorientational hydration shell dynamics, despite their very different biological functions, sizes, and secondary structures. While at first glance certain proteins appear to have quite specific shapes, including, e.g., the active-site cleft in lysozyme, the local protein surface topologies experienced by water molecules next to these four proteins are on average very similar, as shown by the distributions of excluded volume slowdown factors ρV (Figure 10). The topological peculiarities of some proteins seem to affect only a small fraction of the hydration shell and are not sufficient to significantly alter the overall distribution. The four proteins also have very similar chemical surface composition, as measured by the total water OH-bond population for hydrophobic, H-bond donor, and H-bond acceptor sites (Table 1).
Figure 10.
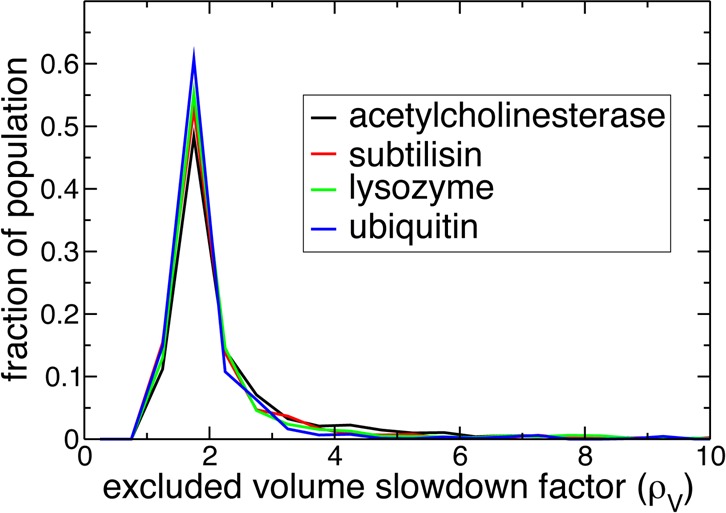
Probability distribution of excluded volume slowdown factors ρV for the four protein systems in aqueous solution.
We propose that these conclusions can be extended to hydration shell dynamics of globular proteins in general. Analysis of experimental protein partial specific volume data (i.e., the change in solution volume upon addition of solute) for a diverse set of globular proteins, including lysozyme and subtilisin, suggests a relatively constant surface composition for many proteins,56 with a dominant fraction of the exposed groups being hydrophobic or H-bond donors. This implies that the excluded-volume effect determined by the surface local topology should be the key factor in all of these proteins. Since our study of a set of very different proteins has shown no size effect, we therefore propose that hydration shell dynamics can be similar across a wide range of globular proteins, with very diverse functions, shapes, secondary structures, and sizes. However, we note that the situation is different for unfolded, membrane, or fibrous proteins.26,57,58 For example, in the case of an unfolded protein, an NMR study58 has observed a weaker dynamical perturbation of the hydration shell, and an analysis analogous to that presented here showed that this arises from the reduced number of confined sites in the unfolded state.26
Dynamical Heterogeneity due to Protein Conformational Fluctuations
The results presented above demonstrate that a major factor causing the broad distribution of water dynamics within a protein hydration layer is its roughness, which leads to a great variety of local topologies. However, the shape of a protein is not constant in time because a biomolecule is a dynamical object, constantly sampling different conformations. Therefore, next to one given protein site, the perturbation induced on the surrounding water dynamics fluctuates when the local protein topology changes. This can lead to an additional, dynamical heterogeneity in hydration shell dynamics. Conformational changes in the protein surface can affect the water jump rate constant and hence its reorientational dynamics in different ways, for example, by changing the local excluded volume slowdown factor ρV and for jumps between two protein H-bond acceptors by changing the positions of the two acceptors. Such conformational changes include, for example, hinge motions and pockets and clefts that fluctuate in size.
In order to assess the effect of conformational fluctuations on hydration shell dynamics, we use the lysozyme system, and calculate the normalized standard deviation σ in the jump rate constant for each site over a 20 ns trajectory divided into five independent blocks, defined as
| 6 |
where ⟨...⟩ denotes an average over the blocks.
While a duration of 20 ns is certainly not sufficient to cover the full conformational space of the protein, it is already sufficient to sample many different conformations. This is demonstrated by performing a principal component analysis59 and projecting the trajectory on the first two principal components, which describe the greatest amount of variance in the protein heavy atom positions and which involve the hinge-bending motion of lysozyme.60 Figure 11 shows that different conformational basins are visited during the simulation. The 4 ns block size is somewhat arbitrary; however, our goal is only to obtain a qualitative measure of the dynamical heterogeneity, and we showed in Figure 4 that this duration is sufficient to converge the distribution of water reorientation times.
Figure 11.
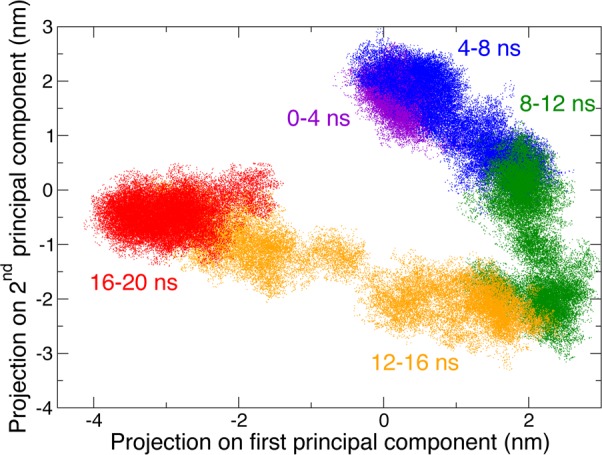
Projection of the 20 ns lysozyme trajectory along the first and second principal components. Successive 4 ns blocks are shown in different colors.
The resulting values of the standard deviation σ are mapped onto the protein surface in Figure 12. Larger values of σ can be taken as a qualitative indication of increasing dynamical heterogeneity in the hydration shell dynamics at that surface position. Water at exposed or convex parts of the surface has relatively less heterogeneity in its dynamics, compared to the greater heterogeneity for water in partial confinement, such as in surface pockets, or in other locations subject to conformational fluctuations, such as in the pronounced active-site cleft in the upper right-hand part of the protein in Figure 12.
Figure 12.
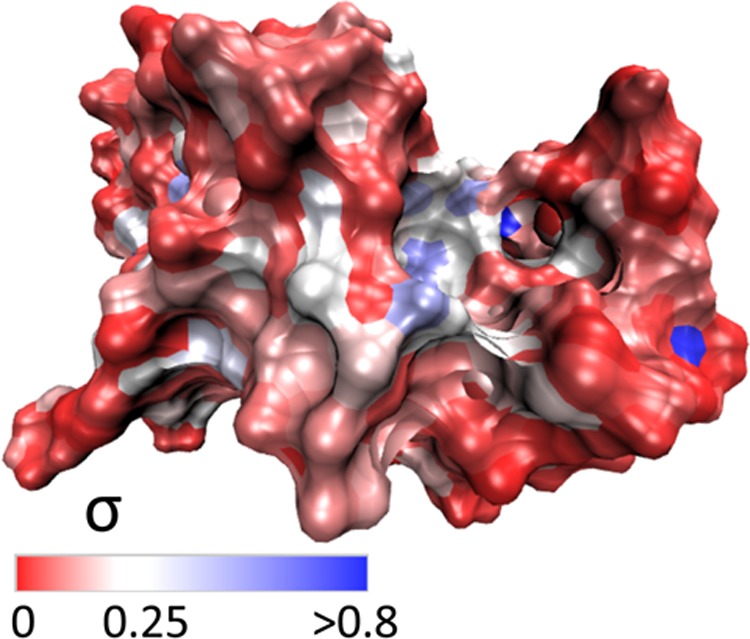
Surface mapping of σ (eq 6) for lysozyme in aqueous solution, projected onto one typical conformation.
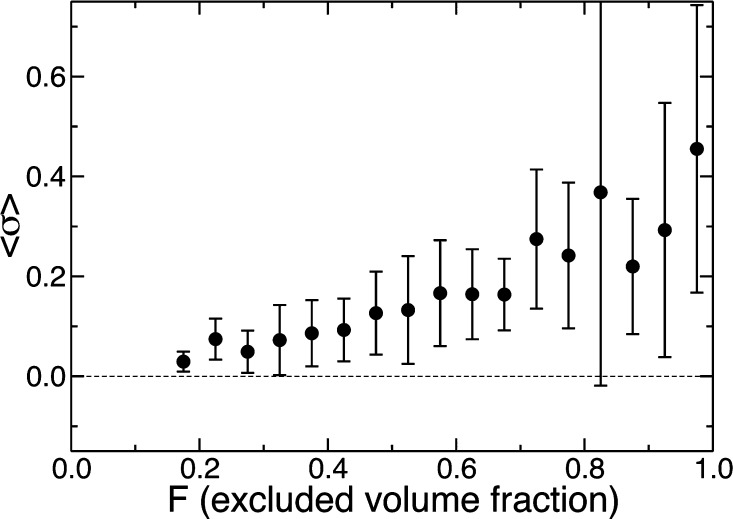
The correlation between σ and the excluded volume fraction F is quantified in Figure 13 for lysozyme surface sites. Exposed or convex parts of the protein surface correspond to low values of F and display consistently low values of σ, which indicate a limited dynamical heterogeneity. Concerning sites in a concave surface environment or in partial confinement (high value of F), the dynamical heterogeneity covers a broad range of values, going from a very small dynamical heterogeneity for internal or deeply buried water molecules whose environment changes very little with time to very large values for other molecules including, e.g., those in the active-site cleft whose width fluctuates.
Figure 13.
The average value of σ (eq 6) and its standard deviation as a function of the excluded volume fraction F, for lysozyme surface sites in aqueous solution.
A decomposition of the probability distribution of σ as a function of site type (Figure 14) shows that hydrophobic and H-bond donor sites dominate at lower dynamical heterogeneity, while H-bond acceptor sites dominate at higher dynamical heterogeneity. This arises from the fact that water molecules in concave surface environments, or in other words those most likely to experience dynamical heterogeneity, are often H-bonded to acceptor sites, since favorable energetics are required for a water molecule to enter a surface pocket or groove (as illustrated in the probability distribution of the excluded volume fraction F decomposed as a function of site type in Figure 15).
Figure 14.
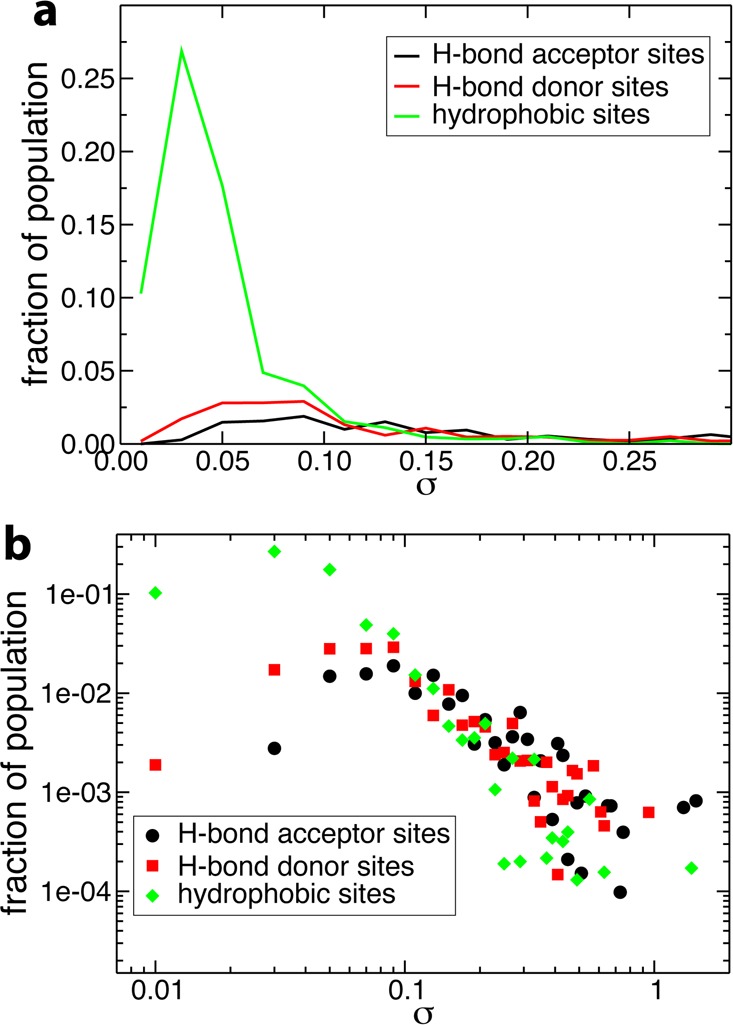
(a) Probability distribution of σ (eq 6) in the hydration shell of lysozyme in aqueous solution, decomposed by site type. Each distribution is weighted by the fraction of the total OH group population which corresponds to that site type. (b) The same distribution on a log–log scale.
Figure 15.
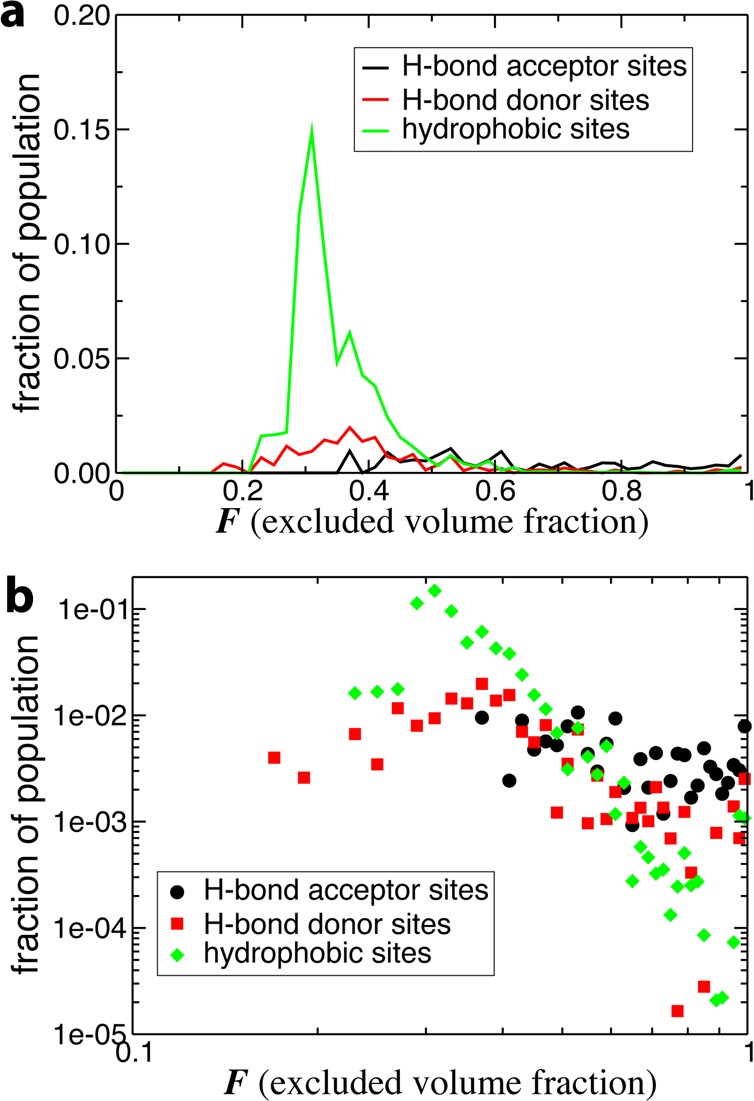
(a) Probability distribution of the excluded volume fraction F in the hydration shell of lysozyme in aqueous solution, decomposed by site type. Each distribution is weighted by the fraction of the total OH group population which corresponds to that site type. (b) The same distribution on a log–log scale.
In conclusion, in addition to the heterogeneity in hydration shell dynamics arising from the chemical and topological nature of a static protein surface, fluctuations in the surface conformation may lead to an additional, dynamical heterogeneity. The relative importance of these two types of heterogeneity in the hydration shell dynamics can be determined qualitatively via a comparison of normalized standard deviations in jump times. The magnitude of the spatial heterogeneity can be roughly quantified via σG/μ, where μ and σG are the average and standard deviation of a Gaussian fit of the main peak of the protein’s τjump distribution (we note that this underestimates the spatial heterogeneity by ignoring the τjump distribution’s tail). This measure gives a σG/μ value of 0.15–0.20 for the four proteins studied here. This can be compared to the magnitude of the dynamical heterogeneity as quantified by σ (eq 6), which has a modal value of ∼0.03 in the case of lysozyme (see Figure 14), 5–6 times smaller (this remains qualitative, since larger σ values might be obtained when calculated on shorter independent intervals). We therefore stress that a simple, spatially resolved analysis as employed in the previous section is sufficient to capture and rationalize the majority of the dynamic behavior of hydration shell water. However, considering dynamical heterogeneity may be important for understanding the behavior of small subsets of the hydration shell population, for example, in the hydration shell of proteins with marked conformational transitions such as hinge motions. Dynamical heterogeneity may also be important for protein hydration dynamics at low temperature.
Hydration Shell Dynamics in Confinement
The work presented here so far has considered proteins in dilute aqueous solution, as is the case in the majority of experimental5,7,8,11,58,61 and simulation18,20,24,25 studies of protein hydration shell dynamics. However, water dynamics in vivo occurs under conditions of macromolecular crowding,62 and certain experimental techniques employ high protein concentrations or conditions of confinement.29,31,35 An understanding of protein hydration shell dynamics is therefore incomplete without a consideration of the effects of confinement.
Description of Confined Systems
Many different types of confining situations exist, possibly with different impacts on protein hydration dynamics. Here, we focus on a protein and its hydration shell confined by an apolar organic solvent. We compare water dynamics in the hydration shell of subtilisin in three systems: the enzyme in aqueous solution, the enzyme with a monolayer of water (841 water molecules) in hexane solution, and the enzyme with approximately a half-monolayer of water (520 water molecules) in hexane solution. A monolayer is defined on the basis of the number of water molecules in the hydration shell of the enzyme in aqueous solution. Hexane is chosen because nonpolar organic solvents have been shown to conserve the enzyme hydration shell, in contrast to polar organic solvents, which “strip” water molecules from the enzyme surface.63
The monolayer system is prepared so that the protein is initially surrounded by a uniform layer of water molecules. After equilibration, the protein surface is no longer completely hydrated. Instead, large patches of the surface contain no or only a scattering of tightly bound water molecules, and are in direct contact with the organic solvent, while other patches are completely hydrated, with several shells of water molecules. The same preparation method is used for the half-monolayer system, with the initial distribution of water molecules being as uniform as possible at reduced water content, and the same clustering of water molecules is seen after equilibration. As an example, the half-monolayer system after 5 ns of simulation time is shown in Figure 16. Since the distribution of hydrophobic and polar groups across the surface is approximately uniform and the hydrated and unhydrated surface patches are large, no particular correlation between hydrophobicity and hydration could be detected. Of note is the fact that the active site remains completely hydrated at both monolayer and half-monolayer hydration levels.
Figure 16.
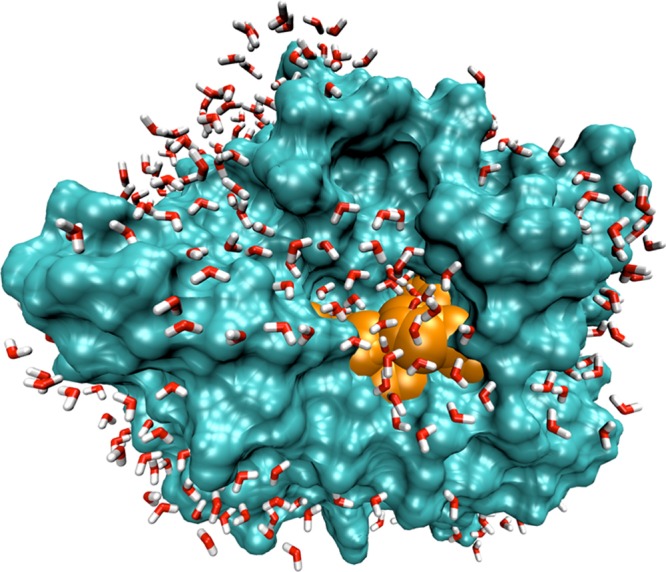
Subtilisin Carlsberg at the half monolayer hydration level in hexane, after 5 ns of simulation, showing the clustering of water molecules on the protein surface, and the active site in orange. For clarity, hexane molecules are not shown.
Effect of Confinement on Reorientational Water Dynamics
The distributions of reorientation times for the three hydration levels are shown in Figure 17. Decreasing the hydration level leads to a shift of the distributions toward larger slowdown factors and to a broadening of these distributions. This shows that confinement induces a retardation of water dynamics within the shell, and also that this slowdown is heterogeneous across the hydration shell; i.e., some sites are more slowed down than others.
Figure 17.
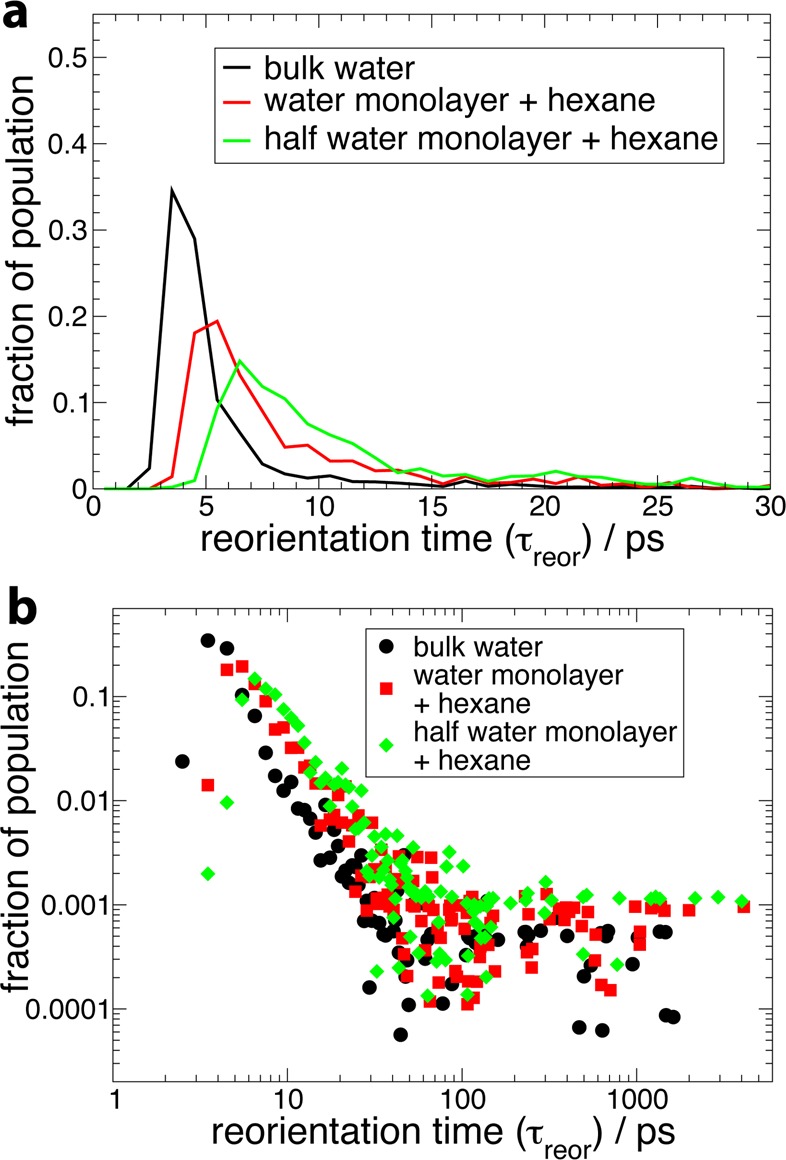
(a) Probability distribution of reorientation times in the hydration shell of the three systems containing subtilisin Carlsberg at different hydration levels. (b) The same distribution on a log–log scale.
In order to explore this heterogeneity on a site-resolved level, for any given surface site i, we define the slowdown at hydration level h relative to the fully hydrated system in aqueous solution as τreorh(i)/τreor(i). Since the clustering of water on the protein surface is not identical in the two partially hydrated systems, the most meaningful comparison is between each of these systems and the fully hydrated system. These values are mapped onto the protein surface in Figure 18. Water at the majority of protein sites is moderately slowed down upon confinement, by a factor of between 1 and 2 for τreormonolayer/τreor and between 1 and 3 for τreorhalf monolayer/τreor. In general, the sites with the greatest slowdown are those next to parts of the protein surface which are completely dehydrated. This suggests that the water molecules whose dynamics is most retarded are those who experience an excluded volume for the approach of a new H-bond acceptor53 which is due not only to the protein surface but also to the apolar hexane solvent.
Figure 18.
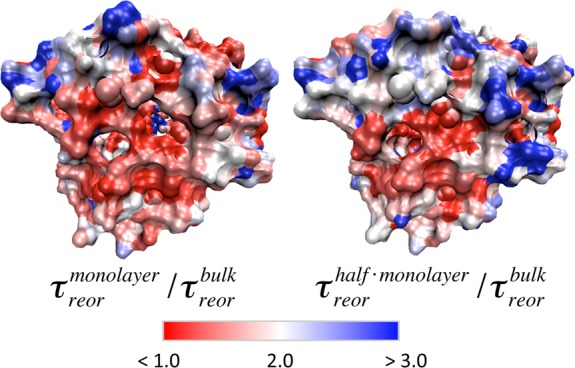
Mapping of reorientation slowdown factors in the hydration shell of subtilisin Carlsberg, at the monolayer hydration level in hexane relative to the fully hydrated system in aqueous solution (left) and at the half monolayer hydration level in hexane relative to the fully hydrated system in aqueous solution (right).
Connection with Linear and 2D-IR Spectroscopy
We then turn to linear and two-dimensional infrared spectroscopy in order both to explore further the H-bond dynamics of these systems and to demonstrate how our conclusions can be connected to experimentally obtainable values. 2D-IR spectroscopy is an ultrafast technique which is increasingly being used to probe water H-bond dynamics in a wide range of systems, including confining environments64−69 and the hydration shell of biomolecules such as DNA.70 In addition, 2D-IR spectroscopy has also been used to indirectly probe protein hydration shell dynamics via a vibrational probe covalently attached to the protein surface.10,35
Here, we calculate the linear and 2D-IR spectra of the water stretch vibration. Because these spectra measure a signal collected from all water molecules in the system, for a protein in bulk aqueous solution, the hydration shell water signal would be swamped by the signal from bulk water. We therefore focus on two partially hydrated subtilisin systems, where all water molecules are close to the protein interface. Experimentally, isotopic mixtures such as HOD in H2O are used to avoid the effects of intermolecular vibrational energy transfer.71 We thus calculate the spectra for the OD stretch of dilute HOD in H2O. We employ the empirical map developed in ref (72) relating the vibrational frequency to the local electric field. The latter is obtained via an a posteriori treatment of classical molecular dynamics trajectories. While our calculations are based on a trajectory computed for a system containing pure H2O, the effect on the calculated spectra has been shown to be negligible.73 Our choice to study the water OD stretch rather than the OH stretch is dictated by the necessity to isolate the mode under consideration as much as possible from other protein vibrational modes. While the water OH stretch frequency overlaps with the OH and NH protein bands, the OD stretch frequency range does not significantly overlap with the frequency range of major protein vibrational modes.74
The resulting linear IR spectra for HOD in bulk H2O and in the hydration shell of subtilisin at different hydration levels are shown in Figure 19. In hexane confinement, a blueshifted peak grows for decreasing hydration level. Such a peak had previously been observed experimentally at water–hexane interfaces75 and also in simulations of water next to model hydrophobic surfaces.76 It corresponds to dangling, non-H-bonded OD groups.
Figure 19.
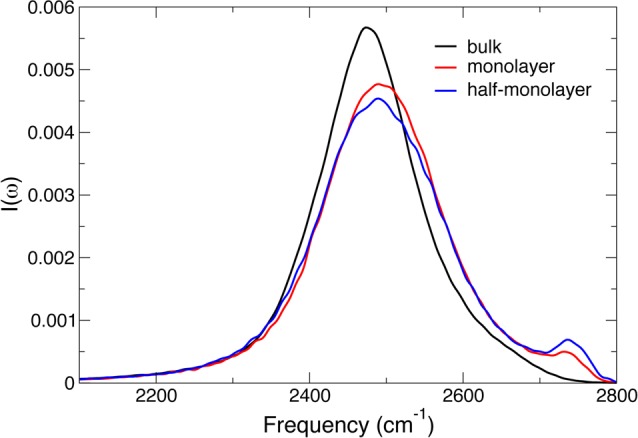
Calculated linear IR spectra for the OD stretch of HOD in liquid H2O, respectively, in bulk water and for subtilisin Carlsberg in hexane at different hydration levels.
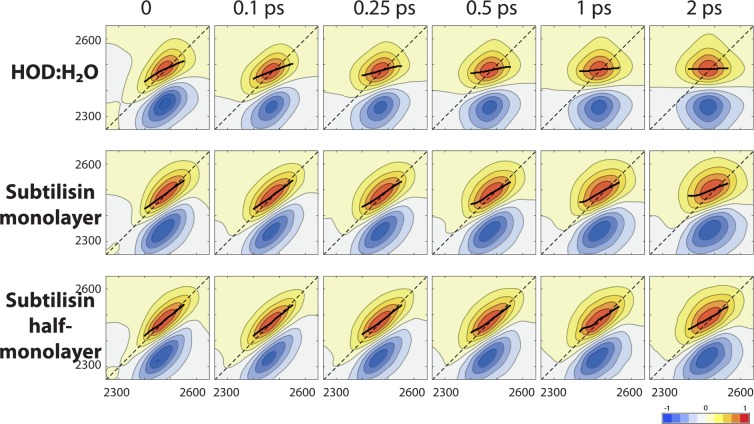
We now turn to the 2D-IR spectra, shown in Figure 20. 2D-IR spectroscopy provides detailed information on water H-bond dynamics,34,68,70,77−79 since the water stretch frequency is a sensitive probe of the H-bonding interaction: it respectively shifts to the red and to the blue when engaged in a strong and a weak hydrogen-bond. The spectra show the correlation between excitation and detection frequencies of the water stretch after a given waiting time. The time evolution of the spectra is therefore a measure of the loss of frequency correlation, and hence gives access to time-resolved information on water dynamics. The spectra in Figure 20 clearly show that the frequency relaxation is slower in the confined hydration shell than in bulk water, and that this slowdown is even more pronounced when the hydration level decreases. This time evolution can be quantified using, for example, the center line slope (CLS),80 i.e., the slope of the positive peak’s crest along the horizontal excitation frequency axis, which provides an estimate of the frequency tcf. As shown in Figure 21, while in bulk water, the OD frequency decorrelates on a picosecond time scale,81 and in the confined hydration shell after 2 ps, a large frequency correlation is retained, leading to 2D-IR spectra which are still elongated along the diagonal (cf. Figure 20). This reflects the slower water H-bond dynamics in confinement described in the previous section. A slowdown in water spectral dynamics has also been observed in 2D-IR studies of water confined in other systems.64,66−69
Figure 20.
Calculated 2D-IR spectra for the OD stretch of HOD in liquid H2O, respectively, in bulk water and in the hydration shell of subtilisin Carlsberg in hexane at different hydration levels, for waiting times ranging from 0 to 2 ps. The horizontal and vertical axes correspond to the excitation and detection frequencies, respectively, in cm–1. Each spectrum is normalized with respect to the positive peak height. The black lines show the center line slope80 on a 150 cm–1 wide interval centered on the positive peak.
Figure 21.
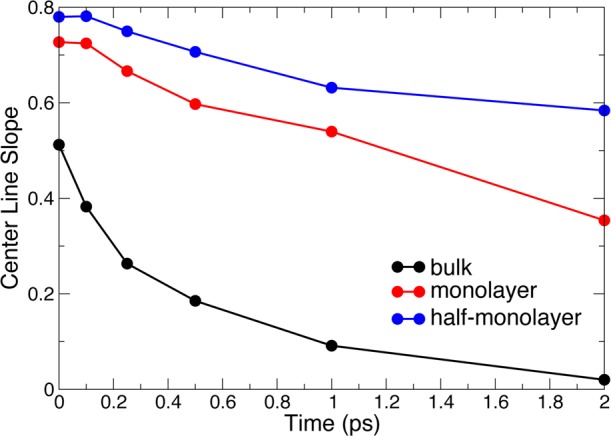
Center line slope80 as a function of waiting time from 2D-IR spectra (Figure 20) in bulk water and in the hydration shell of subtilisin Carlsberg in hexane at different hydration levels.
The 2D-IR spectra further provide a resolution of the linear IR bandwidth in terms of its homogeneous and inhomogeneous contributions,82 which respectively arise from the presence of rapid frequency fluctuations and of a static distribution of frequencies. The homogeneous width can be estimated as the full width at half-maximum (fwhm) of a Lorentzian fit of the 2D-IR spectra along the antidiagonal, while the inhomogeneous width can be determined from the fwhm of a Gaussian fit of the 2D-IR spectra along the diagonal.82 The time evolutions of the homogeneous and inhomogeneous widths are shown in Figure 22. They clearly show that upon confinement the inhomogeneous distribution of frequencies becomes broader due to the greater variety of local environments, while the homogeneous line width decreases due to the slower frequency dynamics. This explains a key difference between the 2D-IR spectra in Figure 20 for excitation frequencies on the blue edge. In bulk water, these blueshifted OD vibrations correspond to transient H-bond breaks quickly followed by the reformation of the H-bond, leading to a very fast frequency decorrelation.83 In the confined subtilisin hydration shells, these blueshifted frequencies arise from long-lived and weakly or non-H-bonded OD groups at the hexane interface, leading to a much slower frequency decorrelation.
Figure 22.
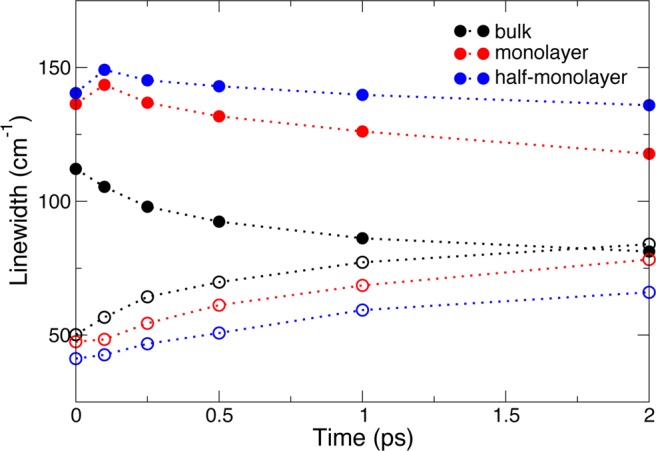
Homogeneous (open circles) and inhomogeneous (full circles) widths of the 2D-IR spectra (Figure 20) in bulk water and in the hydration shell of subtilisin Carlsberg in hexane at different hydration levels.
These results demonstrate that the dynamics of the water H-bond network is slower at lower hydration level and that the distribution of relaxation times is broader. Our analysis shows that these conclusions can be directly connected to experimentally accessible linear and 2D-IR spectra of such systems, and that these techniques could prove a valuable tool for the elucidation of their hydration shell dynamics.
Concluding Remarks
Many different pictures have been suggested to describe and rationalize protein hydration shell dynamics. The spatial extent and magnitude of the perturbation induced by a biomolecule together with the origin of this perturbation have been extensively studied and discussed, with both local24,25 and longer-range16,22,62,84,85 effects being evoked. Here, we conclude that the reorientation dynamics of individual water molecules is only moderately perturbed in the hydration shell of the series of proteins studied, and that this perturbation has its source mainly in local features of the protein surface, namely, the local surface topology and the chemical nature of the surface-exposed protein atoms. While additional nonlocal effects probably contribute for the collective water rearrangements probed by some experimental techniques,11,15,16 we find that the distribution of reorientation dynamics for individual water molecules within the hydration shell does not significantly depend either on secondary structure or on protein size. Instead, we find that the hydration shell dynamics is similar across the diverse proteins studied. We propose that not only can the hydration shell dynamics for all globular proteins be rationalized by the same local topological and chemical factors but also, for many globular proteins, the hydration shell as a whole will have similar underlying distributions of reorientation times, and hence similar overall dynamics.
In addition, we have shown that protein conformational fluctuations have a large impact on hydration shell dynamics, particularly at those parts of the protein surface which are concave or which cause a partial confinement of hydration shell water molecules. We have also evidenced a slowdown in hydration shell dynamics upon confinement which is heterogeneous across the protein surface, and demonstrated how the water dynamics in such a system can be explored via 2D-IR spectroscopy.
Future work will extend the present approach to the study of translational dynamics of water molecules within protein hydration shells, which can be probed by NMR86 and neutron scattering29 techniques and which has been shown to display slowdown factors similar to those of reorientational dynamics.23,24
Acknowledgments
The research leading to these results has received funding from the European Research Council under the European Union’s Seventh Framework Program (FP7/2007-2013)/ERC Grant Agreement No. 279977.
The authors declare no competing financial interest.
References
- Levy Y.; Onuchic J. N. Water mediation in protein folding and molecular recognition. Annu. Rev. Biophys. Biomol. Struct. 2006, 35, 389–415. [DOI] [PubMed] [Google Scholar]
- Fogarty A. C.; Duboué-Dijon E.; Sterpone F.; Hynes J. T.; Laage D. Biomolecular hydration dynamics: a jump model perspective. Chem. Soc. Rev. 2013, 42, 5672–5683. [DOI] [PubMed] [Google Scholar]
- Klibanov A. M. Improving enzymes by using them in organic solvents. Nature 2001, 409, 241–246. [DOI] [PubMed] [Google Scholar]
- Halle B. Protein hydration dynamics in solution: a critical survey. Philos. Trans. R. Soc. London, Ser. B 2004, 359, 1207–1223(discussion 1223–1224, 1323–1328). [DOI] [PMC free article] [PubMed] [Google Scholar]
- Mattea C.; Qvist J.; Halle B. Dynamics at the Protein-Water Interface from 17O Spin Relaxation in Deeply Supercooled Solutions. Biophys. J. 2008, 95, 2951–2963. [DOI] [PMC free article] [PubMed] [Google Scholar]
- Bryant R. G. Dynamics of water in and around proteins characterized by 1H-spin-lattice relaxometry. C. R. Phys. 2010, 11, 128–135. [Google Scholar]
- Pal S. K.; Peon J.; Zewail A. H. Biological water at the protein surface: dynamical solvation probed directly with femtosecond resolution. Proc. Natl. Acad. Sci. U.S.A. 2002, 99, 1763–1768. [DOI] [PMC free article] [PubMed] [Google Scholar]
- Qiu W.; Kao Y.-T. T.; Zhang L.; Yang Y.; Wang L.; Stites W. E.; Zhong D.; Zewail A. H. Protein surface hydration mapped by site-specific mutations. Proc. Natl. Acad. Sci. U.S.A. 2006, 103, 13979–13984. [DOI] [PMC free article] [PubMed] [Google Scholar]
- Li T.; Hassanali A. A.; Kao Y.-T. T.; Zhong D.; Singer S. J. Hydration dynamics and time scales of coupled water-protein fluctuations. J. Am. Chem. Soc. 2007, 129, 3376–3382. [DOI] [PubMed] [Google Scholar]
- King J. T.; Arthur E. J.; Brooks C. L.; Kubarych K. J. Site-Specific Hydration Dynamics of Globular Proteins and the Role of Constrained Water in Solvent Exchange with Amphiphilic Cosolvents. J. Phys. Chem. B 2012, 116, 5604–5611. [DOI] [PMC free article] [PubMed] [Google Scholar]
- Born B.; Kim S. J.; Ebbinghaus S.; Gruebele M.; Havenith M. The terahertz dance of water with the proteins: the effect of protein flexibility on the dynamical hydration shell of ubiquitin. Faraday Discuss. 2009, 141, 161–173. [DOI] [PubMed] [Google Scholar]
- Wood K.; Plazanet M.; Gabel F.; Kessler B.; Oesterhelt D.; Tobias D. J.; Zaccai G.; Weik M. Coupling of protein and hydration-water dynamics in biological membranes. Proc. Natl. Acad. Sci. U.S.A. 2007, 104, 18049–18054. [DOI] [PMC free article] [PubMed] [Google Scholar]
- Russo D.; Ollivier J.; Teixeira J. Water hydrogen bond analysis on hydrophilic and hydrophobic biomolecule sites. Phys. Chem. Chem. Phys. 2008, 10, 4968–4974. [DOI] [PubMed] [Google Scholar]
- Bellissent-Funel M.-C.; Zanotti J.-M.; Chen S. H. Slow dynamics of water molecules on the surface of a globular protein. Faraday Discuss. 1996, 103, 281–294. [Google Scholar]
- Mazur K.; Heisler I. A.; Meech S. R. Water Dynamics at Protein Interfaces: Ultrafast Optical Kerr Effect Study. J. Phys. Chem. A 2012, 116, 2678–2685. [DOI] [PubMed] [Google Scholar]
- Comez L.; Lupi L.; Morresi A.; Paolantoni M.; Sassi P.; Fioretto D. More Is Different: Experimental Results on the Effect of Biomolecules on the Dynamics of Hydration Water. J. Phys. Chem. Lett. 2013, 4, 1188–1192. [DOI] [PubMed] [Google Scholar]
- Rossky P. J.; Karplus M. Solvation. A molecular dynamics study of a dipeptide in water. J. Am. Chem. Soc. 1979, 101, 1913–1937. [Google Scholar]
- Abseher R.; Schreiber H.; Steinhauser O. The influence of a protein on water dynamics in its vicinity investigated by molecular dynamics simulation. Proteins: Struct., Funct., Bioinf. 1996, 25, 366–378. [DOI] [PubMed] [Google Scholar]
- Makarov V. A.; Andrews B. K.; Smith P. E.; Pettitt B. M. Residence Times of Water Molecules in the Hydration Sites of Myoglobin. Biophys. J. 2000, 79, 2966–2974. [DOI] [PMC free article] [PubMed] [Google Scholar]
- Garcia A.; Hummer G. Water penetration and escape in proteins. Proteins: Struct., Funct., Genet. 2000, 38, 261–272. [PubMed] [Google Scholar]
- Tarek M.; Tobias D. Role of protein-water hydrogen bond dynamics in the protein dynamical transition. Phys. Rev. Lett. 2002, 88, 138101. [DOI] [PubMed] [Google Scholar]
- Bizzarri A. R.; Cannistraro S. Molecular Dynamics of Water at the Protein-Solvent Interface. J. Phys. Chem. B 2002, 106, 6617–6633. [Google Scholar]
- Marchi M.; Sterpone F.; Ceccarelli M. Water Rotational Relaxation and Diffusion in Hydrated Lysozyme. J. Am. Chem. Soc. 2002, 124, 6787–6791. [DOI] [PubMed] [Google Scholar]
- Pizzitutti F.; Marchi M.; Sterpone F.; Rossky P. J. How Protein Surfaces Induce Anomalous Dynamics of Hydration Water. J. Phys. Chem. B 2007, 111, 7584–7590. [DOI] [PubMed] [Google Scholar]
- Sterpone F.; Stirnemann G.; Laage D. Magnitude and Molecular Origin of Water Slowdown Next to a Protein. J. Am. Chem. Soc. 2012, 134, 4116–4119. [DOI] [PubMed] [Google Scholar]
- Rahaman O.; Melchionna S.; Laage D.; Sterpone F. The effect of protein composition on hydration dynamics. Phys. Chem. Chem. Phys. 2013, 15, 3570–3576. [DOI] [PMC free article] [PubMed] [Google Scholar]
- Henchman R. H.; McCammon J. A. Structural and dynamic properties of water around acetylcholinesterase. Protein Sci. 2002, 11, 2080–2090. [DOI] [PMC free article] [PubMed] [Google Scholar]
- Zhong D.; Pal S. K.; Zewail A. H. Biological water: A critique. Chem. Phys. Lett. 2011, 503, 1–11. [Google Scholar]
- Russo D.; Hura G.; Head-Gordon T. Hydration Dynamics Near a Model Protein Surface. Biophys. J. 2004, 86, 1852–1862. [DOI] [PMC free article] [PubMed] [Google Scholar]
- Zhang L.; Wang L.; Kao Y.-T.; Qiu W.; Yang Y.; Okobiah O.; Zhong D. Mapping hydration dynamics around a protein surface. Proc. Natl. Acad. Sci. U.S.A. 2007, 104, 18461–18466. [DOI] [PMC free article] [PubMed] [Google Scholar]
- Nucci N. V.; Pometun M. S.; Wand A. J. Mapping the Hydration Dynamics of Ubiquitin. J. Am. Chem. Soc. 2011, 133, 12326–12329. [DOI] [PMC free article] [PubMed] [Google Scholar]
- Luise A.; Falconi M.; Desideri A. Molecular dynamics simulation of solvated azurin: Correlation between surface solvent accessibility and water residence times. Proteins: Struct., Funct., Bioinf. 2000, 39, 56–67. [DOI] [PubMed] [Google Scholar]
- Laage D.; Stirnemann G.; Sterpone F.; Rey R.; Hynes J. T. Reorientation and Allied Dynamics in Water and Aqueous Solutions. Annu. Rev. Phys. Chem. 2011, 62, 395–416. [DOI] [PubMed] [Google Scholar]
- Laage D.; Stirnemann G.; Sterpone F.; Hynes J. T. Water Jump Reorientation: From Theoretical Prediction to Experimental Observation. Acc. Chem. Res. 2012, 45, 53–62. [DOI] [PubMed] [Google Scholar]
- King J. T.; Kubarych K. J. Site-Specific Coupling of Hydration Water and Protein Flexibility Studied in Solution with Ultrafast 2D-IR Spectroscopy. J. Am. Chem. Soc. 2012, 134, 18705–18712. [DOI] [PubMed] [Google Scholar]
- Laage D.; Hynes J. T. On the Molecular Mechanism of Water Reorientation. J. Phys. Chem. B 2008, 112, 14230–14242. [DOI] [PubMed] [Google Scholar]
- Stryer L.Biochemistry, 3rd ed.; W.H. Freeman: New York, 1988. [Google Scholar]
- Fersht A.Structure and mechanism in protein science: a guide to enzyme catalysis and protein folding; W.H. Freeman: New York, 1999. [Google Scholar]
- MacKerell A.; Bashford D.; Bellott M.; Dunbrack R.; Evanseck J.; Field M.; Fischer S.; Gao J.; Guo H.; Ha S.; et al. All-atom empirical potential for molecular modeling and dynamics studies of proteins. J. Phys. Chem. B 1998, 102, 3586–3616. [DOI] [PubMed] [Google Scholar]
- Berendsen H.; Grigera J.; Straatsma T. The Missing Term in Effective Pair Potentials. J. Phys. Chem. 1987, 91, 6269–6271. [Google Scholar]
- Abascal J. L. F.; Vega C. A general purpose model for the condensed phases of water: TIP4P/2005. J. Chem. Phys. 2005, 123, 234505. [DOI] [PubMed] [Google Scholar]
- Stirnemann G.; Laage D. Communication: On the origin of the non-Arrhenius behavior in water reorientation dynamics. J. Chem. Phys. 2012, 137, 031101. [DOI] [PubMed] [Google Scholar]
- Phillips J.; Braun R.; Wang W.; Gumbart J.; Tajkhorshid E.; Villa E.; Chipot C.; Skeel R.; Kale L.; Schulten K. Scalable molecular dynamics with NAMD. J. Comput. Chem. 2005, 26, 1781–1802. [DOI] [PMC free article] [PubMed] [Google Scholar]
- Northrup S. H.; Hynes J. T. The stable states picture of chemical reactions. I. Formulation for rate constants and initial condition effects. J. Chem. Phys. 1980, 73, 2700–2714. [Google Scholar]
- Stirnemann G.; Wernersson E.; Jungwirth P.; Laage D. Mechanisms of Acceleration and Retardation of Water Dynamics by Ions. J. Am. Chem. Soc. 2013, 135, 11824–11831. [DOI] [PubMed] [Google Scholar]
- Correction for logarithmic binning of the data in ref (20) gives an exponent of 2.3 rather than 2.5 (see ref (5)).
- Corradini D.; Strekalova E. G.; Stanley H. E.; Gallo P. Microscopic mechanism of protein cryopreservation in an aqueous solution with trehalose. Sci. Rep. 2013, 3, 1218. [DOI] [PMC free article] [PubMed] [Google Scholar]
- Berberan-Santos M. N.; Bodunov E. N.; Valeur B. Mathematical functions for the analysis of luminescence decays with underlying distributions 1. Kohlrausch decay function (stretched exponential). Chem. Phys. 2005, 315, 171–182. [Google Scholar]
- Sciortino F.; Fabbian L.; Chen S.-H. . H.; Tartaglia P. Supercooled water and the kinetic glass transition. II. Collective dynamics. Phys. Rev. E 1997, 56, 5397–5404. [DOI] [PubMed] [Google Scholar]
- Fuchs M. The Kohlrausch law as a limit solution to mode coupling equations. J. Non-Cryst. Solids 1994, 172–174, 241–247. [Google Scholar]
- Golosov A. A.; Karplus M. Probing Polar Solvation Dynamics in Proteins: A Molecular Dynamics Simulation Analysis. J. Phys. Chem. B 2007, 111, 1482–1490. [DOI] [PubMed] [Google Scholar]
- Halle B.; Nilsson L. Does the Dynamic Stokes Shift Report on Slow Protein Hydration Dynamics?. J. Phys. Chem. B 2009, 113, 8210–8213. [DOI] [PubMed] [Google Scholar]
- Laage D.; Stirnemann G.; Hynes J. T. Why Water Reorientation Slows without Iceberg Formation around Hydrophobic Solutes. J. Phys. Chem. B 2009, 113, 2428–2435. [DOI] [PubMed] [Google Scholar]
- Sterpone F.; Stirnemann G.; Hynes J. T.; Laage D. Water hydrogen-bond dynamics around amino acids: The key role of hydrophilic hydrogen-bond acceptor groups. J. Phys. Chem. B 2010, 114, 2083–2089. [DOI] [PubMed] [Google Scholar]
- Williams M. A.; Goodfellow J. M.; Thornton J. M. Buried waters and internal cavities in monomeric proteins. Protein Sci. 1994, 3, 1224–1235. [DOI] [PMC free article] [PubMed] [Google Scholar]
- Murphy L.; Matubayasi N.; Payne V.; Levy R. Protein hydration and unfolding - insights from experimental partial specific volumes and unfolded protein models. Folding Des. 1998, 3, 105–118. [DOI] [PubMed] [Google Scholar]
- Modig K.; Kurian E.; Prendergast F. G.; Halle B. Water and urea interactions with the native and unfolded forms of a β-barrel protein. Protein Sci. 2003, 12, 2768–2781. [DOI] [PMC free article] [PubMed] [Google Scholar]
- Qvist J.; Ortega G.; Tadeo X.; Millet O.; Halle B. Hydration Dynamics of a Halophilic Protein in Folded and Unfolded States. J. Phys. Chem. B 2012, 116, 3436–3444. [DOI] [PubMed] [Google Scholar]
- Adcock S. A.; McCammon J. A. Molecular Dynamics: Survey of Methods for Simulating the Activity of Proteins. Chem. Rev. 2006, 106, 1589–1615. [DOI] [PMC free article] [PubMed] [Google Scholar]
- Brooks B.; Karplus M. Normal modes for specific motions of macromolecules: application to the hinge-bending mode of lysozyme. Proc. Natl. Acad. Sci. U.S.A. 1985, 82, 4995–4999. [DOI] [PMC free article] [PubMed] [Google Scholar]
- Grossman M.; Born B.; Heyden M.; Tworowski D.; Fields G. B.; Sagi I.; Havenith M. Correlated structural kinetics and retarded solvent dynamics at the metalloprotease active site. Nat. Struct. Mol. Biol. 2011, 18, 1102–1109. [DOI] [PMC free article] [PubMed] [Google Scholar]
- Ball P. Water as an Active Constituent in Cell Biology. Chem. Rev. 2008, 108, 74–108. [DOI] [PubMed] [Google Scholar]
- Yang L.; Dordick J. S.; Garde S. Hydration of Enzyme in Nonaqueous Media Is Consistent with Solvent Dependence of Its Activity. Biophys. J. 2004, 87, 812–821. [DOI] [PMC free article] [PubMed] [Google Scholar]
- Fenn E. E.; Wong D. B.; Giammanco C. H.; Fayer M. D. Dynamics of Water at the Interface in Reverse Micelles: Measurements of Spectral Diffusion with Two-Dimensional Infrared Vibrational Echoes. J. Phys. Chem. B 2011, 115, 11658–11670. [DOI] [PubMed] [Google Scholar]
- Costard R.; Greve C.; Heisler I. A.; Elsaesser T. Ultrafast Energy Redistribution in Local Hydration Shells of Phospholipids: A Two-Dimensional Infrared Study. J. Phys. Chem. Lett. 2012, 3, 3646–3651. [DOI] [PubMed] [Google Scholar]
- Kumar S. K. K.; Tamimi A.; Fayer M. D. Dynamics in the Interior of AOT Lamellae Investigated with Two-Dimensional Infrared Spectroscopy. J. Am. Chem. Soc. 2013, 135, 5118–5126. [DOI] [PubMed] [Google Scholar]
- Pieniazek P. A.; Lin Y.-S. S.; Chowdhary J.; Ladanyi B. M.; Skinner J. L. Vibrational spectroscopy and dynamics of water confined inside reverse micelles. J. Phys. Chem. B 2009, 113, 15017–15028. [DOI] [PubMed] [Google Scholar]
- Skinner J. L.; Pieniazek P. A.; Gruenbaum S. M. Vibrational Spectroscopy of Water at Interfaces. Acc. Chem. Res. 2011, 45, 93–100. [DOI] [PMC free article] [PubMed] [Google Scholar]
- Bakulin A. A.; Cringus D.; Pieniazek P. A.; Skinner J. L.; Jansen T. L. C.; Pshenichnikov M. S. Dynamics of Water Confined in Reversed Micelles: Multidimensional Vibrational Spectroscopy Study. J. Phys. Chem. B 2013, 117, 15545–15558. [DOI] [PubMed] [Google Scholar]
- Elsaesser T. Two-Dimensional Infrared Spectroscopy of Intermolecular Hydrogen Bonds in the Condensed Phase. Acc. Chem. Res. 2009, 42, 1220–1228. [DOI] [PubMed] [Google Scholar]
- Bakker H. J.; Skinner J. L. Vibrational spectroscopy as a probe of structure and dynamics in liquid water. Chem. Rev. 2009, 110, 1498–1517. [DOI] [PubMed] [Google Scholar]
- Auer B.; Kumar R.; Schmidt J. R.; Skinner J. L. Hydrogen bonding and Raman, IR, and 2D-IR spectroscopy of dilute HOD in liquid D2O. Proc. Natl. Acad. Sci. U.S.A. 2007, 104, 14215–14220. [DOI] [PMC free article] [PubMed] [Google Scholar]
- Schmidt J. R.; Roberts S. T.; Loparo J. J.; Tokmakoff A.; Fayer M. D.; Skinner J. L. Are water simulation models consistent with steady-state and ultrafast vibrational spectroscopy experiments?. Chem. Phys. 2007, 341, 143–157. [Google Scholar]
- Parson W. W.Modern Optical Spectroscopy; Springer-Verlag: Berlin, 2007. [Google Scholar]
- Scatena L. F.; Brown M. G.; Richmond G. L. Water at Hydrophobic Surfaces: Weak Hydrogen Bonding and Strong Orientation Effects. Science 2001, 292, 908–912. [DOI] [PubMed] [Google Scholar]
- Stirnemann G.; Rossky P. J.; Hynes J. T.; Laage D. Water Reorientation, Hydrogen-Bond Dynamics and 2D-IR Spectroscopy next to an Extended Hydrophobic Surface. Faraday Discuss. 2010, 146, 263–281. [DOI] [PubMed] [Google Scholar]
- Roberts S. T.; Ramasesha K.; Tokmakoff A. Structural rearrangements in water viewed through two-dimensional infrared spectroscopy. Acc. Chem. Res. 2009, 42, 1239–1249. [DOI] [PubMed] [Google Scholar]
- Fayer M. D. Dynamics of Water Interacting with Interfaces, Molecules, and Ions. Acc. Chem. Res. 2011, 45, 3–14. [DOI] [PMC free article] [PubMed] [Google Scholar]
- Gaffney K. J.; Ji M.; Odelius M.; Park S.; Sun Z. H-bond switching and ligand exchange dynamics in aqueous ionic solution. Chem. Phys. Lett. 2011, 504, 1–6. [Google Scholar]
- Kwak K.; Rosenfeld D. E.; Fayer M. D. Taking apart the two-dimensional infrared vibrational echo spectra: More information and elimination of distortions. J. Chem. Phys. 2008, 128, 204505. [DOI] [PubMed] [Google Scholar]
- Asbury J. B.; Steinel T.; Kwak K.; Corcelli S. A.; Lawrence C. P.; Skinner J. L.; Fayer M. D. Dynamics of water probed with vibrational echo correlation spectroscopy. J. Chem. Phys. 2004, 121, 12431–12446. [DOI] [PubMed] [Google Scholar]
- Hamm P.; Zanni M.. Concepts and Methods of 2D Infrared Spectroscopy; Cambridge University Press: Cambridge, 2011. [Google Scholar]
- Eaves J. D.; Loparo J. J.; Fecko C. J.; Roberts S. T.; Tokmakoff A.; Geissler P. L. Hydrogen bonds in liquid water are broken only fleetingly. Proc. Natl. Acad. Sci. U.S.A. 2005, 102, 13019–13022. [DOI] [PMC free article] [PubMed] [Google Scholar]
- Brovchenko I.; Oleinikova A. Which Properties of a Spanning Network of Hydration Water Enable Biological Functions?. ChemPhysChem 2008, 9, 2695–2702. [DOI] [PubMed] [Google Scholar]
- Russo D.; Murarka R. K.; Copley J. R. D.; Head-Gordon T. Molecular View of Water Dynamics near Model Peptides. J. Phys. Chem. B 2005, 109, 12966–12975. [DOI] [PMC free article] [PubMed] [Google Scholar]
- Grebenkov D. S.; Goddard Y. A.; Diakova G.; Korb J. P.; Bryant R. G. Dimensionality of diffusive exploration at the protein interface in solution. J. Phys. Chem. B 2009, 113, 13347–13356. [DOI] [PMC free article] [PubMed] [Google Scholar]


