Abstract
The ability to resist mechanical forces is necessary for the survival and division of bacteria and has traditionally been probed using specialized, low-throughput techniques such as atomic force microscopy and optical tweezers. Here we demonstrate a microfluidic technique to profile the stiffness of individual bacteria and populations of bacteria. The approach is similar to micropipette aspiration used to characterize the biomechanical performance of eukaryotic cells. However, the small size and greater stiffness of bacteria relative to eukaryotic cells prevents the use of micropipettes. Here we present devices with sub-micron features capable of applying loads to bacteria in a controlled fashion. Inside the device, individual bacteria are flowed and trapped in tapered channels. Less stiff bacteria undergo greater deformation and therefore travel further into the tapered channel. Hence, the distance traversed by bacteria into a tapered channel is inversely related to cell stiffness. We demonstrate the ability of the device to characterize hundreds of bacteria at a time, measuring stiffness at 12 different applied loads at a time. The device is shown to differentiate between two bacterial species, E. coli (less stiff) and B. subtilis (more stiff), and detect differences between E. coli submitted to antibiotic treatment from untreated cells of the same species/strain. The microfluidic device is advantageous in that it requires only minimal sample preparation, no permanent cell immobilization, no staining/labeling and maintains cell viability. Our device adds detection of biomechanical phenotypes of bacteria to the list of other bacterial phenotypes currently detectable using microchip-based methods and suggests the feasibility of separating/selecting bacteria based on differences in cell stiffness.
Introduction
In bacteria, the ability to resist mechanical forces is necessary for survival and growth, allowing cells to withstand osmotic pressures while maintaining cell shape, cell growth and division1–3. The mechanical properties of bacteria are known to vary among and within species. Gram positive bacteria have a thicker cell wall and greater turgor pressure than Gram negative organisms, and are therefore more stiff than Gram negative organisms 4, 5. To date, the mechanical properties of bacteria have been examined using optical traps6, atomic force microscopy7, 8, scanning probe microscopy4, and hydrogel encapsulation5. These existing methods of probing bacteria mechanical properties are limited in that they require permanent cell immobilization (or even lysis) and only one of the existing methods can be performed rapidly on hundreds of cells at a time (hydrogel encapsulation).
Microfluidic devices are readily adapted to high throughput profiling and biophysical assays of cells. A number of microfluidic techniques have been used to profile and/or sort eukaryotic cells (primarily mammalian cells) based on biomechanical phenotypes. Existing methods include measuring transit time through narrow constrictions9–11, applying fluid pressure to force cells through tapered constrictions12, wedging cells into tapered constrictions13–16, and stretching cells under fluid shear stress17, 18. Microdevices used to probe or profile eukaryotic cell biomechanics are not readily applicable to bacteria because bacteria are typically 10 times smaller than mammalian cells and therefore require devices with submicron features. Additionally, many of the techniques applied to mammalian cells are not able to apply the stress magnitudes necessary to deflect the more stiff cell wall and envelope of live bacteria. Current nano- and micro-fabrication technologies present new capabilities for creating structures at the length scale of individual bacteria.
Here, we present a microfluidic platform/approach to profile the stiffness of individual bacteria. Key advantages of this microfluidic platform for profiling the biomechanical properties of bacteria include: minimal sample preparation, no chemical immobilization or labeling, scalable to analyze hundreds of cells at once and could theoretically could be applied to environmental samples of uncultivable organisms. We demonstrate 1) the ability of the device to differentiate the stiffness of two different species (E. coli v. B. subtilis); and 2) the ability to differentiate between bacteria of the same species submitted to a treatment known to influence cell stiffness.
Materials and Methods
Cell culture and chemicals
LB Broth and A22 antibiotic were purchased from Sigma Aldrich (St Louis, MO). Terrific Broth was purchased from Invitrogen (Frederick, MD). PBS was purchased from Gibco (Grand Island, NY). E. coli with IPTG inducible GFP expression, RP437/pTrc-GFP were obtained as a gift from Matthew DeLisa. B. subtilis, JH462, was obtained from Dr. Beth Lazzazera.
Biomechanical profiling through extrusion loading
Biomechanical profiling is performed using a mechanical stimulus we refer to as extrusion loading. Extrusion loading involves placing a cell within a tapered constriction such that the application of pressure results in movement or deformation of the cell (Fig. 1). Extrusion loading was first demonstrated on mammalian cells using micropipettes 19. Bacteria are too small to manipulate with micropipettes (unless changed to sphereoplasts by removing the cell wall, which impairs cell viability 20) and nano-pipettes are prohibitively laborious. Here we demonstrate use of a micro-chip based device with sub micron tapered channels to apply extrusion loading to individual bacteria. Tapered channels have been used as a means for trapping or sorting of eukaryotic cells on microdevices 13, 14, 16, but the approach has not yet been applied to bacteria. The mechanical properties of a bacteria submitted to extrusion loading will determine how far it travels into the tapered channel. Bacteria that are more compliant may deform more, and therefore travel further into the tapered channel. Hence, when bacteria of similar size are forced into the tapered channels with the same applied pressure, the more compliant species/strain will travel further into the tapered channel. The distance traversed by the bacteria under these conditions is an indicator of cell stiffness, which may be influenced by bacterial structures (cell envelope, cytoskeleton-like proteins), turgor pressure, surface properties and permeability.
Fig. 1.
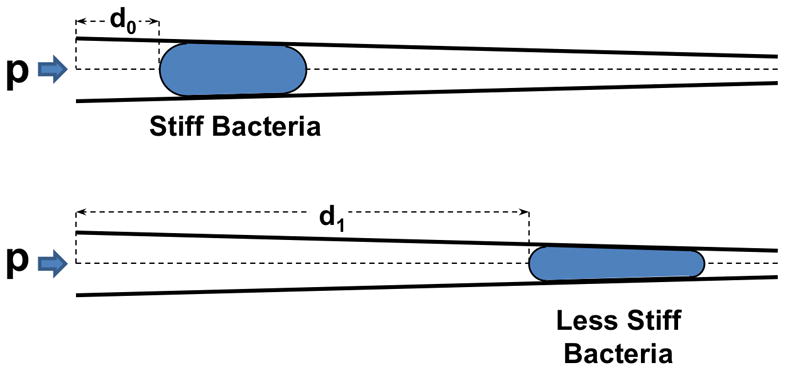
Extrusion loading involves forcing cells into tapered channels with fluid pressure (p). When submitted to extrusion loading, the distance a cell travels into a tapered channel will depend on cell stiffness with more compliant cells traveling further into the channels. The distance traveled by a cell into the tapered channel (d1) is therefore an indicator of cell stiffness.
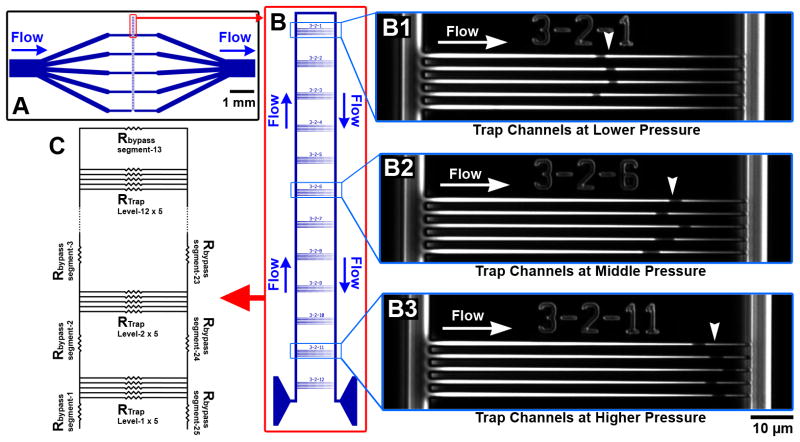
To test the concept we developed a microfluidic device consisting of a network of distribution channels and bypass channels in parallel with tapered channels, which we refer to as “trap channels” (Fig. 2A). The bypass channels make it possible to operate the system under constant flow without generating excessive pressure across trapped cells 21. Bacteria in solution may either flow through the bypass channel or into a trap channel. When a bacteria is secured in a trap channel, further flow into the trap is greatly reduced, making it unlikely that more than one cell will flow into each channel21, 22.
Fig. 2.
An extrusion loading device with controlled pressure gradient is shown. (A) A schematic of the device with five individual devices is shown. (B) A single extrusion loading device. Each extrusion loading device consists of twelve sets of channels. The pressure across each set of trap channels is greatest closest to the inflow (bottom of the figure) and decreases linearly up to the top bypass channel (top of the figure). (B1–3) Micrographs of single channel set. Each channel set contains 5 tapered channels. Bacteria trapped in the traps appear dark using phase contrast microscopy (white arrow heads). Note bacteria travel further into the channels when the pressure across the trap is greater (compare B1 to B3). (C) A hydraulic circuit model representing the segments of bypass channels and sets of trap channels is shown.
In our implementation, trap channels were designed with entrance dimensions larger than most bacteria (1.4 μm wide and 1.4 μm deep) and exit dimensions much smaller than individual bacteria (250 nm wide and 1.2 μm deep) with a trap length of 75 μm. Trap channels were placed in sets of five at regular intervals along the length of a bypass channel (Fig. 2B). Trap channels within a set were spaced 3 μm from each other, ensuring only negligible pressure differences within a set. The distance between each set of traps (65 μm) resulted in a constant pressure difference between each set of traps and made it possible to observe twelve different applied pressures levels within a single experiment.
Hydraulic Circuit and COMSOL Modeling
Hydraulic circuit calculations were used to estimate the pressure drop across channels in the microfluidic device. Distribution channels, bypass channels and trap channels in the device were represented by hydraulic resistors (Fig 2C).
The resistance of each rectangular channel was determined using the Hagen-Poiseuille relation, in which the relationship between the pressure drop ΔP and flow rate Q can be approximated as:
where η is the dynamic viscosity, and w, h, and l are channel width, depth, and length. A portion of the channel can be considered as a single resistor such that:
When multiple channels are connected in serial the total resistance Rtotal is:
and when multiple channels are connected in parallel the total resistance is:
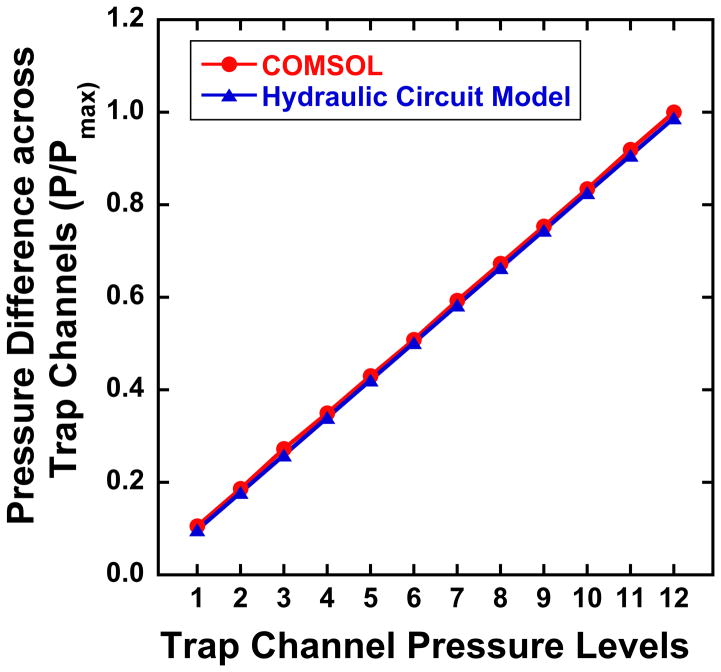
When all of the trap channels are occupied by bacteria, the pressure drop across one device (a single bypass channel with all trap channels occupied, Fig. 2B) is 67% of the pressure difference across the device inlet and outlet. Variation in occupancy rates of the trap channels is expected, however. We used the hydraulic circuit model to estimate the effect of unoccupied trap channels on pressure within the device. Additionally, a COMSOL (v4.3b, COMSOL, Inc., Burlington, MA, USA) model was also used to simulate the pressure differences across all trap channels within a device. Results from the hydraulic circuit model and COMSOL simulations were compared with each other.
Device fabrication
Traditional photolithography does not have the spatial resolution to fabricate channels with 250 nm wide exit end to retain bacteria cells. Deep UV (DUV) photolithography and Electron-beam (E-beam) lithography are two available options to achieve the required microchannel geometry. Deep UV photolithography 23, 24 was chosen because the methodology required less instrument time and associated costs.
The microfluidic device design was drawn using a CAD layout editor (L-Edit v15, Tanner EDA, Monrovia, CA, USA) and exported as a graphic data system file. The design was patterned on a chromium (Cr) coated, 6 inch quartz DUV mask reticle pre-coated with resist (IP3500, LQZ, Hoya, Tokyo, Japan) using a Laser Mask Writer (DWL2000, Heidelberg Instrument, Heidelberg, Germany). Fused silica was chosen as the substrate for our microfluidic device because of its transparency and resistance to deformation under high pressure, as compared to softer materials, such as Polydimethylsiloxane (PDMS). A 50 nm Cr layer was placed onto a 4 inch fused silica wafer using a sputtering deposition system (Orion 8, AJA International, Scituate, MA, USA) as the hard mask for the fused silica etch process. A 60 nm anti-reflection layer ARC AR3(2950 rpm for 25 sec, then soft bake at 205 °C for 60 sec) and 510 nm DUV210 photoresist (3930 rpm for 30 sec, then soft bake at 135 °C for 60 sec) were applied on top of the Cr layer using an automatic coat-develop tool (Gamma, Suss MicroTec AG, Garching, Germany). Desired patterns were exposed in a DUV stepper (ASML 300C, Veldhoven, Netherlands). Post-exposure bake (135 °C for 90 sec) and development (726 MIF, single puddle for 60 sec) of the photoresist was also performed using the coat-develop tool. Exposed ARC area was removed by etching in a RIE Etcher (PlasmaLab 80+, Oxford Instruments, Oxfordshire, England). Patterns were then transferred from photoresist to the Cr layer by Cr dry etch using a RIE/ICP Etcher (Minilock III, Trion Tehcnology, Tempe, AZ, USA). Fluoroform Argon etch was used to place patterns onto the fused silica wafer using the Cr layer as the hard mask in a RIE/ICP Etcher (PlasmaLab 100, Oxford Instruments, Oxfordshire, England). Residual photoresist, ARC, and polymer by-product generated during etching were removed by an oxygen plasma etch in a RIE Etcher (PlasmaLab 80+, Oxford Instruments, Oxfordshire, England). The dimensions of the etched channels were confirmed using a scanning electron microscope (UltraSEM, Zeiss, Oberkochen, Germany) and atomic force microscopy (Icon, Veeco, Plainview, NY, USA) using a high aspect ratio probe (AR5-NCHR, Nanosensors, Neuchâtel, Switzerland). Fluid inlet and outlet access holes were cut out from the wafer using a laser cutting tool (VLS3.50, VersaLaser, Punchbowl NSW, Australia). A second fused silica wafer was used to close the microfluidic device. After sequential acid/base cleaning (NH4OH+H2O2, then HCl+H2O, then spin rinse and dry), the two wafers were aligned at their flat edges and gently pressed together to form an initial bonding. The wafers were then annealed at 1,100°C for 5 hours with nitrogen in a furnace processing tube (Cryco, Austin, TX, USA).
Device assembly and operation
The inlet and outlet of the device were assembled using fluid ports and PEEK tubing (Idex, Oak Harbor, WA). A syringe pump (Fusion 400, Chemyx, Stafford, TX, USA) was used to push fluid into the device. A pressure transducer (SP70A, Senso-Metrics Inc., Simi Valley, CA, USA) was used to measure the pressure at the inlet of the device. Before an experiment, the microfluidic device, tubing, and other connections were flushed with PBS. During an experiment the flow rate on the syringe pump was manually adjusted until the desired pressure level was reached, and was then maintained during each experiment. Device set up and priming took 30–60 minutes. Once primed, flowing bacteria into the device took 2–5 minutes.
Biomechanical differences between E. coli and B. subtilis
Differences in cell stiffness between species were tested using Gram negative bacteria, E. coli (RP437/pTrc-GFP) and Gram positive bacteria B. subtilis (JH462). The two model species are the most commonly used in studies of bacterial mechanics. B. subtilis has a thicker cell wall and greater turgor pressure than E. coli and is therefore more stiff 4, 5. E. coli was cultured in TB medium and B. subtilis was cultured in LB medium. Both cultures were incubated at 37 °C overnight and a second culture generated from a 65 μL inoculant was grown into stationary phase before harvest (O.D. at 600 nm >1.1 for E. coli and >0.6 for B. subtilis). Under these growth conditions the average diameter of cells assessed using a 100X objective with phase contrast was 0.97 ± 0.04 μm for E. coli and 0.95 ± 0.03 μm for B. subtilis (mean ± standard deviation of 22 individual bacteria), hence the cell diameter between the two species was comparable (the diameters are consistent with observations by others 25–27). Cells were centrifuged at 2000 relative centrifugal force, and resuspended in PBS three times. The cells were allowed to settle in PBS for at least 10 minutes, and then delivered into a microfluidic device at inlet pressure of 0.21 MPa, a level determined in preliminary studies to result in B. subtilis presence mid-way through the length of the trap channels. Hydraulic circuit calculations determined that this inlet pressure resulted in a nominal pressure of 0.011 MPa across the pressure level 1 trap and 0.134 MPa across the pressure level 12 trap when all traps are occupied by bacteria, a condition we refer to below as the “nominal condition.” A mixed cell suspension in PBS containing both E. coli and B. subtilis cells was also applied into a microfluidic device. To differentiate the two species, GFP expression was induced in the E. coli RF437/pTrc-GFP strain prior to mixing the two cell populations. Epifluorescence microscopy was then used to distinguish GFP expressing E. coli from B. subtilis.
Biomechanical Differences Within E. Coli: Effects of Disruption of Cytoskeletal-like Proteins
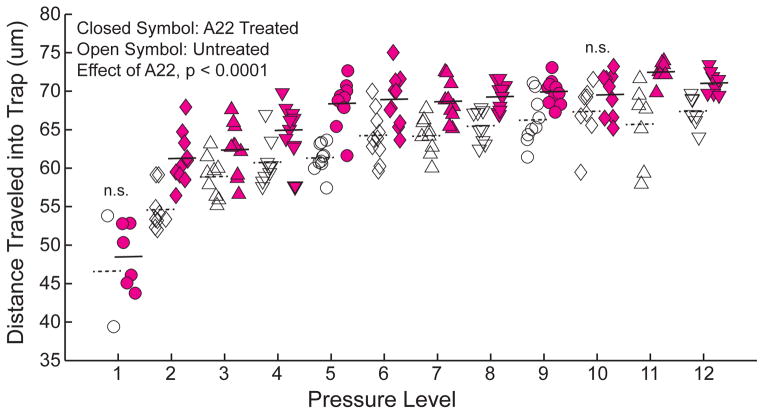
To test the ability to detect differences in cell stiffness within a species we applied an antibiotic treatment known to interrupt the cytoskeletal-like protein MreB. MreB is an actin homologue attached to the cell wall 28. Removing or disrupting the MreB protein causes E. coli to lose its rod shape and become spherical and disruption of MreB has previously been shown to lead to reductions in bacterial stiffness 6, 29. In the current study MreB was disrupted by the small molecule antibiotic A22. A22 acts by depolymerizing MreB6, 29, 30. E. coli cells were cultured and washed in PBS as described above and the culture split into two groups. The treated group was dosed with 100 μg/mL A22 in PBS and left in solution 30 minutes. The untreated group was left in PBS for 30 minutes without A22. Cells suspended in media were flowed into the device with an inlet pressure of 0.069 MPa (a pressure at which E. coli are typically trapped mid-way down the length of our trap channels). This inlet pressure resulted in a nominal pressure of 0.0037 MPa across the pressure level 1 trap and 0.045 MPa across the pressure level 12 (as determined with the hydraulic circuit model with all traps were occupied).
Image acquisition and data analysis
Images were recorded using an inverted microscope (Olympus IX71, Center Valley, PA) with a 60x phase contrast objective lens and a CCD camera (CoolSNAP, Photometrics, Tucson, AZ). A total of 15 traps could be observed within each field of view. Four fields of view were required to image the entire device (~ 5 minutes of acquisition time using manual stage movement). No changes in cell position were observed over the time required for image collection (0.5–1.0 hours for 3–4 devices in a single experiment).
The images are subsequently analyzed by ImageJ software (NIH). Each experiment involved examination of 240–480 individual bacteria and was repeated three times on different days using a fresh cell culture. Differences in the biomechanical profile between two groups were detected using ANCOVA implemented with a regression model that accounted for the effects of pressure level (as an ordinal value) and group (E. coli v. B. subtilis or A22 treated v. untreated). Cross-terms (pressure level * group) were examined when both pressure level and group showed p < 0.05. Differences between groups within each pressure level were determined using t-tests.
Results
The results from the hydraulic circuit and COMSOL simulation were consistent with each other (Fig. 3). The device was designed such that pressure decreased linearly with distance along the bypass channel from pressure level 12 (greatest pressure within each device) to pressure level 1 (Fig. 3). When there are many unoccupied trap channels, the pressure difference among sets of traps could be altered by as much as the difference between two pressure levels in the nominal condition (all traps occupied). To ensure that comparisons between pressures levels could be made from one experiment to the next, a hydraulic circuit model was made for the specific pattern of occupied/non-occupied channels within each experiment. Measurements from devices in which the pressure across a set of traps differed by more than 8% of that in pressure level 12 in the nominal condition were discarded. At most, one or two of the 5 devices in each experiment (Fig. 2A) were disqualified due to unacceptable variation in trap occupancy/pressure.
Fig. 3.
The pressure across traps determined using hydraulic circuit calculations and COMSOL models is shown at each of the 12 pressure levels within a device. The pressure difference is shown relative to that in the 12th pressure level (P12).
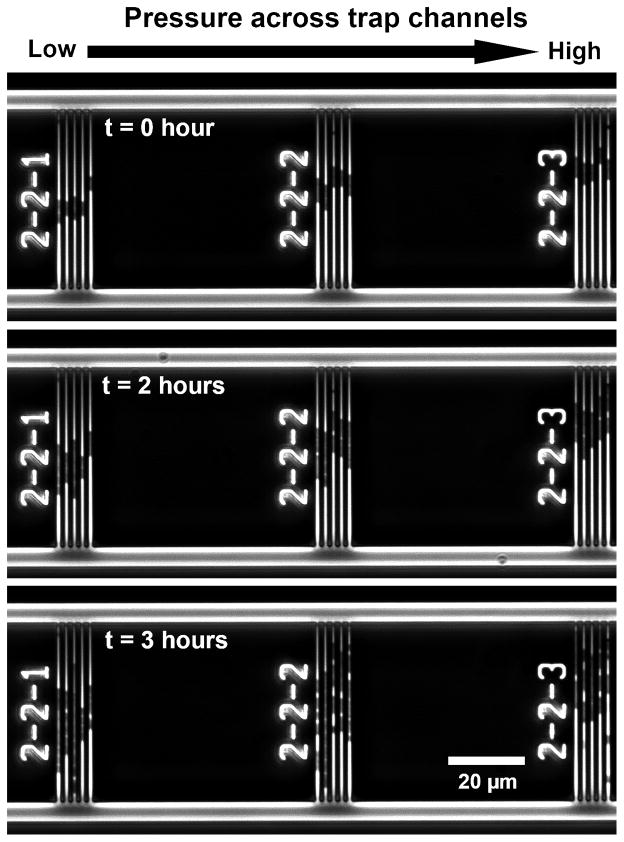
Cells traveled further into trap channels at higher pressures (Fig. 2D–F, Fig. 4). Bacteria were readily trapped in channels and trap occupancy typically exceeded 90%. Occupied traps rarely contained more than one cell. Cells remained viable while submitted to loading and continued to divide when supplied growth media (Fig. 4). The position of bacteria did not change when flow rate was reduced or stopped, but reversing fluid flow entirely caused bacteria to be released from the channels and move back into the bypass/distribution channels. With regard to differences between species, the biomechanical profiles indicated a significant difference in distance traversed by E. coli as compared to B. subtilis using ANCOVA (p < 0.0001 in each of the triplicate experiments, example data in Fig 5A). Cross-terms (pressure * species) indicated differences in the relationship between pressure level and distance traveled between the two species (p < 0.05 in all three repeated experiment). Within each pressure level, differences between E. coli and B. subtilis were observed (p < 0.01 at all 12 pressure levels in each of the three repeated experiments). Differences in the positions of trapped E. coli and B. subtilis within the device were evident when a cell suspension containing both species was placed into the system (Fig. 5B). Disruption of the MreB cytoskeletal-like protein by the A22 antibiotic allowed E. coli to travel further into the trap channels as detected using ANCOVA (p < 0.0001 in Fig. 6; p < 0.0001 and p =0.014 in repeated experiments), indicating that E. coli exposed to A22 had a different biomechanical profile than untreated cells. Effects of cross-terms (pressure * treatment) were not consistently observed (p = 0.0001, 0.06, 0.28). Differences between A22 treated and untreated E. coli were evident at 10 of the twelve different pressure levels (p < 0.02, t tests, Fig. 6). Differences between A22 treated and untreated cells were more apparent at larger pressure levels. Repeated experiments achieved similar results.
Fig. 4.
Bacteria submitted to constant loading with growth media continued to divide indicating cell viability is maintained during extrusion loading.
Fig. 5.
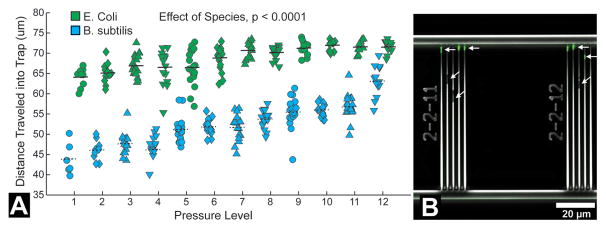
(A) The position of bacteria occupying trap channels at twelve different pressure levels (where level 1 is lowest and level 12 is greatest) in a single experiment are shown. Horizontal lines indicate averages at each pressure level. E. coli travel further into the traps than B. subtilis overall (p < 0.0001, ANCOVA) as well as at each individual pressure level (p <0.0001, t tests). Data shown are representative of three different experiments (p < 0.0001 in all three experiments by ANCOVA, p < 0.01 at all pressure levels in all three experiments by t test). (B) Differences in bacteria stiffness between species can be detected in a mixed culture are shown. E. coli expressing GFP (green, indicated by horizontal arrows) traveled further into the trap channels than B. subtilis (indicated by tilted arrows).
Fig. 6.
E. coli treated with A22 (closed symbols) to depolymerize the MreB cytoskeleton-like protein travel further into the traps than untreated E. coli (open symbols) indicating a different biomechanical profile (p < 0.0001, ANCOVA). Horizontal lines indicate average values at each pressure level. Data are representative of three different experiments (p = 0.014 and p < 0.0001 with ANCOVA in the other two experiments). Within each pressure level differences between A22 treated and untreated E. coli were detected at most pressure levels (p < 0.02, t test), but not in all (no detectable differences noted with ‘n.s’).
Discussion
To the best of our knowledge, the microfluidic platform we demonstrate here is the first microfluidic device that can differentiate bacteria based on a biomechanical property. The current work therefore adds the ability to detect biomechanical phenotypes of bacteria to the list of other bacterial phenotypes currently detectable using microchip-based methods such as ratcheting microchannels to fractionate a population of bacteria by cell length 31, positive dielectrophoretic measurements32, surface enhanced Raman spectroscopy33, and microfabricated fluorescence-activated cell sorting34. Cell sorting/separation and selection applications related to biomechanical phenotypes have potential advantages over selection based on other phenotypes in that biomechanical phenotypes are naturally present and could potentially be performed on environmental samples including uncultivable organisms. Additionally, our approach requires minimal sample preparation, no prior cell immobilization, no staining/labeling (as required for fluorescence and magnetic activated detection/sorting), may function across a range of possible ionic concentrations of the suspension media and does not noticeably impair cell viability.
The extrusion loading based approach we have presented makes it possible to non-permanently trap and stabilize individual bacteria for further imaging/analysis such as super-resolution microscopy used to examine subcellular components. The ability to constrain movement of bacteria without the use of chemical surface treatments is useful in that chemical treatments can impair cell viability and/or alter the location/function of subcellular components of interest. Based on the trapped location inside channels, the bacteria may also be indexed in an automated fashion.
One limitation of the current study is that it characterizes cell stiffness (deformability under load) but does not provide the underlying cause for differences in cell position within the trap which may include differences in turgor pressure, cytoskeletal-like proteins, surface properties associated with friction on the channel walls, permeability as well as the material properties of the bacterial cell wall (possibly from differences in peptidoglycan). For example, the surface properties may differ between the E. coli and B. subtilis strains examined, due to differences in surface glycoproteins between species or simply the presence of the outer membrane on E. coli. However, that we observed significant differences in biomechanical profile within E. coli associated with a stimulus (treatment with A22), suggests that factors other than surface properties are involved in the phenotype. The effects of turgor pressure and cell permeability are likely highly correlated and influence cell contact with channel walls and normal forces at the cell-channel wall interface, altering the contribution of friction. Manipulation of fluid media ionic concentration, channel wall angle and surface properties could theoretically be used to improve separation of cells for sorting applications. Evaluation of material properties of the load carrying components of bacteria is not straightforward in that it would require characterization of subcellular structure as well as a mechanical model to address issues of material non-linearity, friction against channel walls, material anisotropy and cross-sectional dimensions. Additionally, it is important to keep in mind that the current study used bacteria of similar size to demonstrate the ability to separate cells based on biomechanical properties. When larger differences in cell size are present it is expected that bacterial cell size will also influence the ability of a cell to traverse a trap channel, with smaller bacteria traveling further into the trap channels than larger bacteria. Comparisons of the biomechanical properties of bacteria with different sizes using our approach must therefore either be performed after separation by cell size or use a scaling factor to adjust findings for the size of the cell relative to channel dimensions.
While there is overwhelming agreement that E. coli is more compliant than B. subtilis (consistent with our results), there have been conflicting studies regarding the effects of treatment with A22 on the whole cell stiffness of E. coli. When using a whole cell bending test, disruption of MreB using A22 greatly reduced whole cell bending stiffness 35. In contrast, cell stiffness evaluated using hydrogel encapsulation did not observe a change in cell stiffness following A22 treatment 5. The disagreement between these two studies is likely explained by differences between the two loading modes 36. During whole cell bending the mechanical effect of MreB is expected to be larger because the MreB molecules are located along the outer cell radius, where the stiff molecules provide a large contribution to the second moment of inertia in bending. In a hydrogel encapsulation experiment, the bacteria are loaded in axial compression, a condition expected to minimize the mechanical contribution of MreB because the MreB molecules are loaded in series with the less stiff cell wall. During extrusion loading, the cell envelope is primarily loaded in axial tension, which, like axial compression, is expected to reduce the contribution of MreB to whole cell stiffness as compared to whole cell bending. As a result, we expected A22 to have only a modest effect on stiffness evaluated using extrusion loading. However, in extrusion loading there are also local bending and shear stresses generated due to contact with the channel walls and resulting cell deformations. We attribute the detectable change in biomechanical profile caused by A22 treatment to be due to local bending within the cell envelope, an explanation that is consistent with our finding that the effect of A22 treatment is more pronounced at higher pressure levels where the cell envelope has been forced to bend more in order to fit within the increasingly small dimensions of the tapered channel. One consequence of this interpretation is that mechanical models that include cell envelope bending (the thin shell model, for example) may be required to describe intact bacteria and that mechanical models that do not include bending are less likely to be descriptive of bacterial mechanics. A more thorough investigation of the deflections of the bacterial cell envelope during extrusion loading would be required to identify the most appropriate mechanical model for intact bacteria. Additionally, a study of the effects of A22 using different dosage and incubation times would be required to better understand the effects of changes in MreB on whole cell stiffness using extrusion loading, although others have shown that lower doses and incubation times as short at 1–2 minutes are sufficient to cause changes in cell stiffness 35.
Conclusion
In summary, we have presented a microfluidic platform that can determine the biomechanical profile of populations of bacteria. We have shown that detectable differences in bacteria stiffness can be observed with our technique, both between species and within a species treated with an antibiotic that disrupts the cytoskeletal-like protein. While the current study addresses cell profiling, simple alterations in the chip design such as truncating the trap channels (while keeping other dimensions the same) would allow less stiff bacteria to completely traverse the tapered channels, potentially allowing for separation/selection based on biomechanical phenotype, as has been demonstrated for eukaryotic cells 16. Reliable and fast methods to differentiate bacteria by phenotype are required in microbiology, molecular biology and applied fields such as food safety inspection, medical diagnostics, and biotechnology and the addition of biomechanical phenotyping represents a new tool that may be applied together with or in series with other phenotyping/sorting strategies.
Acknowledgments
This work was made possible by Grant AR065348 from NIAMS/NIH (C.J.H.). Its contents are solely the responsibility of the authors and do not necessarily represent the official views of the NIAMS or NIH. This work was performed in part at Cornell Nanobiotechnology center (NBTC), and the Cornell NanoScale Facility (CNF), a member of the National Nanotechnology Infrastructure Network, which is supported by the National Science Foundation (Grant ECCS-0335765).
References
- 1.Koch AL, Higgins ML, Doyle RJ. J Gen Microbiol. 1982;128:927–945. doi: 10.1099/00221287-128-5-927. [DOI] [PubMed] [Google Scholar]
- 2.Morris DM, Jensen GJ. Annual Reviews. Vol. 77. Palo Alto: 2008. Annual Review of Biochemistry; pp. 583–613. [DOI] [PubMed] [Google Scholar]
- 3.Misra G, Rojas ER, Gopinathan A, Huang KC. Biophysical Journal. 2013;104:2342–2352. doi: 10.1016/j.bpj.2013.04.047. [DOI] [PMC free article] [PubMed] [Google Scholar]
- 4.Nakanishi K, Kogure A, Fujii T, Kokawa R, Deuchi K. Journal of Nanobiotechnology. 2012:10. doi: 10.1186/1477-3155-10-22. [DOI] [PMC free article] [PubMed] [Google Scholar]
- 5.Tuson HH, Auer GK, Renner LD, Hasebe M, Tropini C, Salick M, Crone WC, Gopinathan A, Huang KC, Weibel DB. Mol Microbiol. 2012;84:874–891. doi: 10.1111/j.1365-2958.2012.08063.x. [DOI] [PMC free article] [PubMed] [Google Scholar]
- 6.Wang SY, Arellano-Santoyo H, Combs PA, Shaevitz JW. Proceedings of the National Academy of Sciences of the United States of America. 2010;107:9182–9185. doi: 10.1073/pnas.0911517107. [DOI] [PMC free article] [PubMed] [Google Scholar]
- 7.Bolshakova AV, Kiselyova OI, Yaminsky IV. Biotechnology Progress. 2004;20:1615–1622. doi: 10.1021/bp049742c. [DOI] [PubMed] [Google Scholar]
- 8.Deng Y, Sun MZ, Shaevitz JW. Physical Review Letters. 2011:107. doi: 10.1103/PhysRevLett.107.158101. [DOI] [PubMed] [Google Scholar]
- 9.Adamo A, Sharei A, Adamo L, Lee B, Mao S, Jensen KF. Analytical Chemistry. 2012;84:6438–6443. doi: 10.1021/ac300264v. [DOI] [PMC free article] [PubMed] [Google Scholar]
- 10.Hou HW, Li QS, Lee GYH, Kumar AP, Ong CN, Lim CT. Biomedical Microdevices. 2009;11:557–564. doi: 10.1007/s10544-008-9262-8. [DOI] [PubMed] [Google Scholar]
- 11.Rosenbluth MJ, Lam WA, Fletcher DA. Lab on a Chip. 2008;8:1062–1070. doi: 10.1039/b802931h. [DOI] [PMC free article] [PubMed] [Google Scholar]
- 12.Guo Q, Park S, Ma HS. Lab on a Chip. 2012;12:2687–2695. doi: 10.1039/c2lc40205j. [DOI] [PubMed] [Google Scholar]
- 13.Gifford SC, Derganc J, Shevkoplyas SS, Yoshida T, Bitensky MW. British Journal of Haematology. 2006;135:395–404. doi: 10.1111/j.1365-2141.2006.06279.x. [DOI] [PubMed] [Google Scholar]
- 14.Gifford SC, Frank MG, Derganc J, Gabel C, Austin RH, Yoshida T, Bitensky MW. Biophysical Journal. 2003;84:623–633. doi: 10.1016/S0006-3495(03)74882-6. [DOI] [PMC free article] [PubMed] [Google Scholar]
- 15.Herricks T, Antia M, Rathod PK. Cellular Microbiology. 2009;11:1340–1353. doi: 10.1111/j.1462-5822.2009.01334.x. [DOI] [PMC free article] [PubMed] [Google Scholar]
- 16.McFaul SM, Lin BK, Ma HS. Lab on a Chip. 2012;12:2369–2376. doi: 10.1039/c2lc21045b. [DOI] [PubMed] [Google Scholar]
- 17.Forsyth AM, Wan JD, Ristenpart WD, Stone HA. Microvasc Res. 2010;80:37–43. doi: 10.1016/j.mvr.2010.03.008. [DOI] [PubMed] [Google Scholar]
- 18.Lee SS, Yim Y, Ahn KH, Lee SJ. Biomedical Microdevices. 2009;11:1021–1027. doi: 10.1007/s10544-009-9319-3. [DOI] [PubMed] [Google Scholar]
- 19.Needham D, Hochmuth RM. Biophysical Journal. 1992;61:1664–1670. doi: 10.1016/S0006-3495(92)81970-7. [DOI] [PMC free article] [PubMed] [Google Scholar]
- 20.Martinac B, Buechner M, Delcour AH, Adler J, Kung C. Proc Natl Acad Sci U S A. 1987;84:2297–2301. doi: 10.1073/pnas.84.8.2297. [DOI] [PMC free article] [PubMed] [Google Scholar]
- 21.Hulme SE, Shevkoplyas SS, Apfeld J, Fontana W, Whitesides GM. Lab on a Chip. 2007;7:1515–1523. doi: 10.1039/b707861g. [DOI] [PubMed] [Google Scholar]
- 22.Rowat AC, Bird JC, Agresti JJ, Rando OJ, Weitz DA. Proceedings of the National Academy of Sciences of the United States of America. 2009;106:18149–18154. doi: 10.1073/pnas.0903163106. [DOI] [PMC free article] [PubMed] [Google Scholar]
- 23.Tipton M, Misium G, Garza C, Eguchi M. Journal of Vacuum Science & Technology B. 1990;8:1740–1744. [Google Scholar]
- 24.Totzeck M, Ulrich W, Gohnermeier A, Kaiser W. Nature Photonics. 2007;1:629–631. [Google Scholar]
- 25.Reshes G, Vanounou S, Fishov I, Feingold M. Biophys J. 2008;94:251–264. doi: 10.1529/biophysj.107.104398. [DOI] [PMC free article] [PubMed] [Google Scholar]
- 26.Furchtgott L, Wingreen NS, Huang KC. Mol Microbiol. 2011;81:340–353. doi: 10.1111/j.1365-2958.2011.07616.x. [DOI] [PMC free article] [PubMed] [Google Scholar]
- 27.Misra G, Rojas ER, Gopinathan A, Huang KC. Biophys J. 2013;104:2342–2352. doi: 10.1016/j.bpj.2013.04.047. [DOI] [PMC free article] [PubMed] [Google Scholar]
- 28.Garner EC, Bernard R, Wang WQ, Zhuang XW, Rudner DZ, Mitchison T. Science. 2011;333:222–225. doi: 10.1126/science.1203285. [DOI] [PMC free article] [PubMed] [Google Scholar]
- 29.Jiang HY, Si FW, Margolin W, Sun SX. Biophysical Journal. 2011;101:327–335. doi: 10.1016/j.bpj.2011.06.005. [DOI] [PMC free article] [PubMed] [Google Scholar]
- 30.Iwai N, Nagai K, Wachi M. Bioscience Biotechnology and Biochemistry. 2002;66:2658–2662. doi: 10.1271/bbb.66.2658. [DOI] [PubMed] [Google Scholar]
- 31.Hulme SE, DiLuzio WR, Shevkoplyas SS, Turner L, Mayer M, Berg HC, Whitesides GM. Lab on a Chip. 2008;8:1888–1895. doi: 10.1039/b809892a. [DOI] [PubMed] [Google Scholar]
- 32.Hawkins BG, Huang C, Arasanipalai S, Kirby BJ. Anal Chem. 2011;83:3507–3515. doi: 10.1021/ac2002017. [DOI] [PubMed] [Google Scholar]
- 33.Walter A, Marz A, Schumacher W, Rosch P, Popp J. Lab Chip. 2011;11:1013–1021. doi: 10.1039/c0lc00536c. [DOI] [PubMed] [Google Scholar]
- 34.Chen CH, Cho SH, Chiang HI, Tsai F, Zhang K, Lo YH. Anal Chem. 2011;83:7269–7275. doi: 10.1021/ac2013465. [DOI] [PubMed] [Google Scholar]
- 35.Wang S, Arellano-Santoyo H, Combs PA, Shaevitz JW. Proc Natl Acad Sci U S A. 2010;107:9182–9185. doi: 10.1073/pnas.0911517107. [DOI] [PMC free article] [PubMed] [Google Scholar]
- 36.Beer FP, Johnston ER. Mechanics of Materials. McGraw-Hill; New York, NY, USA: 1992. [Google Scholar]


