Abstract
Recent advances in registration have extended intra-surgical image guidance from its origins in bone-based procedures to new applications in soft tissues, thus enabling visualization of spatial relationships between surgical instruments and subsurface structures before incisions begin. Preoperative images are generally registered to soft tissues through aligning segmented volumetric image data with an intraoperatively sensed cloud of organ surface points. However, there is currently no viable noncontact minimally invasive scanning technology that can collect these points through a single laparoscopic port, which limits wider adoption of soft-tissue image guidance. In this paper, we describe a system based on conoscopic holography that is capable of minimally invasive surface scanning. We present the results of several validation experiments scanning ex vivo biological and phantom tissues with a system consisting of a tracked, off-the-shelf, relatively inexpensive conoscopic holography unit. These experiments indicate that conoscopic holography is suitable for use with biological tissues, and can provide surface scans of comparable quality to existing clinically used laser range scanning systems that require open surgery. We demonstrate experimentally that conoscopic holography can be used to guide a surgical needle to desired subsurface targets with an average tip error of less than 3 mm.
Index Terms: Image guided surgery, laser scanning, minimally invasive surgery, surface registration
I. Introduction
To assist with surgical decision making, it is useful to display to the surgeon in real time the position and orientation of surgical tools with respect to internal anatomical structures that cannot be directly viewed. One method of accomplishing this with intraoperative imaging is through image overlay, where a semitransparent display (e.g., a half-silvered mirror) displays internal features at the correct spatial location with respect to anatomy, allowing the surgeon to visualize structures beneath the surface that otherwise cannot be seen [3]–[5].
However, often, one does not have access to intraoperative imaging, or such imaging (e.g., ultrasound) is lower quality than the preoperative images available (e.g., computed tomography (CT) or MRI). In some areas of the body such as the skull, a rigid registration can be performed based on fiducials or bone features to align preoperative image space with physical space (see [6] or [7] for an overview). Thorough overviews of the state of the art in all the various aspects of registration and its application in image-guided surgery are available in [8] and [9]. While fiducial-based rigid registration works well in bone, soft tissues lack suitable alignment features and cannot support rigid screw connections, which makes registration more challenging. Because of this, surface-based registration is often employed in soft tissues.
Surface-based registration typically involves matching a segmented preoperative image to a large number of organ surface points collected intraoperatively. An optically tracked touch-probe-based system has been used for this purpose by Maurer et al. for registration of segmented CT images to the skull [10]. Herline et al. applied the same contact-based concept to soft-tissue (liver) registration [11]. One drawback of touch probes for registration is that the applied pressure deforms the organ surface, thereby reducing the accuracy of registration. Furthermore, care must be taken to avoid inducing trauma or irritation to the organ surface via the probe. These issues inspired the development of noncontact surface scanning techniques.
A common method of noncontact scanning is the use of a laser range scanner (LRS). LRS systems work by triangulating the location of a projected laser point. With the knowledge of the direction of projected laser light and an observation of where it appears in a camera image, one can determine the location of the illuminated point in 3-D space. Rapidly panning the laser allows the LRS to acquire a large number of points without moving the sensor physically. LRS has been applied to intraoperative liver registration [12], and used together with additional sources of information like video for real-time organ tracking and/or enhanced registration accuracy [13], [14].
The system of Cash et al. [12] is of particular interest with respect to our current study because the system we describe addresses similar clinical objectives and works in almost the same way, except that our technique can be deployed minimally invasively. Cash et al.’s system consists of an optical tracker that tracks surgical tools and an LRS unit. Registration of preoperative image data to organ surface points collected by the LRS allows the position of surgical tools and subsurface anatomy to be displayed in real time on a computer display to guide surgical decision making before and during incisions. Registration of the preoperative image is performed via the iterative closest point (ICP) algorithm [15]. This paper was the foundation of the commercial SurgiSight system (Pathfinder Therapeutics, Inc., Nashville, TN). The primary drawback of LRS surface registration, as currently implemented, is its requirement of wide exposure of the organ of interest to enable the LRS to triangulate points.
Another approach to surface scanning is the BrainLAB z-touch system [16], where the optical tracker tracks the laser dot on the tissue surface directly, rather than fiducials on the LRS emitter base unit. This has the advantage of removing calibration between the fiducials and the LRS coordinate system as a source of error. It also has the advantage of enabling the surgeon to directly specify the points collected (ensuring that they all belong to the organ of interest) in a manner similar to “painting” the desired organ surface with a laser pointer. The main drawback is that wide exposure is still required to enable all cameras in the optical tracking system to visualize the laser dot. The tracked Conoprobe system we describe in this paper retains the advantage of being able to “paint” the desired surface, but does so minimally invasively.
Perhaps the most similar system to the tracked Conoprobe we propose in this paper is the Medtronic FAZER, a part of the Stealth Station (Medtronic, Inc., Minneapolis, MN), which has been used for CT head registration [17]. This system uses a tracked 1-D laser range finder that returns distance measurements which can be converted into 3-D points. Although little technical information is available about the proprietary FAZER system, the relatively large size and shape of the handheld emitter suggest that a triangulation approach is employed, which would preclude single-port minimally invasive use of the device. In any case, there has been no reported investigation to date of using the FAZER through a laparoscopic port.
To provide a low-cost, nonproprietary, minimally invasive alternative for collecting an intraoperative point cloud and thereby to enable soft-tissue image guidance, we propose a conoscopic holography-based system, as illustrated in Fig. 1. Here, a Conoprobe (~$5000 Conoprobe Mark 3, Optimet Optical Metrology Ltd., Jerusalem, Israel), which uses the principles of conoscopic holography as discussed in Section II, is fixed to one end of a hollow tube, which passes through a standard laparoscopic port. The Conoprobe is tracked using an optical tracking system and provides distance measurements to points on the tissue. As the laser point is traced over the organ surface by appropriate manual manipulation, a cloud of surface points on the organ is produced. As a side note, we have observed that it is possible to redirect the laser beam with a mirror over significant distances without compromising distance measurement accuracy, so automated aiming systems at the tip of a laparoscopic tube are also possible with a Conoprobe. Although our particular application of abdominal soft-tissue scanning does not require automation, it may be useful in other future applications (see, for example, the hearing aid fitting system of Prasciolu [18], which uses a micromirror to bounce the laser over very short distances).
Fig. 1.
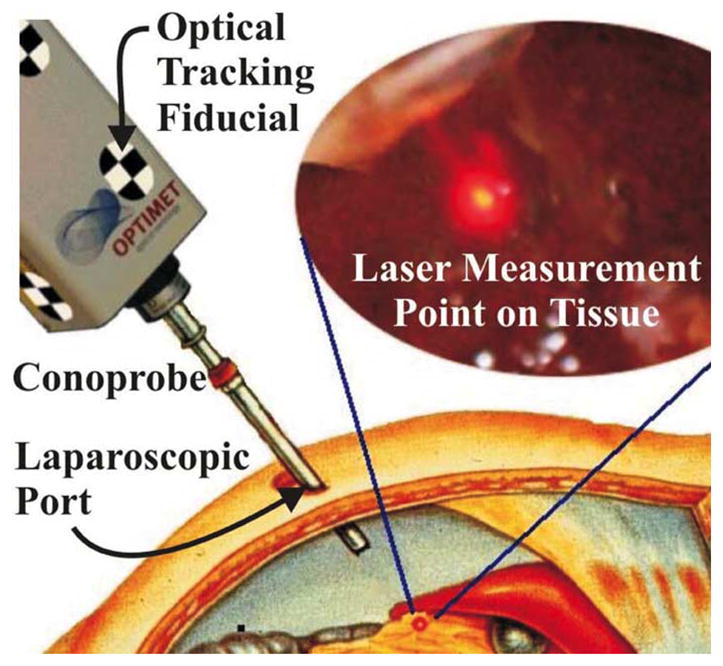
Conceptual drawing of organ surface scanning using conoscopic holog-raphy. The tracked Conoprobe returns distance measurements, which are converted to a point cloud that defines the shape of the tissue surface.
In this paper, we contribute the concept of applying conoscopic holography, a technology originally developed for manufacturing quality control, to enable minimally invasive soft-tissue image guidance. We provide experimental proof of concept and accuracy assessment for Conoprobe measurements of distance to biological tissue surfaces. We also compare 3-D point clouds collected to known parametric surface shapes to demonstrate the fidelity of surface scans. Finally, we validate the complete system, using a Conoprobe surface scan to guide a needle to targets inside a phantom liver, where targets are selected in a preoperative CT scan volume.
II. Experiments: Overview and Test Bed
Using the experimental setup shown in Fig. 2, we conducted a series of experiments to assess the feasibility of applying conoscopic holography for minimally invasive image registration to soft tissues. The first set of experiments described in Section III was designed to measure the Conoprobe’s accuracy and repeatability when making measurements to various surfaces including biological tissues. A second set of experiments described in Section IV was designed to assess whether Prasciolu’s mirror aiming technique [18] will work over longer distances.1 A third set of experiments (see Section V) evaluated the Conoprobe system’s ability to scan surfaces of known geometry and varying surface characteristics. A final experiment described in Section VI simulated the placement of a surgical needle in the liver using preoperative images for guidance. In this experiment, an anthropomorphic rubber liver phantom model was CT scanned, and a Conoprobe-enabled surface scan was used to register the CT volume to physical coordinates. The needle was then inserted to desired targets identified in the CT volume. Before discussing each of these experiments in detail, we first describe the components of the overall experimental setup shown in Fig. 2.
Fig. 2.

Experimental setup for surface scanning using the tracked Conoprobe. Optical and magnetic origins are indicated. The black and white optical tracking fiducials can be seen on the Conoprobe and needle assembly.
Conoprobe
The principles by which conoscopic holography measures distance were proposed by Sirat and coworkers [19], [20]. The system illuminates an area of interest with a columnated light source. The cone of light returning from the illuminated area is filtered and then enters a birefringent crystal (see Fig. 3). Inside the crystal, constructive and destructive interference occurs, which results in a Fresnel pattern from which distance can be deduced. Conoscopic holography is currently used for distance measurement in industrial profilometers, where it is combined with a motorized X–Y stage. This enables highly accurate measurements of dimensions on machined components and is useful for manufacturing process control.
Fig. 3.
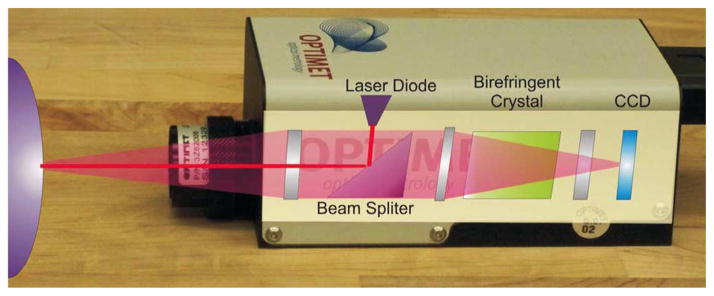
Photograph of the Optimet Conoprobe Mark 3.0, the off-the-shelf conoscopic holography system used in our experiments, which collects high-precision distance measurements. Superimposed is a conceptual diagram of the basic components generally used in conoscopic holography to process returning light. The end product is an interference fringe pattern on the CCD sensing array at the back of the device, from which distances are computed.
The published specifications for the Conoprobe Mark 3 (Optimet, Inc.) with a 200-mm objective lens list a measurement precision <70 μm. The lateral size of the laser measurement spot is 170 μm. Specifications for the 250-mm lens used in our experiments are not published but are similar. It is also known that surfaces that diffuse the red laser light of the scanner can reduce accuracy of the measurement, which motivates our experiments in Section III to validate the precision of the Conoprobe under these conditions.
The measurement range of the Conoprobe depends on the focal length of its lens. With a 250-mm lens, the range is 155–337 mm. Since light returns from the measurement spot to the Conoprobe in a conical shape, one must also ensure that the trocar will cause minimal interference with the returning light. Using the inside diameter of the lens barrel (22.8 mm) for the base of the cone, the return beam will be 10 mm (a typical trocar diameter) wide at 44% of its return path. Thus, the distance between the trocar and the desired measurement point must be 0–148 mm for our particular lens. We note that these values can be designed as desired by choosing the appropriate lens focal length and trocar diameter.
The Conoprobe has two primary adjustments that are used to optimize the system to the properties of the surface to be measured. These are laser output power and sampling frequency of the charge-coupled device (CCD). These two settings together determine the level of light that reaches the CCD. Increasing laser power and decreasing the sampling rate (increasing sampling period) both increase the CCD’s exposure. Thus, the settings are analogous to increasing the ambient lighting and exposure time in conventional photography.
Optical Tracker
In the experiments that follow, we use the MicronTracker 2 H3-60 (Claron Technology, Inc.). This is a passive optical tracking system that uses black and white checkerboard fiducials to identify and track objects in its field of view. The sensor head contains three 1280 × 960 pixel cameras whose images are processed using software supplied by the manufacturer to produce a coordinate frame transformation of the fiducial, which is rigidly attached to the surface of the Conoprobe. The H3-60 has a roughly wedge-shaped workspace extending from the sensor head, and targeting accuracy of a single vertex is specified by the manufacturer at 0.20 mm. The maximum sample rate is 15 Hz, which, in our initial proof-of-concept experiments described in this paper paper, also defines the maximum data capture rate of the system. Note that the Conoprobe measurements can be collected at significantly higher frequencies, since exposure time of its internal CCD elements is approximately 1–3 ms, depending on light levels. If a higher update rate is desired, it can be achieved simply through the use of an optical tracker with a faster update rate. The Conoprobe and camera measurements are synchronized via a timing pulse sent from the Conoprobe to the camera.
Other Components Used
Test samples were positioned using an A25 series UniSlide linear slide from Velmex, Inc., with a 30-cm range of travel and a positioning resolution of 0.01 mm. A Velmex rotary table A5990T3 with a rotational resolution of 0.1° was used to rotate the mirror for the experiments that required mirror movement. The mirror we used was a front surface rather than rear surface mirror to eliminate the effects of optical refraction from mirror glass. The preoperative images used in the needle-placement experiment were taken with a standard clinical CT imager at the Vanderbilt University Medical Center.
III. Conoprobe Repeatability and Accuracy
Before performing surface scans with the entire system described in Section II, we experimentally validated the accuracy and repeatability for the Conoprobe itself when making measurements to ex vivo and phantom tissues. These experiments were designed to establish the baseline capabilities of the Conoprobe, in order to provide context for the surface scanning results described in Sections V and VI. We undertook these experiments because the published specifications of the Conoprobe, discussed in Section II, assume nonbiological surfaces such as metal or plastic, rather than biological tissues that may absorb or diffuse laser light. Absorption could weaken the return signal and necessitate adjusting laser power or CCD sampling time. Diffusion could blur the fringe pattern, thus reducing measurement accuracy.
Our experimental setup for the experiments described in this section (see Fig. 4) consists of the Conoprobe, the linear slide, and various test samples. The axis of the slide was aligned with the Conoprobe laser, and both slide and Conoprobe were firmly clamped to the table to fix their relative positions. In both of the following sets of experiments, the following test samples were used: 1) a control sample of flat white paper (which provided a strong return signal with excellent SNR, as reported by the Conoprobe); 2) an ex vivo bovine liver; 3) an ex vivo bovine muscle; and 4) an ex vivo bovine liver with a topical surface preparation of talcum powder. This last sample was included because surface dusting is recommended by the manufacturer for less reflective surfaces. It was not motivated by any deficiency in measurements of untreated liver, but simply to provide a backup method for enhancing Conoprobe measurements if/when such enhancement is necessary in future studies with other types of biological tissues. Laser power and frequency were both experimentally adjusted to provide a signal close to 50% saturation (as reported by the Conoprobe manufacturer’s software interface) for each tissue type, since this resulted to good accuracy. The resulting Conoprobe parameters are shown in Table I.
Fig. 4.

Baseline Conoprobe measurements were collected using a manually actuated precision linear slide. Tick marks on the actuation handle (visible at the left-hand end side of the slide) can resolve 10 μm of linear sample motion. One full-handle revolution produces 2 mm of sample travel.
Table I.
Experimental Conoprobe Power Levels (Percent of Max Power) and Acquisition Rates for Various tissue Types
| Tissue Type | Laser Power | Conoprobe Exposure |
|---|---|---|
|
| ||
| White Paper | 31.25% | 1000Hz |
| Bovine Muscle | 62.50% | 400Hz |
| Bovine Liver | 62.50% | 100Hz |
| Liver with Surf. Prep. | 62.50% | 1000Hz |
Repeatability Experiment: In order to determine the repeatability of Conoprobe measurements, we collected distance measurements at three points, the beginning (~160 mm from the Conoprobe), middle (~240 mm), and end (~330 mm) of the Conoprobe’s measurement range. At each point, ten measurements were recorded by momentarily interrupting and then reestablishing the Conoprobe’s laser beam. Standard deviations of the measurements are shown in Fig. 5.
Accuracy Experiment: We performed a second set of experiments that aimed at assessing accuracy over the Conoprobe’s measurement range. To do this, we began by recording an initial position near the minimum end of the measurement range, which we defined as a reference position for subsequent measurements. The linear slide was then used to move the sample in increments of 10.00 mm away from the Conoprobe until it reached the far end of the measurement range. For each increment, Conoprobe readings were used to compute distance traveled. The deviation of this distance increment from the actual increment of 10.00 mm is plotted in Fig. 6.
Interpretation of Results: These results establish baseline precision and accuracy levels of the Conoprobe sensor itself, which are useful in interpreting the results of surface scanning experiments described in Section V, and needle placement described in Section VI, since surface scan errors contain both sensor noise and noise induced by optical tracking and coordinate frame conversions simultaneously. It is worth noting that a surface treatment of talcum powder makes measurements nearly equivalent to white paper. Also, the shape of the error for untreated liver appeared to be repeatable, and compensation by calibration may be possible in the future.
Fig. 5.
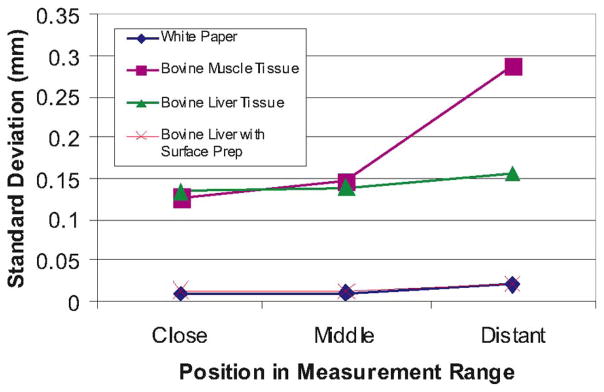
Standard deviations of repeated measurements taken with various tissue and control samples over the Conoprobe’s measurement range. Each point represents the standard deviation of ten repeated measurements taken at the beginning, middle, and end of the Conoprobe’s measurement range.
Fig. 6.
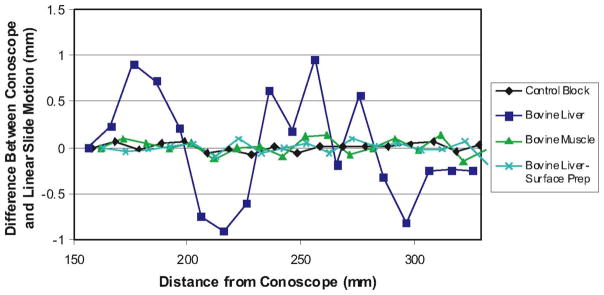
Experimental Conoprobe measurement error versus distance for biological tissues. Each data point above shows the difference from 10 mm recorded by the Conoprobe when the sample was physically transported 10.00 mm.
IV. Mirror Laser Deflection Experiments
Since it may be useful in some future systems (though not all) to automate laser aiming, we investigated the use of mirrors to deflect the Conoprobe’s measurement direction. The use of either fixed or moving mirrors could allow measurements in areas that cannot be accessed via line of sight from outside the body. A front surface mirror was used for these experiments to ensure no optical refraction took place inside the mirror. Two experiments were conducted: one with a fixed mirror and linearly moving target, and one with a fixed target and rotating mirror (see Fig. 7). In the latter experiment, the Conoprobe measurement point traced out a line on the target.
Fig. 7.
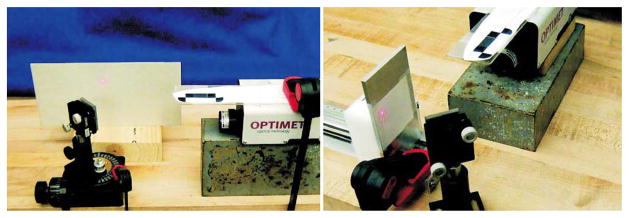
Experimental setup for mirror deflection experiments (left) rotating mirror experiment and (right) fixed mirror, translating sample experiment.
The fixed mirror, moving target experiment was similar to the accuracy experiment described in the previous section, except that the Conoprobe and flat white paper target were oriented at right angles to one another with an angled mirror between them, as shown in Fig. 7 (right). The target surface was then moved in 10.00 mm increments by the linear slide. Fig. 8 shows a comparison of the actual distance traveled versus the distance reported by the Conoprobe. The results of this experiment were similar to the results of the linear experiment with no mirror shown in Fig. 6.
Fig. 8.
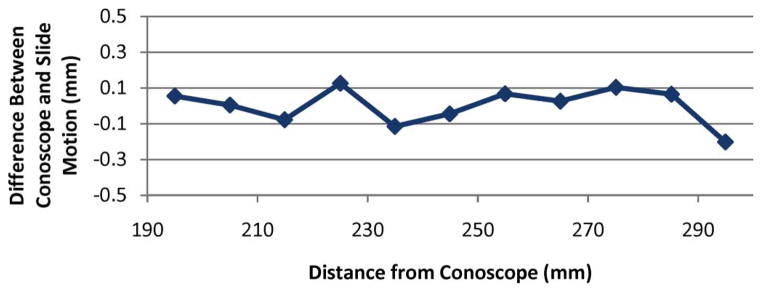
Experimental data for the fixed mirror, moving target experiment. Each data point above shows the difference from 10 mm recorded by the Conoprobe when the target was physically transported 10.00 mm. Comparing these data to the data shown in Fig. 6 reveals no discernible measurement accuracy effects from using a mirror to aim the Conoprobe beam.
In a second path deflection experiment, the white paper target and Conoprobe were both fixed at right angles with respect to one another. The mirror between them was mounted to the rotary Velmex table, as shown in Fig. 7 (left). The mirror was then rotated to pan the measurement point across the surface of the target. The mirror angle and the Conoprobe-reported distance were recorded. Deviations between data and a perfect line are shown in Fig. 9.
Fig. 9.
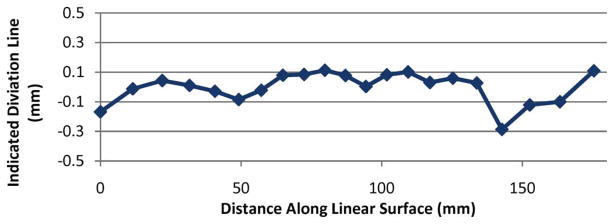
Deviation from a perfect line traced on the target plane as the mirror rotates, sweeping the Conoprobe measurement point across it.
V. Surface Scanning Experiments
Using the experimental setup described in Section II (without the magnetic tracker), we conducted surface scanning experiments for known parametric surfaces with a variety of surface properties, including biological tissues. During measurements, the Conoprobe was held approximately 1 m in front of the optical tracker and 20–30 cm from the phantom along the axis of the laser. The beam was manually scanned over the surface of the phantom. Both spherical and flat objects with a variety of surface properties were scanned in this way, and the data was fit to the known shapes of the objects scanned. Before presenting the data, we describe the calibration and fitting processes necessary for accurately reconstructing the surface point cloud.
A. Calibration
First, the position of each sensed point on the surface was expressed in the world (optical tracker) frame as
| (1) |
where c denotes the Conoprobe lens frame and m denotes the fiducial marker frame. Here, cpsensed has zero y- and z-components, and the Conoprobe reading as its x-component. The transformation worldTm is given directly by the optical tracking system. The transformation between the Conoprobe measurement frame (located at its lens) and the fiducial marker frame on its surface mTc is unknown and must be determined by calibration.
In contrast to rigid surgical tools where one might apply a pivot calibration, the distance to the point of interest here has no rigid physical structure attached to it. Thus, we calibrated using several measurements along its axis returned by the Conoprobe. In this case, one might also consider applying a solution to the “hand–eye” calibration problem (e.g., the dual quaternion formulation of [21]), but in our case, a simpler calibration procedure is possible, since we know that sensed measurements will always lie along a single axis in the sensor (Conoprobe lens) frame.
We performed this calibration by aiming the Conoprobe laser at a second fiducial marker that was not attached to the Conoprobe, the position of which (worldPn ) was sensed by the optical tracking system. We repeated this for multiple Conoprobe poses. Then, parameterizing the rotation using Euler angles, we applied Matlab’s fminsearch to minimize
| (2) |
over the Euler angles and translation that compose the unknown transformation. The sum over i ∈ {1, . . . , n} accounts for each of the n Conoprobe pose measurements made earlier.
B. Registration Algorithm
We conducted experiments with two parametric surfaces, a plane and a sphere. The algorithm for registering the known shape to the data was identical in both cases, except for the objective function. In both cases, we minimized the surface parameters over the distance between measured data and the known surface shape using Matlab’s fminsearch. For the plane ax + by + cz + d = 0, we minimized the sum of the square of distances between the plane and each point
| (3) |
over the parameters of the plane, a, b, c, and d.
For the sphere (x − xc )2 + (y − yc )2 + (z − zc )2 = r2 , we minimized the sum of the square of the radial distances between the sphere and each point, namely,
| (4) |
over the sphere parameters xc , yc , zc , and r.
C. Parametric Surface Scans
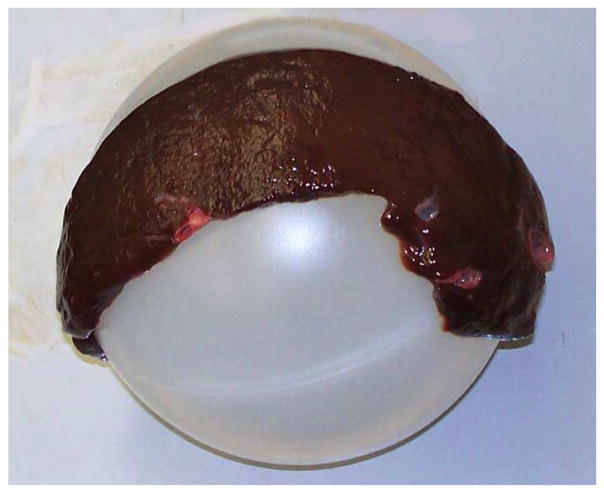
Using the calibration and registration procedures outlined before, we scanned and fit two planes and two spheres. A control plane was created by attaching a piece of white paper to a flat metal surface. A liver “plane” was created by laying a 5.4-mm-think slice of bovine liver flat on a piece of metal. Although this did not create a perfectly flat liver surface, it did create one that was as nearly flat as possible. We also scanned a semitranslucent, polypropylene plastic sphere, as well as the “liver sphere” shown in Fig. 10. The liver sphere was created in a manner similar to the flat liver phantom, namely, by draping the same 5.4 mm slice of bovine liver over the plastic sphere.
Fig. 10.
Liver tissue supported by spherical plastic ball creates a liver sphere.
We collected point clouds with the tracked Conoprobe system for each of these surfaces and fitted the clouds to their corresponding parametric surfaces, as described in Section V-B. Fig. 11 shows the data returned from the Conoprobe scan of the liver sphere, together with a section of the parametric sphere fit to the point cloud. The results of all parametric scan experiments are summarized in Table II. Note that fitted radii and plane parameters are very near known actual values, and standard deviations are low—even when the sphere is covered with ex vivo liver tissue.
Fig. 11.
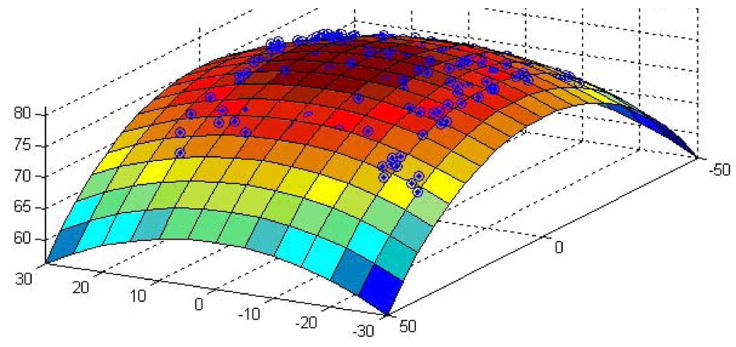
Liver sphere scan data with fitting parametric surface superimposed.
Table II.
Experimental Data for Parametric Surface Scans
| Plane | Liver Plane | Sphere | Liver Sphere | |
|---|---|---|---|---|
| # pts. | 800 | 400 | 400 | 400 |
| Surface | White Paper | Liver | Plastic | Liver |
| Radius | — | — | 75.0mm | 80.4mm |
| Fit Radius | — | — | 74.3mm | 81.0mm |
| Std. Dev. | 0.24mm | 1.22mm | 0.47mm | 0.61mm |
VI. Conoprobe Enabled Needle Tip Placement
Having verified the Conoprobe’s ability to record known shapes, we performed a final experiment to evaluate the entire envisioned surgical workflow, from the surgeon’s selection of desired targets on medical images, to use the Conoprobe in registration, to final positioning of a needle tip at the desired location(s) specified by the surgeon. This experiment approximates the steps that might be taken to insert a biopsy needle or ablation probe into a liver or other soft tissue organ. Final tip accuracy is assessed using the magnetic tracker, which is not used in any previously described step, and would not be part of an eventual clinical system.
A. Experimental Setup
The experimental setup for this experiment was as shown in Fig. 2. The Conoprobe with attached fiducials was as described in Section V. The power and frequency were 70%, and 300 Hz, respectively, selected as discussed in Section III. The Micron tracker was placed on the same work surface as the liver phantom, approximately 1 m laterally and 35 cm vertically above the liver phantom. The origin of the optical coordinate frame is located in the center of the Micron tracker.
The Aurora magnetic tracker was used as an external measurement system to identify the location and orientation of the target and needle tip (both were equipped with embedded magnetic tracking coils). The needle was a 13-g beveled needle to which we also attached an optical fiducial marker near the base of the needle (only optical information was used for targeting and insertion of the needle—with magnetic information used for tip placement accuracy measurement). The target was a second magnetic tracking coil encased in a plastic catheter. It could be inserted to a variety of locations within the phantom liver through small channels created during the molding process. The phantom was a cast silicone rubber replica of a human liver (see Fig. 12).
Fig. 12.
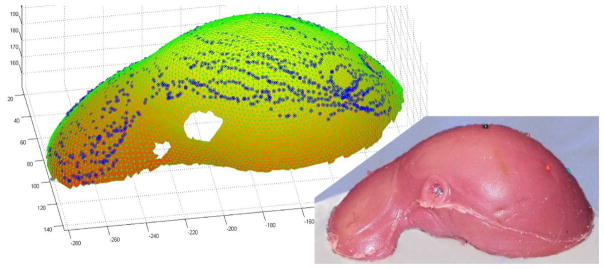
Scanned Conoprobe points displayed on meshed phantom surface taken from a CT scan. An ICP algorithm was used to register the datasets.
The location of the needle tip with respect to the optical fiducial on its base was established using a pivot calibration. The 1.5 mm difference between the location of the tracking coil and the actual needle tip position was compensated for in our measurements. The magnetic field generator was placed approximately 20 cm from the liver phantom, as shown in Fig. 2. The origin of the magnetic coordinate frame is the center of the field generator. To hold the needle steady after alignment and during insertion, we used a Civco Ultra-Pro II 13 g ultrasound needle guide attached to a wooden arm, as shown in Fig. 2.
B. CT Scan and Segmentation
Prior to testing, the liver phantom was scanned using the CT scanner with a voxel size of 0.729 mm × 0.729 mm ×2 mm slice thickness. Segmentation was performed with a level-set segmentation technique using Analyze 9.0 software (Mayo Clinic, Rochester, MN). A point cloud was extracted from the segmented data using the marching cubes algorithm [22] contained within Kitware’s Visualization Toolkit (VTK, Kitware, Inc., www.vtk.org). The extracted surface was then smoothed by fitting radial basis functions using the FastRBF toolkit published by Farfield Technology (Christchurch, New Zealand) [24]. This surface was then manually trimmed, resulting in a point cloud representing only the upper surface of the liver in the CT coordinate frame.
C. Registration
To register the Conoprobe data to the segmented CT scan of the phantom liver, we used the ICP algorithm. ICP requires an initial guess of the transformation between the optical coordinate frame (in which the Conoprobe point cloud is represented) and the CT coordinate frame (in which the segmented liver data is represented). To establish this initial guess, we placed four stainless steel needles with colored plastic heads into the phantom prior to CT scanning, and used these to perform a quick rough rigid point registration [25], [26] with which the ICP algorithm is initialized. We note that in an eventual clinical implementation, this initial guess could be generated from knowledge of the locations of the optical and magnetic coordinate frames, through a quick trial-and-error procedure, or the ICP could be simultaneously initialized from several locations with computations run in parallel, and the result with the lowest residual error selected as the registration result.
D. Obtaining Input Target Locations in CT Space
In an eventual clinical implementation, target points would be identified by the physician by clicking on desired locations on medical images shown on a computer screen. Because the target coil needed to be repositionable so that we could test several target locations, it was not sufficient to simply determine target coil location in CT space by observing it in the CT image. This would have required many coils, which would be expensive and cause artifacts in the CT image.
Thus, we adopted an alternate method for determining the coordinates of the magnetic tracking target in CT space based on magnetic surface registration. A magnetic tracking coil was lightly traced over the liver surface and a point cloud was recorded. This was then registered to CT space using ICP, and the resulting transformation was used to project the location of the target magnetic coil into CT space to simulate a physician input target in image coordinates. We also note that we visually inspected the fitting results by plotting magnetic surface points on the CT surface to ensure that the ICP had not found an incorrect local minimum (such as an “upside down” fit). We further note that this magnetic ICP will not be required in an eventual clinical implementation, nor will the magnetic tracker be needed—they are only used for validation in these experiments and are not an intrinsic part of the system.
E. Conoprobe Scan and Needle Insertion
The Conoprobe system was used to collect a cloud of points on the liver surface in optical space. The point cloud was then registered to the CT surface data using the ICP algorithm. Using the resulting transformation, the location of the target point in CT space was converted to optical space. Using optical tracking of the needle itself, the needle was then aligned toward the target (such that the needle trajectory came as close as possible to the desired target, i.e., within 0.5 mm or less), and held in place using the needle guide, as shown in Fig. 2. The needle was then inserted through the needle guide until its tip reached the depth of the target as nearly as possible (always within 0.75 mm). The reason for the 0.5 and 0.75 mm maximum tolerances was the use of a manual positioning arm for the needle guide rather than a robotic positioning stage. While a robot can offer higher accuracy (see, e.g., [27]), manual positioning using a passive, lockable positioning arm is a simpler solution for initial clinical implementation.
F. Results of Needle-Placement Experiment
The results of five needle insertions to five different targets are summarized in Table III. Total error represents the distance reported by the magnetic tracker between the final needle tip location and the final target location after insertion. This includes all sources of error including surface registration error, tissue deformation, initial needle misalignment, needle deflection, etc. The tip-magnetic target distance is the difference between the final needle tip location reported by the magnetic tracker and the initial target in magnetic coordinates. This includes all sources of error, except for target motion due to tissue deformation. The tip-optical target error represents the distance between the optical target location as reported in optical space and the tip of the needle as reported by the optical tracker. This measurement can be considered a best case system error, as it includes the error associated with manual aiming of the needle only and does not include any surface registration effects. The tip-optical-magnetic error indicates the difference in optically and magnetically reported final needle tip location. This measurement gives an indication of needle deflection during insertion and contains the effects of both surface registrations. Finally, the target shift indicates the distance that the magnetic target moved during insertion due to tissue deformation, as reported by the magnetic tracker.
Table III.
Results of Five Needle Placement Trials
| Trial | Total Error | Tip-Mag. Target | Tip-Opt. : Target | Tip Opt. Mag. | Target Sh |
|---|---|---|---|---|---|
|
| |||||
| mm | mm | mm | mm | mm | |
| 1 | 3.2 | 2.1 | 1.2 | 2.8 | 2.0 |
| 2 | 2.5 | 2.4 | 1.8 | 2.8 | 0.4 |
| 3 | 3.1 | 2.4 | 1.3 | 2.5 | 1.0 |
| 4 | 2.2 | 2.9 | 0.7 | 2.6 | 1.1 |
| 5 | 3.7 | 1.9 | 1.2 | 2.4 | 2.0 |
| Average | 2.94 | 2.34 | 1.24 | 2.62 | 1.30 |
G. Interpretation of Results
The results of our Conoprobe registration and needle-placement experiment can be compared with those obtained by Cash et al. using LRS for liver registration [12]. In the LRS experiments, the quality of an LRS registration was evaluated by two metrics, the mean residual error of the scan points to the preoperative dataset after ICP and via target registration error (TRE). TRE is defined as the difference between the reported location of a target and the actual location of the target [6]. Cash et al. report a mean residual error of 0.75 mm and a TRE of 2.0 mm for their LRS system.
The mean residual error of our experiment was 1.17 mm, and the mean TRE was 2.34 mm based on tip-magnetic target measurements. Since the TRE error is comparable to that found by Cash et al., we believe that our Conoprobe measurement error was essentially Gaussian in nature, and thus did not significantly affect the quality of the ICP fit. Furthermore, we note that while our tip-magnetic target is the best approximation of TRE available in our experiments, it does include the effects of both Conoprobe and magnetic ICP registrations, as well as any physical targeting error of the needle associated with manual alignment or needle bending. It is interesting to note that even with these additional sources of error, our results are still comparable to the prior LRS scan results reported by Cash et al. This indicates that Conoprobe surface scans should be able to achieve our goal of enabling minimally invasive surface scans of comparable quality to existing clinically used LRS systems.
VII. Conclusion and Future Work
In this paper, we have described experiments exploring the feasibility of using a conoscopicholography-based scanner as a method for obtaining minimally invasive surface scans for soft-tissue registration. A scanning system based on conoscopic holography promises the ability to scan though a laparoscopic port without requiring wide exposure of the organ of interest. The facts that conoscopic holography is a proven technique for high-precision distance measurements, is readily available commercially in inexpensive packages (approximately $5 000 for the Conoprobe base unit), and can deliver high-quality distance measurements to biological tissues, make it a compelling technology for laparoscopic surface scanning.
Additional beneficial features of this scanning method include the fact that in contrast to LRS, it does not collect unwanted data points and that the physician can directly specify intraoperatively which surfaces to scan. One challenge of deploying LRS is that one must trim many points from the dataset, because it will collect surface data on the entire intraoperative field, rather than just the organ of interest. Because the Conoprobe is manually aimed, the surgeon can ensure that it captures only the area of interest. Furthermore, the system’s ability to selectively scan individual anatomical features (e.g., ridges or lobes of the liver, etc.) makes it an ideal candidate for use with registration methods, such as that proposed by Clements et al., which use selected subsurfaces or surface features to improve ICP registration and eliminate the need for an initial alignment guess [28].
On the basis of the feasibility studies reported in this paper, the next step in validation of the Conoprobe surface scanning concept is intraoperative experiments. These will require the attachment of an airtight tube to the front of the Conoprobe, and experiments in collecting surface scans of perfused, living tissues. Our concept for a version of the Conoprobe meeting the requirements of in vivo experiments is shown in Fig. 13. Here, we attach a small CCD camera to the tip of the laparoscopic tube, and provide the physician with a handheld display screen on which the organ of interest and the Conoprobe measurement point can be visualized. The first prototype pictured is not yet airtight, but illustrates the concept.
Fig. 13.

First prototype of a laparoscopic tube attached to the Conoprobe. A small CCD camera is attached to the tip of the tube, enabling the physician to view the position of the laser measurement spot on a handheld display screen. (Inset, lower left) Display screen and the tip of the tube seen end-on. This first prototype illustrates the basic concept, but is not yet airtight.
In the future, Conoprobe-enabled registration could be used for collocated augmented visual displays similar to the image overlay results discussed in Section I, only without requiring the physical presence of the imager. Conoprobe-enabled registration could also be used to direct a robotic system to accurately position a tool at a desired subsurface location (for example, in place of intraoperative ultrasound in a system like that of Boctor et al. [27]). These are a few examples of what we believe will be many future applications and avenues of research. By enabling minimally invasive soft-tissue registration, we believe that our Conoprobe system has the potential to extend the advantages of image guidance to many new surgical applications.
Acknowledgments
The authors would like to thank R. Galloway for problem definition and advice, M. Miga for assistance with registration algorithms, and P. Marayong, H. Lin, P. Dumpuri, and S. Mate for software assistance.
Biographies
 Ray A. Lathrop (S’09) received the B.S. degree in mechanical engineering from Vanderbilt University, Nashville, TN, in 1997, the M.S. degree in mechanical engineering from Stanford University, Stanford, CA, in 1999, and the Ph.D. degree in mechanical engineering from Vanderbilt University in 2008.
He is currently with Vanderbilt University. His research interests include medical device design and development and image-guided surgery.
Douglas M. Hackworth (M’05) received the B.S. degree in physics from Hendrix College, Conway, AR, in 1994, and the M.S. degree in physics from the University of Texas at Dallas, Richardson, in 1996.
From 2000 to 2007, he was a Software Engineer in private sector and government research and development, where he was engaged in biomedical fields involving medical imagery and radiation therapy treatment planning. Since 2007, he has been with Vanderbilt University, Nashville, TN, as a Software Engineer in biomedical research. His research and technology interests include medical image registration, biomedical modeling and simulation, and parallel computing Linux clusters.
 Robert J. Webster, III (S’97–M’08) received the B.S. degree in electrical engineering from Clemson University in 2002, and the M.S. and Ph.D. degrees in mechanical engineering from Johns Hopkins University, Baltimore, MD, in 2004 and 2007, respectively.
During 2008, he was an Assistant Professor of mechanical engineering with the Faculty of Vanderbilt University, Nashville, TN, where he is currently the Director of the Medical and Electromechanical Design Laboratory. His research interests include medical robotics, image-guided surgery, and continuum robotics.
Footnotes
We note that such a mirror aiming system can be considered a future add-on to a conoscopic holography system, such as that shown in Fig. 1. Such an add-on has the advantage of relieving the doctor from manually manipulating the Conoprobe base unit, but has the potential drawback of giving the doctor less control of exactly what tissue is scanned.
This paper was presented in part at the International Society for Optical Engineers Medical Imaging 2009 Conference, Lake Buena Vista, FL, and at the American Society of Mechanical Engineers Design of Medical Devices Conference 2009, Minneapolis, MN. This work was supported by Vanderbilt University, Nashville, TN, and by Optimet, Inc., Wilmington, MA. The work of D. Hackworth was supported by the National Institute of Biomedical Imaging and Bioengineering under the National Institutes of Health Grant R21 EB 007694-01.
Color versions of one or more of the figures in this paper are available online at http://ieeexplore.ieee.org.
Contributor Information
Ray A. Lathrop, Email: ray.a.lathrop@vanderbilt.edu, Vanderbilt University, Nashville, TN 37235 USAD.
Douglas M. Hackworth, Email: doug.hackworth@vanderbilt.edu, Vanderbilt University, Nashville, TN 37235 USA.
Robert J. Webster, III, Email: robert.webster@vanderbilt.edu, Vanderbilt University, Nashville, TN 37235 USA.
References
- 1.Lathrop RA, Cheng TT, Webster RJ., III Conoscopic holography for image registration: A feasibility study. Proc SPIE. 2009:72611M-1–72611M-11. [Google Scholar]
- 2.Lathrop RA, Cheng TT, Webster RJ., III Laparoscopic image guidance via conoscopic holography. ASME J Med Devices. 2009;3:027546. [Google Scholar]
- 3.Stetten G, Chib V, Tamburo R. System for location-merging ultrasound images with human vision. Proc IEEE Appl Imagery Pattern Recognit Workshop. 2000:200–205. [Google Scholar]
- 4.Fichtinger G, Deguet A, Masamune K, Fischer GS, Balogh E, Mathieu H, Taylor R, Fayad LM, Zinreich SJ. Needle insertion in CT scanner with image overlay-cadaver studies. Med Image Comput Comput-Assist Intervention. 2004;3217:795–783. [Google Scholar]
- 5.Fischer GS, Deguet A, Csoma C, Taylor RH, Fayad L, Carrino JA, Zinreich SJ, Fichtinger G. MRI image overlay: Application to arthrography needle insertion. Comput Aided Surg. 2007;12:2–14. doi: 10.3109/10929080601169930. [DOI] [PubMed] [Google Scholar]
- 6.Beutel J, Fitzpatrick JM, Horii SC, Kim Y, Kundel HL, Sonka M, Metter RLV. In: Handbook of Medical Imaging. Sonka M, Fitzpatrick JM, editors. Vol. 2. Bellingham, WA: SPIE; 2000. [Google Scholar]
- 7.Pluim JPW, Maintz JBA, Viergever MA. Mutual information based registration of medical images: A survey. IEEE Trans Med Imag. 2003 Aug;22(8):986–1004. doi: 10.1109/TMI.2003.815867. [DOI] [PubMed] [Google Scholar]
- 8.Peters T. In: Image-Guided Interventions: Technology and Applications. Peters T, Cleary K, editors. New York: Springer-Verlag; 2008. [Google Scholar]
- 9.Galloway RL. The process and development of image-guided procedures. Annu Rev Biomed Eng. 2001;3:83–108. doi: 10.1146/annurev.bioeng.3.1.83. [DOI] [PubMed] [Google Scholar]
- 10.Maurer CR, Maciunas RJ, Fitzpatrick JM. Registration of head CT images to physical space using a weighted combination of points and surfaces. IEEE Trans Med Imag. 1998 Oct;17(5):753–761. doi: 10.1109/42.736031. [DOI] [PubMed] [Google Scholar]
- 11.Herline AJ, Herring JL, Stefansic JD, Chapman WC, Galloway RL, Dawant BM. Medical Image Computing and Computer-Assisted Intervention. New York: Springer-Verlag; 1999. Surface registration for use in interactive image-guided liver surgery; pp. 892–899. [DOI] [PubMed] [Google Scholar]
- 12.Cash DM, Chapman WC, Terawaki H, Dawant BM, Galloway RL, Miga MI. Incorporation of a laser range scanner into image-guided liver surgery: Surface acquisition, registration, and tracking. Med Phys. 2003;30:1671–1682. doi: 10.1118/1.1578911. [DOI] [PMC free article] [PubMed] [Google Scholar]
- 13.Grimson WEL, Ettinger GJ, White SJ, Lozano-PCrez T, Wells WMI, Kikinis R. An automatic registration method for frameless stereotaxy, image guided surgery, and enhanced reality visualization. IEEE Trans Med Imag. 1996 Apr;15(2):129–139. doi: 10.1109/42.491415. [DOI] [PubMed] [Google Scholar]
- 14.Miga MI, Sinha TK, Cash DM, Galloway RL, Weil RJ. Cortical surface registration for image-guided neurosurgery using laser-range scanning. IEEE Trans Med Imag. 2003 Aug;22(8):973–985. doi: 10.1109/TMI.2003.815868. [DOI] [PMC free article] [PubMed] [Google Scholar]
- 15.Besl PJ, McKay ND. A method for registration of 3-D shapes. IEEE Trans Pattern Anal Mach Intell. 1992 Feb;14(2):239–256. [Google Scholar]
- 16.Raabe A, Krishnan R, Wolff R, Hermann E, Zimmermann M, Seifert V. Laser surface scanning for patient registration in intracranial image-guided surgery. Neurosugery. 2002;50(4):797–803. doi: 10.1097/00006123-200204000-00021. [DOI] [PubMed] [Google Scholar]
- 17.Schicho K, Figl M, Seemann R, Donat M, Pretterklieber ML, Birkfellner W, Reichwein A, Wanschitz F, Kainberger F, Bergmann H, Wagner A, Ewers R. Comparison of laser surface scanning and fiducial marker-based registration in frameless stereotaxy. J Neurosurg. 2007;106:704–709. doi: 10.3171/jns.2007.106.4.704. [DOI] [PubMed] [Google Scholar]
- 18.Prasciolu M. PhD dissertation. Univ. Trieste, Trieste; Italy: 2007. 3D laser scanner based on surface silicon micromachining techniques for shape and size reconstruction of the human ear canal. [Google Scholar]
- 19.Sirat G, Psaltis D. Conoscopic holography. Opt Lett. 1985 Jan;10(1):4–6. doi: 10.1364/ol.10.000004. [DOI] [PubMed] [Google Scholar]
- 20.Sirat GY, Paz F, Agronik G, Wilner K. Conoscopic systems and conoscopic holography. Optimet, Optimet White Paper. Available: http://mecadserv1.technion.ac.il/public_html/IK05/Sirat_9375.pdf.
- 21.Daniilidis K. Eye-hand calibration using dual quaternions. Int J Robot Res. 1999;18:286–298. [Google Scholar]
- 22.Lorensen WE, Cline HE. Marching cubes: A high resolution 3D surface construction algorithm. Comput Graph. 1987;21(4):163–169. [Google Scholar]
- 23.Carr JC, Fright WR, Beatson RK. Surface interpolation with radial basis functions for medical imaging. IEEE Trans Med Imag. 1997 Feb;16(1):96–107. doi: 10.1109/42.552059. [DOI] [PubMed] [Google Scholar]
- 24.Carr JC, Beatson RK, Cherrie JB, Mitchell TJ, Fright WR, McCallum BC, Evans TR. Reconstruction and representation of 3D objects with radial basis functions. Proc ACM SIGGRAPH (ser Comput Graph Proc) 2001:67–76. [Google Scholar]
- 25.Schonemann PH. A generalized solution of the orthogonal procrustes problem. Psychometrika. 1966;31:1–10. [Google Scholar]
- 26.Farrell JL, Stuelpnagel JC. Problem 65-1: A least squares estimate of satellite attitude. SIAM. 1966;8:384–386. [Google Scholar]
- 27.Boctor EM, Choti MA, Burdette EC, Webster RJ., III Three-dimensional ultrasound-guided robotic needle placement: An experimental evaluation. Int J Med Robot Comput Assist Surg. 2008;4:180–191. doi: 10.1002/rcs.184. [DOI] [PMC free article] [PubMed] [Google Scholar]
- 28.Clements LW, Cash DM, Chapman WC, Galloway RL, Miga MI. Robust surface registration using salient anatomical features in image-guided liver surgery. Med Phys. 2008;35:2528–2540. doi: 10.1118/1.2911920. [DOI] [PMC free article] [PubMed] [Google Scholar]


