

Abstract
There is increasing interest in topological analysis of brain networks as complex systems, with researchers often using neuroimaging to represent the large-scale organization of nervous systems without precise cellular resolution. Here we used graph theory to investigate the neuronal connectome of the nematode worm Caenorhabditis elegans, which is defined anatomically at a cellular scale as 2287 synaptic connections between 279 neurons. We identified a small number of highly connected neurons as a rich club (N = 11) interconnected with high efficiency and high connection distance. Rich club neurons comprise almost exclusively the interneurons of the locomotor circuits, with known functional importance for coordinated movement. The rich club neurons are connector hubs, with high betweenness centrality, and many intermodular connections to nodes in different modules. On identifying the shortest topological paths (motifs) between pairs of peripheral neurons, the motifs that are found most frequently traverse the rich club. The rich club neurons are born early in development, before visible movement of the animal and before the main phase of developmental elongation of its body. We conclude that the high wiring cost of the globally integrative rich club of neurons in the C. elegans connectome is justified by the adaptive value of coordinated movement of the animal. The economical trade-off between physical cost and behavioral value of rich club organization in a cellular connectome confirms theoretical expectations and recapitulates comparable results from human neuroimaging on much larger scale networks, suggesting that this may be a general and scale-invariant principle of brain network organization.
Introduction
The nematode worm, Caenorhabditis elegans, currently provides the only example of a nervous system that has been mapped quite completely and exactly at a cellular level. Detailed knowledge has accumulated about many aspects of this system (White et al., 1986; Hall and Altun, 2008), including the anatomical location, developmental history, and functional role (inferred from behavioral consequences of laser ablation) of each neuron (Sulston, 1976; Chalfie, 1985; Wicks et al., 1996).
There is growing interest in the network properties or connectome of the C. elegans nervous system. It has been shown that the total wiring cost of the network, typically approximated by the physical connection distance between neurons, is nearly minimized by the anatomical layout of neurons and synapses (Chen et al., 2006). The topological layout of the connectome has also been quantified by representing the nervous system as a graph in which each node denotes a neuron and each (directed or undirected) edge denotes a synaptic connection between neurons. This simple graphical model of the C. elegans connectome has small-world network properties: a combination of high local clustering of connections between topologically neighboring neurons and short topological path lengths between any pair of neurons (Watts and Strogatz, 1998). Short path length is equivalent to high topological efficiency of information transfer and the high efficiency of the C. elegans connectome (47% of maximum efficiency) is achieved for relatively low connection density (4% of maximum synaptic connectivity between neurons; Latora and Marchiori, 2001). The wiring cost of the C. elegans connectome is strongly but not strictly minimized (Bassett et al., 2010). Most connections are short distance and the wiring cost of the system can be further reduced by computational rewiring algorithms, albeit at the expense of an increase in path length between neurons (Kaiser and Hilgetag, 2006; Kaiser and Varier, 2011).
In the present study, we have further explored the C. elegans nervous system with a special focus on its “rich club.” Rich clubs are elite cliques of high-degree network hubs that are connected to each other topologically with high efficiency (i.e., there is a short path length between any pair of rich club nodes). Many complex systems can be partitioned into a small rich club and a large poor periphery (Colizza et al., 2006), and the rich club is usually valuable to the overall function of the network. For example, it was shown recently that brain anatomical networks derived from human neuroimaging data included a rich club of association cortical hubs that were considered likely to be valuable for adaptive (cognitive) function. The human brain rich club nodes were connected to each other efficiently by white matter tracts traversing greater anatomical distances, on average, than the tracts connecting more peripheral nodes (van den Heuvel and Sporns, 2011). Therefore, the human brain rich club putatively confers high value for high physical connection cost.
We aimed to test the hypothesis that rich club organization of the cellular connectome of C. elegans conforms to similar economical constraints—a trade-off between adaptive value and physical cost—as the rich club of human brain anatomical networks. The motivating idea was that general principles of brain network organization may emerge invariantly across scales of anatomical space and across different animal species.
Materials and Methods
C. elegans nervous system.
The dataset used to describe the hermaphrodite C. elegans neuronal network (Varshney et al., 2011) details N = 279 neurons (the 282 nonpharyngeal neurons excluding VC6 and CANL/R, which are missing connectivity data) and M = 2287 synaptic connections, with the relative physical locations of the neurons described by 2D coordinates. An undirected binary form of the network was used to characterize rich club topology. For motif analysis, we used a directed binary graph, as detailed below. In addition, neuronal birth times (Varier and Kaiser, 2011) were compared with key points in the life cycle of C. elegans allowed to develop normally at 22°C (Hall and Altun, 2008).
Rich club coefficient.
To quantify the rich club effect, the degree of each node in the network (i.e., the number of other nodes it is connected to) must first be calculated and all nodes with degree ≤ k removed. The rich club coefficient for the remaining subgraph, Φ(k), is then the ratio of the number of existing connections to the number that would be expected if the subgraph was fully connected and formally is given by the following equation (Zhou and Mondragon, 2004; Colizza et al., 2006):
 |
where N>k is the number of nodes with degree > k and M>k is the number of edges between them. The computation of Φ(k) for all values of k in the network of interest yields a rich club curve (Fig. 1a).
Figure 1.
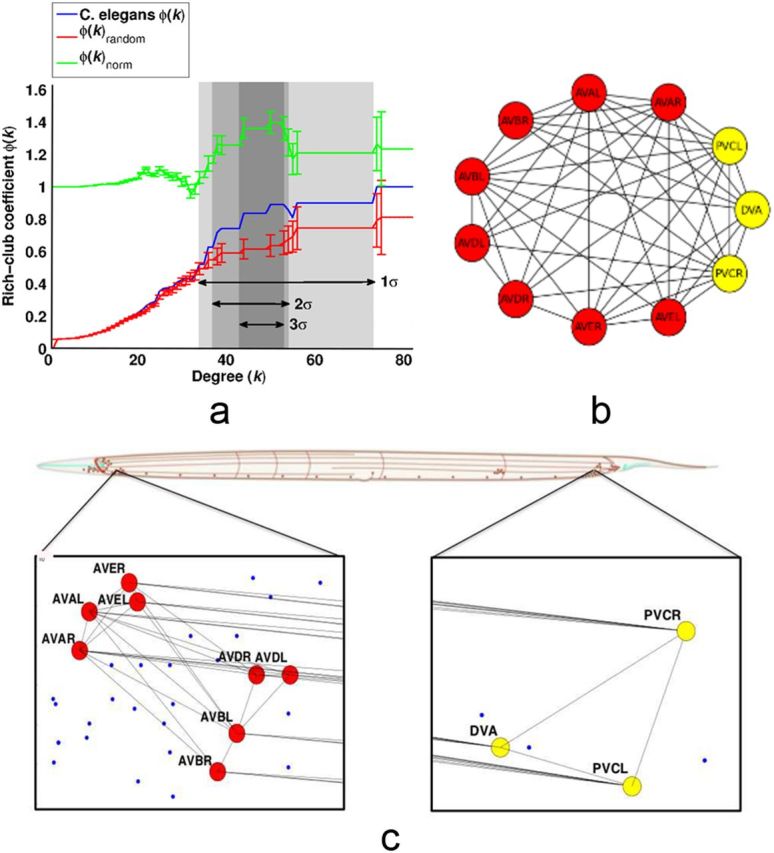
Rich club of the C. elegans nervous system. a, The blue curve illustrates the rich club coefficient Φ(k) for the C. elegans neuronal network and the red curve is a randomized rich club curve, Φrandom(k), generated by averaging the rich club coefficients of 1000 random graphs at each value of k. The green curve is the normalized coefficient. Error bars on the Φrandom(k) and Φnorm(k) curves are 1σ of the random graphs. Φ(k) ≥ Φrandom(k) + 1σ over the range 35 ≤ k ≤ 73, indicating that this is the rich club regime (highlighted in lightest gray). The more conservatively defined rich clubs of Φ(k) ≥ Φrandom(k) + 2σ and Φ(k) ≥ Φrandom(k) + 3σ are shaded darker grey (Table 1). b, A purely topological view of the rich club network. Nodes in yellow are located in the tail and those in red are located in the head. c, The rich club is shown in the context of the whole body of the animal. It only has components in the head and tail, which are enlarged to show the subset DVA and PVCL/R (tail, right) and the subset AVAL/R, AVBL/R, AVDL/R, and AVEL/R (head, left). Only synaptic connections between rich club neurons are shown.
However, the higher-degree nodes in a network have a higher probability of sharing connections with each other simply by chance, so even random networks generate increasing rich club coefficients as a function of increasing degree threshold, k. To control for this effect, the rich club curve for C. elegans was normalized relative to the rich club curves of 1000 comparable random networks. The random networks were generated by performing multiple (100 × M) double edge swaps or permutations on the original graph representing the C. elegans neuronal network. A double edge swap removes two randomly selected edges a-b and c-d and replaces them with the edges a-c and b-d (assuming they do not already exist, in which case a new edge pair must be selected). This permutation procedure ensures that the number of nodes and edges, and the degree distribution, of the nematode network are all conserved in the random networks. The normalized rich club coefficient is then given by the following equation:
 |
where Φrandom(k) is the average value of Φ(k) across the random networks.
The existence of rich club organization is defined by Φnorm(k) > 1 over some range of values of threshold degree k. We used a probabilistic approach to define the threshold criteria for a rich club more precisely. At every different threshold degree, we estimated Φrandom(k) for 1000 realizations of the random networks and estimated the SD of Φrandom(k), denoted σ. The threshold range of the rich club regime was then specified by those values of k for which Φ(k) ≥ Φrandom(k) + 1σ. Therefore, a rich club could be said to exist in the subgroup of network nodes defined by an arbitrary degree threshold if Φnorm(k) = 1 + 1σ; but we also defined rich clubs by the more stringent criterion that Φnorm(k) ≥ 1 + 2σ and by the even more conservative criterion that Φnorm(k) ≥ 1 + 3σ.
Connection distance and path length.
To describe the nematode network fully, both physical and topological metrics are required. The only physical metric we used was the connection distance, which is the Euclidean distance between somata of synaptically connected neurons in the adult animal. Connection distance, a physical metric (in units of millimeters), provides a reasonable approximation to the axonal connection distance, or wiring cost, which is an anatomical property of the system. We also used a number of topological metrics to quantify the connectome (see the following subsections Efficiencies, Betweenness Centrality, Modularity and Related Topological Roles, and Motifs). It is important to note that we will use path length strictly to refer to a topological distance in the network and connection distance to describe a physical distance in the organism. Shorter path lengths between neurons indicate fewer synaptic connections mediating between them; if the minimum path length between two neurons is 1, they are directly, synaptically connected or nearest neighbors; if the path length is 2, they are indirectly connected by a chain of two synaptic connections, and so on.
Efficiencies.
A measure of the global efficiency of a network, EGlobal, is given by the mean of the sum of the inverse shortest path lengths, Lij, between all existing node pairs i and j (Achard and Bullmore, 2007):
 |
where N is the number of nodes in the graph G. Networks for which the average path length from one node to another is small can thus be said to have high global efficiency (Achard and Bullmore, 2007).
The same measure of efficiency can be estimated for a single node in the network. The nodal efficiency of an individual neuron i is defined as the inverse of the harmonic mean of the minimum path length between it and all other nodes in the network (Achard and Bullmore, 2007):
 |
If we average the nodal efficiencies for all nodes in the network, this is equivalent to estimating the global efficiency of the network. We can likewise average the nodal efficiencies of all neurons in the rich club to estimate the efficiency of the rich club ERich and average the nodal efficiencies of all neurons not in the rich club to estimate the efficiency of the poor periphery EPoor.
We also estimated the clustering of each node using the so-called local efficiency of the subgraph g(i) of n nearest neighbors of the index node (Latora and Marchiori, 2001):
 |
Betweenness centrality.
Betweenness centrality characterizes the importance of a node or edge in the network by measuring the fraction of shortest paths between any two nodes in the network that pass through this particular node or edge (Freeman, 1977; Newman and Girvan, 2004). Formally, the betweenness centrality Bi of a node i is given by the following:
 |
where
 |
and ljk is the number of shortest paths between j and k. Bi is then normalized by:
 |
Modularity and related topological roles.
Because there is no agreed-upon method by which to optimize a modular decomposition, we used both the Newman and Louvain algorithms (Rubinov and Sporns, 2010) to identify modules and explore the mesoscopic community structure of the system. Further, we considered the results of a prior study examining modular structure in the C. elegans network (Pan et al., 2010) in which six modules were identified by a greedy partitioning of the network. One should bear in mind that these results need to be treated with caution, for not only is there no absolute partitioning, but also the geometry of a network is known to have significant effects on its topological properties including modularity (Henderson and Robinson, 2011).
Having defined the modules of a network, each of the network nodes can then be classified according to their roles in intramodular and intermodular connectivity (Sales-Pardo et al., 2007).
Letting ksi be the number of connections between a node i and other nodes within its module si, the mean and SD of ksi over all the nodes in si can be written as ksi and σksi respectively. The Z-score is then given by the following:
 |
This normalized intramodular degree of a node i is a measure of its connectivity to other nodes in the same module.
The participation coefficient is a measure of the intermodular connectivity of a node:
 |
where ksi again denotes the intramodular degree of node i and ki is its total degree (Guimerá and Amaral, 2005). The participation coefficient of a node is therefore close to 1 if its links are uniformly distributed among all the modules and 0 if all of its links are within its own module.
Adopting criteria from a prior study (Guimerá and Amaral, 2005), we can define the “hubs” of the network as those nodes that have high normalized intramodular degree, zi ≥ 0.7. A hub may be further categorized as “provincial” (most links within its own module; p ≤ 0.3), “connector” (a significant proportion of links to nodes in different modules; 0.3 < p ≤ 0.75), or “global” (with links homogeneously distributed across all modules; p > 0.75).
Motifs.
Within the rich club organization of the nematode brain, there are three different topological categories of connection between any two neurons: the club links (C), which connect two rich club nodes; the local links (L), which connect two poor periphery nodes; and the feeder links (F), which connect a rich club node (R) to a poor periphery node (P). This categorization of edges in relation to the rich club of the network is equivalent to that described by van den Heuvel et al. (2012, except we have assigned the label of club (C), rather than rich (R), to the direct edges between two rich club nodes; the designation “rich” is reserved for nodes.
On this basis, we analyzed the frequency of motifs or chains of club, feeder, or local connections between nodes in the network. Motifs are defined as shortest paths comprising a series of edges between a pair of nodes. This definition, in contrast to some other widely used definitions of network motifs (Milo et al., 2002), necessarily excludes closed loops or triangles. Some motifs can occur with greater-than-random frequency in complex networks. By considering the shortest paths between each pair of neurons within the nematode brain, we identified all motifs that linked any two nodes (Fig. 2c). For example, the motif L-L-F-C-C-C describes a path made up of two local edges, followed by one feeder edge, followed by three club edges. To focus the analysis of motifs on their topological roles in relation to the rich club, we condensed any consecutive occurrences of the same type of edge, following the example of van den Heuvel et al. (2012). So, for example, both L-L-F-C-C and L-F-C-C-C motifs were categorized as belonging to the class of L-F-C motifs (van den Heuvel et al., 2012; Fig. 2c).
Figure 2.
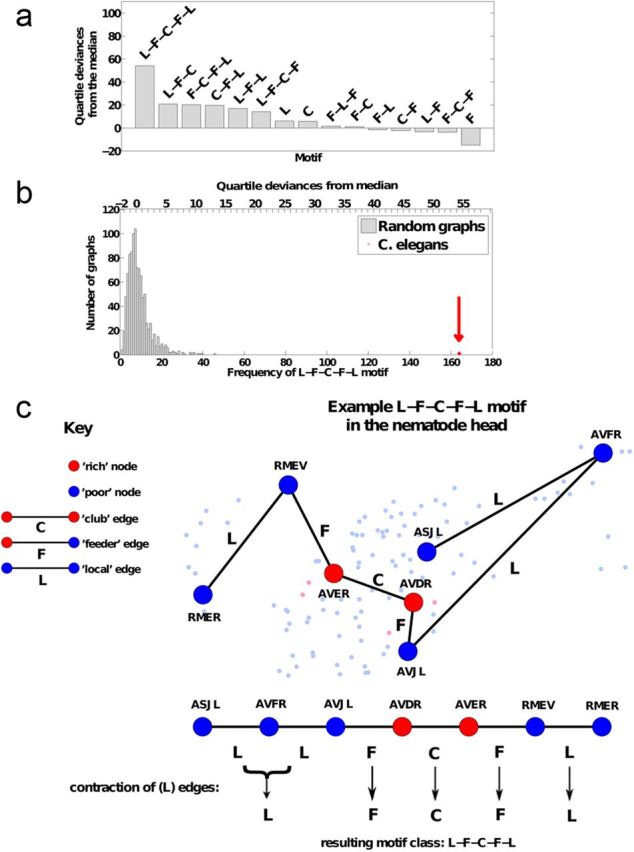
Motifs of the C. elegans network. a, The frequency of motif occurrence in the nematode network, compared with frequency of the same motif occurring in random networks, was defined in terms of interquartile deviances from the median and motifs were ranked in order of decreasing values. The motif that occurred with greatest (nonrandom) significance in the nematode network linked a pair of peripheral nodes via a series of local (L), feeder (F), and club (C) edges (denoted L-F-C-F-L). This indicates that many more of the shortest paths between peripheral neurons in the C. elegans network are mediated by the rich club than would be expected in a random network. b, The histogram shows the frequency distribution of the L-F-C-F-L motif in 1000 random networks. The frequency of the L-F-C-F-L motif in the nematode network is also shown; it is greater than the maximum frequency in the random network distribution, so it has p < 1/1000 = 0.001 under the null hypothesis that the frequency distribution of this motif is random in the nematode network. The top x-axis marks quartile deviances from the median, a nonparametric measure of distance from the central location of the random distribution. c, Construction of motifs from the shortest paths between pairs of neurons. As described in the key, rich club neurons are colored red and peripheral neurons are colored blue. An example of the frequently occurring motif L-F-C-F-L is given as a series of local (L), feeder (F) and club (C) connections to show how the topologically central rich club mediates many of the connections between topologically more peripheral neurons in the nematode nervous system. It is also illustrated anatomically within the head of the C. elegans network, where large bold nodes belong to the L-F-C-F-L motif and small pale nodes are in the rest of the network.
Software.
Metric calculations and network manipulations were carried out using the Python NetworkX library (Hagberg et al., 2008) and MATLAB.
Results
The nematode's rich club has high efficiency and high cost
We used publically available data (Varshney et al., 2011) on the identity, location, and connectivity of each neuron in the C. elegans nervous system for all graph theoretical analyses. We defined binary graphs representing each neuron (N = 279) as a node and each synaptic connection (M = 2287) as an edge. As described previously, this model of the nematode connectome is an economically wired, small-world, modular network (Watts and Strogatz, 1998; Chen et al., 2006; Pan et al., 2010). Its global efficiency (EGlobal = 0.45) is intermediate between the lower efficiency of a regular lattice (EGlobal = 0.20) and the higher efficiency of a random graph (EGlobal = 0.47). It has higher clustering (0.34) than a random graph (0.14) but less than a regular lattice (0.70) of the same size. Most nodes have a small number of connections but a few hub nodes have high total degree ki (Fig. 3a) and the degree distribution is somewhat fat tailed. The nematode network is sparsely connected and the distribution of physical distances between connected neurons is skewed toward shorter connection distances, with relatively few outlying long-distance connections.
Figure 3.

The C. elegans rich club has higher nodal efficiency, betweenness, centrality, participation coefficient, and connection distance than the rest of the nervous system (the poor periphery). a–e, Box plots detailing the distributions of degree, betweenness centrality, average connection distance, nodal efficiency, and participation coefficient (a measure of intermodularity). For each metric, the rich club is compared with the poor periphery and with the network as a whole. f, Distribution of connection distances. Rich club connections have a bimodal distribution, including a relatively large proportion of the longest connection distances in the network and a majority of much shorter distance connections, feeder connections linking a peripheral node to a rich club node have intermediate probability of long connection distance, and local edges linking two peripheral nodes have the lowest probability of a long connection distance.
We identified the rich club as a subset of high-degree neurons that have a significantly greater density of connections between them than would be expected in a subset of equally high-degree nodes in a random graph, defined mathematically by Φnorm(k) ≥ 1 + 1σ. This criterion is satisfied for the C. elegans connectome when the threshold value for degree k, used to define the subset of hub neurons between which connectivity would be calculated, is in the range 35 < k < 73. We also defined rich clubs satisfying the more stringent criteria Φnorm(k) ≥ 1 + 2σ and Φnorm(k) ≥ 1 + 3σ. The rich club identified at the most lenient statistical threshold (1σ) includes 14 neurons; the rich club identified at the most conservative threshold (3σ) comprises a subset of 11 of these neurons (Table 1). Below, we will focus on more detailed analysis of the rich club defined by degree threshold k = 44. This is the lowest degree threshold in the range 44 ≤ k < 53 that satisfies the most conservative statistical 3σ criterion for significance of the normalized rich club coefficient.
Table 1.
Neurons comprising rich clubs of the C. elegans connectome
| Neuron | Degree | Rich club | Function | Birth time |
|---|---|---|---|---|
| AVAR | 94 | 3σ | Head interneuron; role in locomotor decisions | 311 |
| AVAL | 93 | 3σ | Head interneuron; role in locomotor decisions | 312 |
| AVBL | 76 | 3σ | Head interneuron; role in locomotor decisions | 318 |
| AVBR | 75 | 3σ | Head interneuron; role in locomotor decisions | 314 |
| AVER | 57 | 3σ | Head interneuron; role in locomotor decisions | 329 |
| AVDR | 56 | 3σ | Head interneuron; role in locomotor decisions | 301 |
| AVEL | 56 | 3σ | Head interneuron; role in locomotor decisions | 325 |
| PVCL | 55 | 3σ | Tail interneuron; role in locomotor decisions | 449 |
| PVCR | 53 | 3σ | Tail interneuron; role in locomotor decisions | 450 |
| DVA | 51 | 3σ | Tail sensory interneuron; regulates sensory-motor integration during locomotion; modulates locomotion | 296 |
| AVDL | 45 | 3σ | Head interneuron; role in locomotor decisions | 299 |
| AIBR | 39 | 2σ | Head interneuron | 299 |
| RIBL | 38 | 1σ | Head interneuron | 299 |
| RIAR | 37 | 1σ | Head interneuron | 299 |
The rich club in the nematode network can be defined by comparison with random networks: the most conservatively defined rich club, denoted 3σ, has a normalized rich club coefficient Φnorm(k) > 1 + 3σ, where σ is the standard deviation of Φrandom(k); less conservatively defined rich clubs, denoted 2σ and 1σ, include a few more neurons with somewhat lower degree than the 3σ rich club neurons. Birth times are given as minutes after fertilization.
There are 11 neurons in this rich club: eight are located anteriorly in the lateral ganglia of the head (AVAR/L, AVBR/L, AVDR/L, AVER/L) and three are located posteriorly in the lumbar (PVCR/L) and dorsorectal (DVA) ganglia (Fig. 1, Table 1). The 2σ rich club (defined by Φnorm(k) > 1 + 2σ), and the 1σ rich club (defined by Φnorm(k) > 1 + 1σ), are both very similar to the 3σ club. The 2σ club includes one additional neuron (AIBR) and the 1σ club includes 3 additional neurons (AIBR, RIBL, and RIAR). There is a very high efficiency of connectivity between rich club neurons: ERich = 0.92. By way of comparison, the efficiency of connections between the 268 poor periphery neurons that are not in the rich club is much lower: EPoor = 0.38 (Fig. 3d, nodal efficiencies). The rich club is also distinguished by high betweenness centrality, indicating that rich club neurons are often on the shortest paths between all pairs of neurons in the system; nine of the 11 rich club neurons (AVAR/L, AVBR/L, AVER/L, DVA, PVCR/L) are ranked in the top 10 of all neurons in terms of their betweenness centrality (with values ranging from 0.0277 to 0.103; Fig. 3b). Rich club neurons also have high participation coefficients (with values ranging from 0.46 to 0.76), indicating that they often mediate intermodular connections between neurons in different modules of the system (Fig. 3e, Fig. 4, bottom).
Figure 4.

Topological and spatial properties of the C. elegans nervous system are related: rich club neurons (red triangles) are distinguished from poor periphery neurons (blue circles) on all topological metrics. Rich club neurons tend to have higher degree (by definition), higher efficiency, higher betweenness, and higher participation coefficients than peripheral neurons. The connection distance of each neuron is the average of the physical distances between it and all of the other neurons to which it is synaptically connected in the network. Most rich club neurons have greater connection distance than most peripheral neurons, but some of the neurons with greatest connection distance are in the periphery.
The rich club neurons are located close to the anterior and posterior extremes of the nervous system, polarizing the distribution of long- and short-range connections between rich club members (Fig. 3f). The average connection distance of a club (C) edge between rich club neurons is 0.51 mm, whereas the average connection distance of a feeder (F) edge between a rich club neuron and a peripheral neuron is 0.40 mm and the average connection distance of a peripheral (P) between peripheral neurons is 0.18 mm (Fig. 3c). The total distance of all connections to rich club neurons accounts for 48% of the total connection distance or wiring cost of the network; however, rich club neurons only account for 4% of the total number of neurons in the nervous system.
The nematode's rich club is central to integrative communication
Rich club neurons also play distinct and important topological roles in a modular decomposition of the C. elegans connectome. In a modular system, the sparse connections between modules are typically mediated by a small number of nodes, so-called connector hubs (Pan et al., 2010) that are defined by high intramodular degree and high participation coefficient (a measure of the proportion of intermodular edges connecting to each node). There is no single agreed-upon method with which to detect such modular structure optimally, so we used three alternatives: we implemented the Newman-Girvan and Louvain algorithms (Rubinov and Sporns, 2010) directly and we used prior results from a spectral decomposition (Pan et al., 2010). In all cases, all of the rich club neurons could be classified as connector hubs, indicating that the rich club plays an important role in communication between modules. Focusing on the results of the Louvain decomposition, we found that 52% of the connections to or from rich club neurons are intermodular and 48% are intramodular, whereas only 30% of connections to or from poor periphery neurons are intermodular and the great majority (70%) are intramodular (Fig. 3, Fig. 4). Similarly, for the Newman-Girvan method of modular decomposition, connections to rich club nodes are 44.6% intermodular and 55.4% intramodular, whereas connections to poor periphery nodes are 25.1% intermodular and 74.9% intramodular.
All motifs were computed and classified in the following way for the directed graph of the C. elegans connectome. The frequency of each motif class was compared with its frequency in comparable random networks. To do this, we generated 1000 random graphs by the same edge-swapping permutation procedure already described for normalization of the rich club coefficient. In each random graph, we defined the rich club as the 11 nodes with the highest degree, so that rich club statistics in the random graph were based on the same number of nodes as there were rich club neurons in the C. elegans network. We assigned L, F, or C labels to all edges of the network on this basis and then counted the number of motifs of each class. The frequency of any motif class in the nematode network could be compared with the permutation distribution of its frequency in the random networks; if the observed motif frequency was greater (or smaller) than the maximum (or minimum) motif frequency in the random distribution, then it was assigned a probability p < 0.001 under the null hypothesis that the motif distribution in the nematode nervous system is random. To measure the location and dispersion of the permutation distributions of the motif frequency (Fig. 2b), we used nonparametric measures that do not assume normality. The median motif frequency was the measure of central location and the quartile deviance (simply half of the interquartile range of the motif frequency in random networks) was the measure of dispersion. Values were then assigned to the observed motif frequencies in terms of the difference between observed and random median frequency divided by the quartile deviance in the random distribution.
In the analysis of topological motifs, we focused on chains of one of three classes of connections between neurons: club connections (C) between two rich club neurons, feeder connections (F) between a rich club neuron and a peripheral neuron, and local connections (L) between two peripheral neurons. We found that motifs that passed from peripheral nodes via feeder connections through the rich club and then returned via feeder connections to the periphery were much more frequent in the C. elegans connectome. The motif L-F-C-F-L exhibited the most significant enrichment in the network compared with random graphs (p < 0.001; quartile deviances from median = 54.1; Fig. 2a). It was also notable that the next most significantly occurring motifs in the nematode network, with quartile deviances from the median ranging from 20.9 to 14.2, were C-F-L, F-C-F-L, L-F-C, L-F-L, and L-F-C-F. Four of these motifs are subsets of the single most significant motif, L-F-C-F-L, and the fifth motif (L-F-L) describes a path that passes from one peripheral neuron to another via a single neuron in the rich club.
Development of the nematode brain rich club
The first two rich club neurons (DVA and AVDL) are born about 300 min after fertilization (Fig. 5, Table 1). The remaining seven anterior rich club neurons are born within approximately 30 min of AVDL, coinciding approximately with the birth of a series of juvenile motor neurons. The remaining two posterior rich club neurons are born approximately 450 min after fertilization. Twitching movements are first observed approximately 20 min later and coordinated movements are visible from approximately 760 min after fertilization, shortly before hatching at 800 min (Hall and Altun, 2008). Motor neurons controlling ventral muscle groups are born later, up to ∼1890 min after fertilization (Sulston, 1976, 1983). The adult is fully developed at ∼3450 min after fertilization.
Figure 5.

Neuronal birth times and key events in the development of C. elegans. Top (red bars), Number of rich club neurons born in each 5 min interval after fertilization. Bottom (dark blue bars), Birth times of the rest of the neurons in the C. elegans nervous system. The dashed vertical lines indicate when the animal begins to twitch, when it is first capable of coordinated movement, and when it hatches.
Therefore, the rich club neurons are born early and all neuronal components of the rich club have formed before the first visible signs of motor activity (twitching). To assess the probability of this observation under the null hypothesis that the birth times of the rich club neurons are drawn randomly from the distribution of all neuronal birth times, we repeatedly and randomly sampled 11 neurons from the network and counted the number of times that all 11 randomly sampled neurons were born before the onset of twitching. We found that the probability of this occurrence by chance was only 0.02, suggesting that the observed concentration of early birth times in the rich club is not likely under the null hypothesis. Moreover, the additional neurons included in the less stringently defined rich clubs (1σ and 2σ) also had early birth times (299 min after fertilization; Table 1). It is also notable that most rich club neurons are born before the embryo becomes elongated, in the period 400–640 min after fertilization when the animal's body becomes approximately three times thinner and approximately four times longer. It seems that rich club connectivity could be established between neurons when they are initially close to each other and that some of these connections could then be extended by elongation of the animal's body.
Discussion
Rich club: high value for high cost
Although this topological analysis of the cellular connectome of C. elegans was uninformed by any prior data, other than the synaptic connectivity of each of the 279 neurons in the system, there was a remarkable degree of functional relatedness among the rich club neurons we identified. As detailed in Table 1, 10 of the neurons in the most conservatively defined (3σ) or “richest” club were the so-called command interneurons of the locomotor circuit with a functional role in forward or backward locomotion (Hall and Altun, 2008). The remaining neuron in this club, DVA, has been classified as a proprioceptive interneuron that modulates the locomotor circuit (Li et al., 2006). When the rich club was defined more liberally, up to three additional neurons were added (AIBR, RIBL, and RIAR), all of which are interneurons in the head of the animal (Table 1).
The behavioral roles of each of the rich club neurons make it likely that the club as a whole is important functionally for coordinated and adaptive movement of the organism. Ten of the 11 neurons of the richest club of the nematode are neurons that have already been classified functionally as command interneurons. Six of these (AVAL/R, AVEL/R, and AVDL/R) are active during and required for backward movement (Chalfie, 1985; Chronis et al., 2007; Ben Arous et al., 2010; Piggott et al., 2011), whereas four of them (AVBL/R and PVCL/R) are active during and required for forward movement. Although there is evidence for some functional heterogeneity within these groups (Kawano et al., 2011), in general, the command neurons are thought to play a specialized role in potentiating or triggering the motor programs for forward or reverse locomotion (Tsalik and Hobert, 2003; Gray et al., 2005). The integrative topology of the rich club suggests that these neurons may not be limited to this instructive role, but might also facilitate communication or exchange of information with other parts of the nervous system. The highly efficient connectivity between rich club neurons will mediate information transfer with short synaptic delays and low noise. The functional importance of this integrative capacity is highlighted by the fact that the organism does not visibly move until all of the rich club neurons have been born. Given that coordinated movement is a fundamental component of many adaptive behaviors of the organism (e.g., feeding, egg laying, and escaping) the rich club is likely to have high value.
The cost of the rich club is quantified by the Euclidean distance between synaptically connected neurons. This is a simple metric that depends on the justifiable assumptions that most axonal projections are approximately linear and that the metabolic costs of a neuronal connection increase with distance (Bullmore and Sporns, 2012). By this measure, the rich club is disproportionately costly: connectivity between and to this elite group of 11 neurons (4% of total neurons) accounts for 48% of the total connection distance or wiring cost of the network. Moreover, in previous studies measuring the mismatch between neuronal placement in the C. elegans nervous system versus neuronal placement dictated by computational rewiring algorithms designed to minimize connection distance, five of the 11 rich club neurons (DVA, AVA, and PVC classes) have been identified as outliers (Chen et al., 2006).
Rich club modules and motifs
Rich club neurons transact a disproportionate number of intermodular connections between neurons in different topological modules of the C. elegans network. Nodes comprising the same topological module are often anatomically colocalized so that the more numerous intramodular connections are short distance compared with the sparser and longer distance intermodular connections (Meunier et al., 2010; Alexander-Bloch et al., 2013). Therefore, the importance of the rich club for intermodular communication is consistent with its high wiring cost. Most rich club neurons also have exceptionally high centrality, meaning that they are on the shortest paths between many pairs of neurons in the system. The topological shortcuts between arbitrary pairs of neurons in different modules will have to traverse the same, relatively few intermodular connections at some point along the minimum path, conferring high centrality on the connector hubs of the rich club.
The importance of the rich club for integrative processing is further emphasized by the motif analysis. Many types of real-world networks, including the C. elegans neuronal network, have been classified according to their motif frequency profiles (Milo et al., 2002, 2004; Sporns and Kötter, 2004). In the present study, we were particularly interested in the relationship between frequently occurring motifs and the rich club. It has been shown previously that motifs linking pairs of peripheral nodes in large-scale human brain structural networks are more likely to be mediated by feeder and club connections than would be expected in a random network (van den Heuvel et al., 2012). We replicated these results at the cellular scale of the C. elegans connectome. Therefore, in both macro-scale and micro-scale brain networks, the motif occurring with the greatest significance linked peripheral nodes via local, feeder, and club connections (L-F-C-F-L), confirming that a large number of shortest paths between any pair of neurons in the periphery are mediated by the rich club.
Economy and scale invariance of rich clubs
There is evidence to suggest that brain networks are organized to negotiate an economical trade-off between topological value and physical connection cost (Bullmore and Sporns, 2012). The rich club in C. elegans is an example of this general principle in operation. Its neurons have high efficiency, high centrality, and high importance for communication between different modules. These related topological properties are very likely to be valuable for adaptive and coordinated movement of the organism. However, this high value architecture depends on a disproportionate number of long-distance connections, amounting to a greater than average wiring cost of the rich club.
It is striking that an analogous trade-off between topology and wiring cost was recently described for the rich club organization of the human brain (van den Heuvel et al., 2012). Using diffusion tensor imaging data from 40 healthy volunteers, a rich club was identified in the large-scale or macroscopic organization of the human brain, comprising a high density of tractographic connections between cortical regions. The cortical components of the human brain rich club, including areas of precuneus, anterior and posterior cingulate cortex, superior frontal cortex, and insula, were distributed spatially and connections between them accounted for a majority of the longest distance connections (58% of connections >9 cm) in the human brain. This high cost circuit demonstrated high centrality, mediating 69% of the shortest paths between all pairs of the 1170 cortical nodes in the network. A motif analysis of the diffusion tensor imaging network identified a greater-than-random frequency of motifs connecting pairs of peripheral regions via feeder and rich club regions.
Together with these prior data on human brain networks (van den Heuvel and Sporns, 2011; van den Heuvel et al., 2012), the nematode data provide new evidence in support of scale invariance of brain networks. Similar rich club organization is evidently conserved over multiple scales of space. Scale invariance has already been demonstrated for network topological properties such as small-worldness (Watts and Strogatz, 1998; Achard et al., 2006) and (hierarchical) modularity (Meunier et al., 2009). The comparable rich club results in such differently sized nervous systems (<1 mm vs ∼10 cm) indicates that economical trade-offs between topological value and physical cost may also be a scale-invariant aspect of nervous systems. This is consistent with the universality hypothesis that competitive criteria of cost minimization and topological complexity drive selection of diverse information processing and communication networks embedded in physical space (Bassett et al., 2010).
Experimental nematode connectomics
This study is descriptive and there has been no experimental perturbation of the system. The data we have used on neurons and synapses of C. elegans are highly detailed and complete compared with the current state of data available for cellular connectomics in any other species and they are publically available in a format that has supported several prior studies of the same data (Hall and Altun, 2008). They are the results of painstaking reconstruction of serial electron micrographs, by skilled scientists literally tracing the identity of neurons from one electron micrograph slice to the next, and visually discriminating synaptic connectivity from mere proximity of two neurons (White et al., 1986). However, partly because of the time- and labor-intensive way these “gold standard” data have been generated, the nervous systems of only three animals have been at least partially mapped. It might be useful for more experimentally focused studies in the future if the connectome of C. elegans could somehow be reconstructed much more quickly and automatically (Jarrell et al., 2012), perhaps by adopting some of the techniques currently in development for computational reconstruction of the much larger cellular connectomes of the fly or the mouse. Such a high-throughput technology for nematode connectomics could allow, for example, experimental measurement of the effects of controlled perturbations on the development and function of the rich club and other features of the C. elegans nervous system.
Footnotes
The Behavioural and Clinical Neuroscience Institute is supported by the Medical Research Council (United Kingdom) and the Wellcome Trust. E.K.T. is supported by an Engineering and Physical Sciences Research Council (United Kingdom) doctoral studentship. S.E.A. is supported by the Royal Society (United Kingdom).
E.T.B. is employed half-time by the University of Cambridge and half-time by GlaxoSmithKline and holds stock in GlaxoSmithKline. The remaining authors declare no competing financial interests.
References
- Achard S, Bullmore E. Efficiency and cost of economical brain functional networks. PLoS Computational Biology. 2007;3:e17. doi: 10.1371/journal.pcbi.0030017. [DOI] [PMC free article] [PubMed] [Google Scholar]
- Achard S, Salvador R, Whitcher B, Suckling J, Bullmore E. A resilient, low- frequency, small-world human brain functional network with highly connected association cortical hubs. J Neurosci. 2006;26:63–72. doi: 10.1523/JNEUROSCI.3874-05.2006. [DOI] [PMC free article] [PubMed] [Google Scholar]
- Alexander-Bloch AF, Vértes PE, Stidd R, Lalonde F, Clasen L, Rapoport J, Giedd J, Bullmore ET, Gogtay N. The anatomical distance of functional connections predicts brain network topology in health and schizophrenia. Cereb Cortex. 2013;23:127–138. doi: 10.1093/cercor/bhr388. [DOI] [PMC free article] [PubMed] [Google Scholar]
- Bassett DS, Greenfield DL, Meyer-Lindenberg A, Weinberger DR, Moore SW, Bullmore ET. Efficient physical embedding of topologically complex information processing networks in brains and computer circuits. PLoS Comp Biol. 2010;6:e1000748. doi: 10.1371/journal.pcbi.1000748. [DOI] [PMC free article] [PubMed] [Google Scholar]
- Ben Arous J, Tanizawa Y, Rabinowitch I, Chatenay D, Schafer WR. Automated imaging of neuronal activity in freely behaving Caenorhabditis elegans. J Neurosci Meth. 2010;187:229–234. doi: 10.1016/j.jneumeth.2010.01.011. [DOI] [PubMed] [Google Scholar]
- Bullmore E, Sporns O. The economy of brain network organization. Nat Rev Neurosci. 2012;13:336–349. doi: 10.1038/nrn3214. [DOI] [PubMed] [Google Scholar]
- Chalfie M, Sulston JE, White JG, Southgate E, Thomson JN, Brenner S. The neural circuit for touch sensitivity in Caenorhabditis elegans. J Neurosci. 1985;5:956–964. doi: 10.1523/JNEUROSCI.05-04-00956.1985. [DOI] [PMC free article] [PubMed] [Google Scholar]
- Chen BL, Hall DH, Chklovskii DB. Wiring optimization can relate neuronal structure and function. Proc Natl Acad Sci U S A. 2006;103:4723–4728. doi: 10.1073/pnas.0506806103. [DOI] [PMC free article] [PubMed] [Google Scholar]
- Chronis N, Zimmer M, Bargmann CI. Microfluidics for in vivo imaging of neuronal and behavioural activity in Caenorhabditis elegans. Nat Meth. 2007;4:727–731. doi: 10.1038/nmeth1075. [DOI] [PubMed] [Google Scholar]
- Colizza F, Flammini A, Serrano MA, Vespignani A. Detecting rich-club ordering in complex networks. Nat Physics. 2006;2:110–115. doi: 10.1038/nphys209. [DOI] [Google Scholar]
- Freeman LC. Set of measures of centrality based on betweenness. Sociometry. 1977;40:35–41. doi: 10.2307/3033543. [DOI] [Google Scholar]
- Gray JM, Hill JJ, Bargmann CI. A circuit for navigation in Caenorhabditis elegans. Proc Natl Acad Sci U S A. 2005;102:3184–3191. doi: 10.1073/pnas.0409009101. [DOI] [PMC free article] [PubMed] [Google Scholar]
- Guimerá R, Amaral LAN. Cartography of complex networks: modules and universal roles. J Stat Mech. 2005;2005:1–13. doi: 10.1088/1742-5468/2005/02/P02001. [DOI] [PMC free article] [PubMed] [Google Scholar]
- Hagberg AA, Schult SA, Swart PJ. Exploring network structure, dynamics, and function using NetworkX. Proceedings of the 7th Python in Science Conference (SciPy2008); 2008. p. 1115. Online: http://conference.scipy.org/proceedings/SciPy2008/index.html. [Google Scholar]
- Hall DH, Altun ZF. Cold Spring Harbor, New York: Cold Spring Harbor; 2008. C. elegans Atlas. [Google Scholar]
- Henderson JA, Robinson PA. Geometric effects on complex network structure in the cortex. Phys Rev Lett. 2011;107 doi: 10.1103/PhysRevLett.107.018102. 018102–018106. [DOI] [PubMed] [Google Scholar]
- Jarrell TA, Wang Y, Bloniarz AE, Brittin CA, Xu M, Thomson JN, Albertson DG, Hall DH, Emmons SW. The connectome of a decision-making neural network. Science. 2012;337:437–444. doi: 10.1126/science.1221762. [DOI] [PubMed] [Google Scholar]
- Kaiser M, Hilgetag CC. Non-optimal component placement, but short procesing paths, due to distance projections in neural systems. PLoS Comput Biol. 2006;2:e95. doi: 10.1371/journal.pcbi.0020095. [DOI] [PMC free article] [PubMed] [Google Scholar]
- Kaiser M, Varier S. Evolution and development of brain networks: from Caenorhabditis elegans to Homo sapiens. Network. 2011;22:143–147. doi: 10.3109/0954898X.2011.638968. [DOI] [PubMed] [Google Scholar]
- Kawano T, Po MD, Gao S, Leung G, Ryu WS, Zhen M. An imbalancing act: gap junctions reduce the backward motor circuit activity to bias C. elegans for forward locomotion. Neuron. 2011;72:572–586. doi: 10.1016/j.neuron.2011.09.005. [DOI] [PubMed] [Google Scholar]
- Latora V, Marchiori M. Efficient behavior of small-world networks. Physical Review Letters. 2001;87:198701. doi: 10.1103/PhysRevLett.87.198701. [DOI] [PubMed] [Google Scholar]
- Li W, Feng Z, Sternberg PW, Xu XZ. A C. elegans stretch receptor neuron revealed by a mechanosensitive trp channel homologue. Nature. 2006;440:684–687. doi: 10.1038/nature04538. [DOI] [PMC free article] [PubMed] [Google Scholar]
- Meunier D, Lambiotte R, Fornito A, Ersche KD, Bullmore ET. Hierarchical modularity in human brain functional networks. Front Neuroinform. 2009;3:37. doi: 10.3389/neuro.11.037.2009. [DOI] [PMC free article] [PubMed] [Google Scholar]
- Meunier D, Lambiotte R, Bullmore ET. Modular and hierarchically modular organization of brain networks. Front Neurosci. 2010;4:200. doi: 10.3389/fnins.2010.00200. [DOI] [PMC free article] [PubMed] [Google Scholar]
- Milo R, Shen-Orr S, Itzkovitz S, Kashtan N, Chklovskii D, Alon U. Network motifs: Simple building blocks of complex networks. Science. 2002;298:824–827. doi: 10.1126/science.298.5594.824. [DOI] [PubMed] [Google Scholar]
- Milo R, Itzkovitz S, Kashtan N, Levitt R, Shen-Orr S, Ayzenshtat I, Sheffer M, Alon U. Superfamilies of evolved and designed networks. Science. 2004;303:1538–1542. doi: 10.1126/science.1089167. [DOI] [PubMed] [Google Scholar]
- Newman MEJ, Girvan M. Finding and evaluating community structure in networks. Phys Rev E Stat Nonlin Soft Matter Phys. 2004;69 doi: 10.1103/PhysRevE.69.026113. 026113. [DOI] [PubMed] [Google Scholar]
- Pan RK, Chatterjee N, Sinha S. Mesoscopic organization reveals the constraints governing Caenorhabditis elegans nervous system. PLoS One. 2010;5:e9240. doi: 10.1371/journal.pone.0009240. [DOI] [PMC free article] [PubMed] [Google Scholar]
- Piggott BJ, Liu J, Feng Z, Wescott SA, Xu XZ. The neural circuits and synaptic mechanisms underlying motor initiation in C. elegans. Cell. 2011;147:922–933. doi: 10.1016/j.cell.2011.08.053. [DOI] [PMC free article] [PubMed] [Google Scholar]
- Rubinov M, Sporns O. Complex network measures of brain connectivity: uses and interpretations. Neuroimage. 2010;52:1056–1069. doi: 10.1016/j.neuroimage.2009.10.003. [DOI] [PubMed] [Google Scholar]
- Sales-Pardo M, Guimerá R, Amaral LA. Classes of complex networks defined by role-to-role connectivity profiles. Nat Physics. 2007;3:63–69. doi: 10.1038/nphys489. [DOI] [PMC free article] [PubMed] [Google Scholar]
- Sporns O, Kötter R. Motifs in brain networks. PloS Biol. 2004;2:e369. doi: 10.1371/journal.pbio.0020369. [DOI] [PMC free article] [PubMed] [Google Scholar]
- Sulston JE. Post-embryonic development in the ventral cord of Caenorhabditis elegans. Phil Trans Roy Soc Lond B. 1976;938:287–297. doi: 10.1098/rstb.1976.0084. [DOI] [PubMed] [Google Scholar]
- Sulston JE, Schierenberg E, White JG, Thomson JN. The embryonic cell lineage of the nematode C. elegans. Dev Biol. 1983;100:64–119. doi: 10.1016/0012-1606(83)90201-4. [DOI] [PubMed] [Google Scholar]
- Tsalik EL, Hobert O. Functional mapping of neurons that control locomotory behavior in Caenorhabditis elegans. J Neurobiol. 2003;56:178–197. doi: 10.1002/neu.10245. [DOI] [PubMed] [Google Scholar]
- van den Heuvel M, Sporns O. Rich-club organization of the human connectome. J Neurosci. 2011;31(44):15775–15786. doi: 10.1523/JNEUROSCI.3539-11.2011. [DOI] [PMC free article] [PubMed] [Google Scholar]
- van den Heuvel MP, Kahn RS, Goñi J, Sporns O. High-cost, high-capacity backbone for global brain communication. Proc Natl Acad Sci U S A. 2012;109:11372–11377. doi: 10.1073/pnas.1203593109. [DOI] [PMC free article] [PubMed] [Google Scholar]
- Varier S, Kaiser M. Spatio-temporal development of the Caenorhabditis elegans neuronal network. PLoS Comp Biol. 2011;7:e1001044. doi: 10.1371/journal.pcbi.1001044. [DOI] [PMC free article] [PubMed] [Google Scholar]
- Varshney LR, Chen BL, Paniagua E, Hall DH, Chklovskii DB. Structural properties of the C. elegans neuronal network. PLoS Comp Biol. 2011;7:e1001066. doi: 10.1371/journal.pcbi.1001066. [DOI] [PMC free article] [PubMed] [Google Scholar]
- Watts DJ, Strogatz SH. Collective dynamics of ‘small-world’ networks. Nature. 1998;393:440–442. doi: 10.1038/30918. [DOI] [PubMed] [Google Scholar]
- White JG, Southgate E, Thomson JN, Brenner S. The structure of the nervous system of the nematode Caenorhabditis elegans. Phil Trans Roy Soc Lond B. 1986;314:1–340. doi: 10.1098/rstb.1986.0056. [DOI] [PubMed] [Google Scholar]
- Wicks SR, Roehrig CJ, Rankin CH. A dynamic network simulation of the nematode tap withdrawal circuit: predictions concerning synaptic function using behavioural criteria. J Neurosci. 1996;15:4017–4031. doi: 10.1523/JNEUROSCI.16-12-04017.1996. [DOI] [PMC free article] [PubMed] [Google Scholar]
- Zhou S, Mondragon RJ. The rich-club phenomenon in the internet topology. IEEE Comm Lett. 2004;8:180–182. doi: 10.1109/LCOMM.2004.823426. [DOI] [Google Scholar]