

Abstract
In this article, we couple the geographic variation in 127 single-nucleotide polymorphism (SNP) frequencies in genes of 46 enzymes of central metabolism with their associated cis-expression variation to predict latitudinal or climatic-driven gene expression changes in the metabolic architecture of Drosophila melanogaster. Forty-two percent of the SNPs in 65% of the genes show statistically significant clines in frequency with latitude across the 20 local population samples collected from southern Florida to Ontario. A number of SNPs in the screened genes are also associated with significant expression variation within the Raleigh population from North Carolina. A principal component analysis of the full variance–covariance matrix of latitudinal changes in SNP-associated standardized gene expression allows us to identify those major genes in the pathway and its associated branches that are likely targets of natural selection. When embedded in a central metabolic context, we show that these apparent targets are concentrated in the genes of the upper glycolytic pathway and pentose shunt, those controlling glycerol shuttle activity, and finally those enzymes associated with the utilization of glutamate and pyruvate. These metabolites possess high connectivity and thus may be the points where flux balance can be best shifted. We also propose that these points are conserved points associated with coupling energy homeostasis and energy sensing in mammals. We speculate that the modulation of gene expression at specific points in central metabolism that are associated with shifting flux balance or possibly energy-state sensing plays a role in adaptation to climatic variation.
Keywords: energy sensing, metabolism, life history, clines, gene expression variation
Introduction
A goal of modern evolutionary genetics should be to integrate our understanding of the causes of genetic and molecular variation among genes into larger functional contexts. The promise of exploring adaptive natural selection on all genes in the genome (Clark et al. 2007; Greenberg et al. 2008; Andres et al. 2009; Liti et al. 2009) has led to the expectation that we can predict how the inherent roles, properties, network, and pathway context of enzymes determine their relative participation in adaptive evolution (Lu and Rausher 2003; Cork and Purugganan 2004; Flowers et al. 2007, 2009; Alvarez-Ponce et al. 2009, 2012; Obbard et al. 2009; Ramsay et al. 2009; Jumbo-Lucioni et al. 2010; Eanes 2011; Clark et al. 2012). Using interspecific and intraspecific contrasts, it is claimed that a significant portion of the amino acid replacements among Drosophila species are mutations involved in adaptive change (Smith and Eyre-Walker 2002; Shapiro et al. 2007), but little progress has been made in defining those context-dependent properties that determine the likelihood that a given gene participates in adaptive response. Although much of the focus has been on amino acid mutations, where functional effect is ambiguous in most cases, only a handful of studies have focused on geographic variation in expression polymorphism (Whitehead and Crawford 2006; Fraser et al. 2010; Fraser 2013).
Drosophila melanogaster is one of the best models with which to explore natural selection in a geographic and ecological context. In temperate regions, the population is envisioned as a seasonal metapopulation, where populations die back during the winter followed by local reestablishment of populations in the spring that are seeded through survivors in basements, barns, and compost piles, and thus contributing to a local genetic continuity through time (Ives 1945, 1954; Reaume and Sokolowski 2006; Shpak et al. 2010; Garrigan et al. 2010). This local survival of populations has led to the expectation that there are adaptations that are associated with the colonization of cosmopolitan populations that span a wide range of environments from subtropical to temperate and that often are associated with seasonal variation in seasonal nutrient availability. Many adaptations must involve changes in metabolic architecture, as energy tradeoffs are known to shift along the climatic gradient. The presence of latitudinal clines in the frequencies of alleles in many metabolic genes (Sezgin et al. 2004) suggests this spatial-seasonal model is plausible for studying genetic response in a defined context, namely the pathways of central metabolism. There has been considerable progress in describing variation at the full genome level in D. melanogaster (Clark et al. 2007; Kolaczkowski et al. 2011; Vishnoi et al. 2011; Fabian et al. 2012). These studies have explored genome-wide patterns of differentiation at very low resolution across the entire genome at geographic range extremes and matched them to coarse functional classes but have not examined patterns of variation in finer geographical detail in well-defined functional contexts.
The goal of this study is to evaluate clinal variation in single-nucleotide polymorphisms (SNPs) associated with cis-expression variation in central metabolic genes across D. melanogaster populations spanning a seasonal climate gradient in the eastern US and use this knowledge to predict geographic changes in central metabolic pathway architecture. It is expected that this can be used to identify gene targets and mechanisms of adaptation. The pathway represents the central flow and partitioning of energy as nutrient levels change (Gershman et al. 2007), and it is likely that this partitioning varies geographically with those life history challenges associated with somatic maintenance and reproduction. Moreover, aside from simple energy partitioning, it is well known that particular metabolites of central metabolism play key signaling roles in energy-state sensing. It follows that variation in expression of associated enzymes in close pathway proximity to these metabolites may respond to changing selection pressures to reset signal levels that couple nutritional state to overall downstream metabolic and stress responses (Moore et al. 2003; Kim and Dang 2005; Kim et al. 2008; Rathmell and Newgard 2009; Wellen et al. 2009).
Results
General Summary of Clines and Expression Quantitative Trait Nucleotides
We used bulk pyrosequencing to examine allele frequencies for 127 SNPs in 46 genes of central metabolism across 20 local populations spanning a latitudinal gradient from southern Florida to Ontario. SNP selection was not intended to be exhaustive but to use the bulk pyrosequencing approach to screen several SNPs per gene. The number of SNPs screened per gene depended partly on the resident variation, which varies considerably among loci. For example, six genes possess a single screened SNP, and several have as many as seven screened SNPs; the average number per gene is 2.6 SNPs. Each SNP was tested for clinal variation by a linear regression of allele frequency against latitude. We find that 53 of 127 SNPs are significantly clinal in 30 of 46 genes at α < 0.05. We might have expected six to seven significant SNPs at this type I error rate, so the prevalence of clines in these genes is clear. Our tests of SNPs within genes are not statistically independent, and the possibility of reporting a gene with a significant cline simply because of type 1 error obviously increases with the number of SNPs sampled per gene. We are unable to test for a gene-wise error by controlling for the linkage correlation because the bulk pyrosequencing produces only a mean frequency estimate for each population. Overall, using a value cutoff of q < 0.04 (Storey and Tibshirani 2003) that takes into account our multiple tests of clinal significance (but ignores within gene linkage disequilibrium), we still predict a significant cline in one or more SNPs in 30 of 46 genes (supplementary table S1, Supplementary Material online).
Among genes, there is evidence for cis-expression effects for many of these SNPs. Our SNPs were selected for pyrosequencing focusing on amino acid changes and those SNPs acting best as proxies for haplotype structure. They were not preselected for cis-expression association. Many potential SNPs cannot be screened because they possess closely linked polymorphisms that overlap pyrosequencing primers or are in close proximity and interfere with the pyrosequencing estimate. Finally, a small proportion fails for unknown reasons.
For each screened SNP, we tested association with expression variation using a nested analysis of variance (ANOVA) of the Affymetrix Drosophila 2.0 array expression data reported in Ayroles et al. (2009) and the original 37 sequences of the Drosophila melanogaster Genetic Reference Panel (DGRP) first released in 2009 (Mackay et al. 2012). We observe cases of significant expression quantitative trait nucleotides (eQTNs) in 21 genes if we ignore nonindependence and multiple tests. Using multiple test criteria within each gene to control for a gene-wise error rate (Stranger et al. 2007), we find that 12 of 46 genes possess at least one significant eQTN in the coding region of one or both sexes using the FDR of 10%. Ten of these 12 genes possess a significant cline in the most significant eQTN (supplementary table S1, Supplementary Material online). We should note that the relative allelic expression variation for several genes is not subtle. For example, in the DGRP, the relative differences in expression associated with the SNP alleles in Raleigh, NC, at Gpdh and Got2 are 47% and 29%, whereas those associated with the alleles at Idh-β, Hex-A, and Pgd are 18%.
For each gene, the SNP with the largest cis-acting effect was used with the SNP allele frequency to predict, assuming additivity, the mean gene expression expected for each gene and each collection locality (see Materials and Methods). This matrix of population-by-gene mean expression was used in the principal component analysis (PCA).
PCA
The PCA of the full geographic-expression data of 45 genes (Adh was removed) allows us to identify the major patterns of across population gene expression variation and covariation along the eastern US climatic gradient. We have carried out the PCA on the variance–covariance matrix of standardized eQTN expression. High gene loadings on the first principal component will reflect those genes with both strong allele frequency variation and the large average allelic effects on expression. The percent variances associated with the first three PCs were 50%, 12%, and 8%, respectively. Table 1 shows the individual gene expression loadings associated with the first three principal components, as ranked by gene loadings on the first component. SNPs with significant allele effects on expression are footnoted. They show, by sign respectively, decreasing and increasing mean expression with increasing latitude. The population scores for the first PC axis shows a strong correlation with latitude (fig. 1; r = 0.833, P < 0.0001). This is because the most of the variance–covariance among genes in mean population expression is associated with the latitudinal distribution of population allele frequencies. The six genes with the highest positive loadings and significant eQTNs are Men-b, Gpdh, Got-2, Gdh, Pdk, and Acon. The five genes with the most negative loadings and significant eQTNs are Idh-β, Pgd, Tpi, UGPase, and Hex-A.
Table 1.
Gene Loadings on the First Three Principal Components of the SNP Interpopulation Expression Variance–Covariance Matrix.
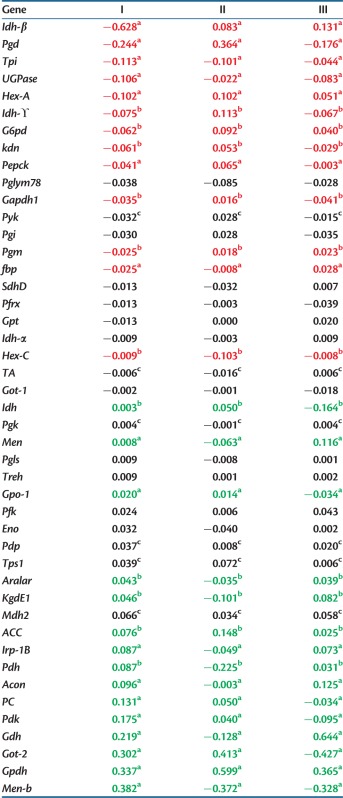 |
aBoth significant cline and allelic effect.
bSignificant allelic effect only.
cSignificant cline in gene only.
Fig. 1.

Relationship of population projections on the first axis and latitude.
To show overall patterns of increased and decreased expression, these gene loadings are placed into a central–peripheral metabolic pathway context in figure 2. The support associated with each step is scaled by the format of the arrow and the direction of expression change with latitude is indicated by color (see fig. 2).
Fig. 2.

The central metabolic pathway and its immediate branches. The color reflects the direction of expression change with increasing latitude (green increasing, red decreasing). Thick arrows are genes with both significant clines and significant expression effects. They possess high PCA1 loadings. Thin colored lines have significant expression effects but no significant clines. Dotted lines have nonsignificant expression effects but may or may not have significant clines. The latter two groups are simply suggestive of change and direction. Black solid lines (ATPCL) are not available. The red and yellow dots represent NADH and NAD cofactors, respectively, and the large red dotted line is the cytoplasmic-mitochondrial boundary. The metabolities with highest connectivity are boxed. The results for Men, Gpt, and Pfrx are not included to prevent undue complexity.
Discussion
The goal of this study is to identify steps or nodes in the central and peripheral metabolic pathway of glycolysis where SNP-associated expression variation is an apparent target of natural selection in response to environmental correlates of latitude. In the apparent absence of isolating structures, geographic clines have frequently been interpreted as evidence of selection and adaptation to climate and associated variables. Our question is whether adaptation associated with the clines involves the modulation of gene expression in this pathway, and whether this modulation is focused on particular nodes, networks, or genes. In this study, we use a two-step approach where both latitudinal patterns and observed SNP effects on expression are integrated and then evaluated in the context of the central metabolic pathway to identify those steps that are most likely to be involved in climatic adaptation and suggest a mechanism.
Several steps within this well-described pathway predict interesting shifts in metabolic architecture (highlighted in fig. 2) that we propose could reflect selection on either of two related phenotypes. The first phenotype is a shift in flux balance or the partitioning of flux. The genes most strongly associated with clinal climatic change are those linked with metabolites with the highest connectivity in the overall metabolic network. Wagner and Fell (2001) in assessing the network architecture of central metabolism in Escherichia coli (similar in metazoans) placed glutamate and pyruvate first and second in their connectivity rank, followed by CoA, 2-oxglutarate, glutamine, and aspartate (see fig. 2). Gdh, Got2, and Idh-β directly affect glutamate and 2-oxglutarate, and Got2 also affects aspartate well. Pdk, PC, and Men-b all impact the metabolism of pyruvate. Wagner and Fell (2001) did not address the energy cofactors, NAD/NADH, NADP/NADPH, and ATP/ADP because those possess even greater connectivity. However, Hex-A, Pgd, Gdh, Gpdh, and Gpo-1 use these cofactors that reflect energy state. This observation raises the speculation that expression selection for genes at the nodes with the highest connectedness is central to changing metabolic flux balance, and it is expression variation in these genes that is responding to selection along the cline to shift this balance.
A second phenotype could be the cellular levels of the highly connected metabolites themselves and their effect on energy-state sensing in response to changing nutrient levels. The nutrient response networks are early features of evolution and appear widely conserved. In these networks, metabolite levels trigger downstream transcriptional changes to shifting nutrient input. The detection of nutrient state and its response generally acts through the levels of metabolites that are most reactive to nutrient input. For example, in plants where light, temperature, and CO2 affect photosynthesis, it is the sugars that signal energy levels and initiate downstream gene transcription that determines plastic growth responses (e.g., Heisel et al. 2013; Xiong et al. 2013). Many studies in mammals have shown that perturbation of the enzymes of the central metabolic pathway sets energy state and determine insulin secretion especially through mitochondrial function (e.g., Guay et al. 2007). In D. melanogaster, there are comparable pancreatic models of energy- or nutrient sensing that involve neurosecretory cells (Toivonen and Partridge 2008; Nassel and Winther 2010).
This introduces the hypothesis that natural genetic variation in key metabolic enzymes may play a role not only in shifting flux balance but also in setting homoeostatic limits, acting as “energy-stats” that determine the nutritional set points that trigger downstream responses of the well-established sensing pathways in Drosophila (Baker and Thummel 2007; Savraj 2009). If the sensing mechanisms are universally conserved around the same common metabolites, then we should have in Drosophila the same interest in the enzymes associated with cofactor shuttles (see Eto et al. [1999], as well as certain branches that share metabolites with high connectivity [e.g., glutamate and pyruvate]). As discussed in more individual detail below, these shifts should involve the hexokinases, those enzymes of the NAD/NADH cofactor or redox shuttles, and those enzymes at the glutamate node. Moreover, enzymes with function in the mitochondria also hold special interest because of well-established signaling responses to nutrient levels associated with mitochondrial function (Wiederkehr and Wollheim 2006; Baltzer et al. 2010; Cho et al. 2011). Therefore, we might propose that expression variation observed in genes encoding these enzymes may respond to the climatic variation along a latitudinal tropical-temperate gradient that varies seasonal and locally in the availability of nutrients. The unparalleled biochemical and physiological knowledge of many steps in the central metabolic pathway allows a functional interpretation of the consequences of expression variation.
Overall, in the upper glycolytic pathway and its branches, there appears to be coordinated decreases in expression with latitude. Both of the principal hexokinase genes, Hex-A and Hex-C (Duvernell and Eanes 2000), show lower SNP-associated expression with increasing latitude, as do the enzymes of the pentose shunt (G6pd, Pgd, TA), Tpi, fbp, Gapdh1, and UGPase. These reductions along with reduced Pepck suggest an overall decrease in gluco- and glyconeogenesis with latitude with an increase in fatty acid synthesis. The hexokinases have singly emerged as having jack-of-all-trade function in both animals and plants (Cho and Yoo 2011) and especially in the roles of nutrient signaling associated with glucose and glucose-6-phosphate (Moore et al. 2003; Cho and Yoo 2011). The role of glucokinase mutations in the misreading of glucose sensing in humans is very well established; many regulatory mutations in glucokinase reset the blood glucose levels where insulin in secreted, creating hypo- and hyperglycemia (Matschinsky 2005; Matschinsky et al. 2006).
Here, the two major genes (Gdh and Got2) for enzymes coupled to glutamate metabolism in the mitochondria both show increases in population-level expression with latitude. Glutamate is important because it stands at the intersection of carbohydrate and amino acid metabolism and will clearly reflect nutrition status (Brosnan 2000). Both enzymes control the entry of amino acids into carbohydrate and energy metabolism. It is well established that glutamate is an important signaling molecule for energy state (Karaca et al. 2011). Moreover, regulatory mutations in human GDH are also associated with hyperinsulinism; they reset energy-state signaling associated with amino acid levels (Stanley 2004). Given GDH’s regulatory sensitivity to redox state, the parallel and elevated level of expression with the glycerol shuttle genes (Gpdh and Gpo1) is particularly intriguing.
The third general observation is the increasing expression of Gpdh and Gpo-1 with latitude. Both enzymes are associated with the essential glycerol shuttle that transfers NAD/NADH equivalents into the mitochondria for subsequent use in oxidative phosphorylation. This is the major cofactor shuttle in insects (O’Brien and MacIntyre 1972; MacIntyre and Davis 1987; Carmon and MacIntyre 2010) and should control the redox balance in the mitochondria. The essential role of the NAD/NADH shuttles in nutrient sensing in mammals has been noted repeatedly (Eto et al. 1999), and it is well established that starvation in Drosophila significantly changes the redox ratio upward (Zhu and Rand 2012). Furthermore, by setting NAD/NADH ratio, this shuttle should couple metabolic status with transcriptional control through the sirtuins, the NAD-dependent histone deacetylases (Imai et al. 2000) shown to affect chromatin silencing and impact life span in number of organisms (Imai 2011). Both members, Gpdh and Gpo-1, show enhanced activity, but this does not predict direction, just an increase in shuttle function in the north.
Although a number of robust and novel connections emerge from our analysis, we note several caveats. The whole body measures of adult expression make it difficult to predict functional responses for genes whose enzyme products possesses roles in many tissues and often are functionally and physiologically reversible, possessing both energy producing and energy consuming roles (e.g., PGI). Other genes are more specialized (e.g., PEPCK in the fat body) and are effectively irreversible in those tissues, so the predicted response is less equivocal. Nevertheless, as first entries into these questions, we believe that we have recovered informative signal from the expression that is averaged across many tissues.
In some genes, there are undoubtedly SNPs with stronger expression effects that we have not screened. Although relatively comprehensive, the SNPs we evaluated with bulk pyrosequencing are not random. We emphasized coding regions, SNPs that are amino acid replacement polymorphisms, and those that are associated with haplotype structure. They were not initially targeted for expression effects. It is possible that although coding regions can have significant effects on gene expression (Kudla et al. 2009), we may have found better candidates for cis-expression SNPs in 5′-noncoding regions (Massouras et al. 2012). Furthermore, the availability of suitable polymorphisms varies gene-by-gene, and we cannot screen every SNP with possible expression effects. In some cases, we have not screened the SNP with the greatest expression effect in a gene but a linked SNP that is in disequilibrium. In this case, our SNP is a weaker proxy for a SNP of greater effect. Therefore, we may underestimate the latitudinal change in cis-expression at some genes. Finally, we assume that the allelic effects estimated in the Raleigh DGRP do not significantly change across the cline. This is impossible to assess without independent studies as Ayroles et al. (2009) in other populations.
Many of the SNPs are amino acid polymorphisms or are in linkage disequilibrium with amino acid polymorphisms. Some amino acid changes are associated with transcript expression, but others have no expression effects. These may have functional catalytic influence and are clinal because of these catalytic differences. For example, there are no cis-expression variable sites in the Pdp gene, but there are three prominent amino acid polymorphisms (all in linkage disequilibrium) that are strongly clinal. These residues in PDP might play a role in the regulation and activation of PDH. Without a detailed functional study, this cannot be determined and in many cases the required functional characterizations would be challenging.
It is important to recognize that the absence of either cis-expression variation or clines in many genes is expected. This is because the control of flux in pathways and networks is likely to be distributed unevenly and concentrated at different steps as consequence of pathway architecture or the unique regulation of the enzymatic steps and pathway (Fell 1997; Olson-Manning et al. 2013). If extant expression variation reflects functional responses under selection, then the absence of cis-effect variation could simply reflect the lack of potential for step control at that point. Thus, the absence of effects, if real and not an artifact, is just as informative to understand the metabolic architecture as the presence. For example, Pyk and Idh, and the lower elements of the glycolytic pathway are possibly ineffective as targets of selection because they possess low control. Alternatively, some genes may possess pleiotropic constraints or tissue-specific tradeoffs or are poor mutagenic targets for cis-based expression variation. Without the independent, and albeit difficult, experimental assessment of metabolic control at each step (Eanes 2011), it is impossible to address this hypothesis. It is also unclear how increased or reduced activity in the near-equilibrium bidirectional enzymes with wide tissue specificity, such as the central glycolytic core (e.g., Tpi, Pgi, and Eno), affects bias in glycolytic, gluconeogenic, or glycogenic flux. It is proposed theoretically (Wright and Rausher 2010) and shown empirically (Olson-Manning et al. 2013) that flux control localizes at the top of one-way pathways. However, the central pathway is not easily interpreted in that top–bottom context.
The goal of our report is to integrate the population genetics of geographic variation of SNPs with gene expression effects and then interpret this integration in the functional context of the central metabolic pathway. From this integration, interesting associations emerge that suggest hypotheses about selection on the pathway that requires further consideration. We have not proven flux balance nor energy sensing as the phenotypes that has come under selection for these genes: Rather, we have introduced them as hypotheses that emphasize different roles of expression selection on metabolic genes. For example, this is in contrast to the often advanced hypothesis that genetic variation is maintained through temperature-dependent kinetic tradeoffs that maintain constant flux and performance along a thermal cline (Place and Powers 1979; DiMichele and Powers 1982; Hall and Koehn 1983). Our hypothesis, that energy sensing and resource utilization represent the functional basis for selection on metabolic enzymes across environmental gradients, generates predictions that can be tested experimentally. Driven by the need to understand diet-associated ageing and causes of metabolic syndrome, huge progress has been made in unraveling the downstream components of energy sensing in D. melanogaster and other models (Taguchi and White 2008; Toivonen and Partridge 2008; Fontana et al. 2010), but the initial sensing mechanism is unknown. In Drosophila, experimental manipulation of gene expression is tractable using both P-element-associated knockouts of whole-body expression (Merritt et al. 2005; Eanes et al. 2006, 2008), as well as tissue-specific RNAi knockdown (Dietzl et al. 2007; Schnorrer et al. 2010). This should allow the targeted suppression and overexpression of genes of interest in the neurosecretory cells (Giannakou et al. 2004; Lee and Park 2004) and the evaluation of sensing. The effects of these manipulations on energy sensing and associated life history phenotypes can then be evaluated. The study of genetic variation in central metabolism and adaptation is a long running and multidimensional problem generally associated with energy production (Zera 2011). However, the expanding participation of metabolic enzymes in roles outside the theme of simple energy production is increasingly being recognized (Kim and Dang 2005; Marden 2013), and this model advances a new role for expression and catalytic-based genetic variation in metabolic genes in adaptation to changing environments.
Materials and Methods
Data Sources—Pathway Genes Identified
To assemble the 46 candidate genes presenting enzymes of the core pathways, we used FLYBase. Some genes possess multiple orthologs; one is the somatic member involved in core metabolism. We have used several criteria to determine the most relevant member of each gene set. First is high homology to vertebrate members. Second, core enzymes have high somatic expression that is not specific to testis or ovaries. Central metabolic genes have exceptionally high codon biases. Third, mitochondrial proteins have high pIs (Hartmann et al. 1991; Dinur-Mills et al. 2008). In the case of genes with only a candidate gene CG definition, we have introduced abbreviations that are similar or identical with those used in mammalian names.
As our database for SNP identification, we used the 37 D. melanogaster genome sequences released in August 2010 by the DGRP (Mackay et al. 2012). These sequences had already been assembled and annotated to the FlyBase reference sequence (version 5.12). Nevertheless, final choice of useful SNPs was carried out gene-by-gene by further manual inspection. The coding regions of each gene were extracted and the quality score for each base assessed. SNPs where the minority allele quality score was less than 30 were reset to the majority allele. Most of these cases appear as singletons. Finally, focal SNPs for the cline were selected where the minority allele was more than 0.10 in the DGRP.
Selection of SNPs
Many SNPs could not be screened by pyrosequencing because flanking polymorphisms bias amplification in the bulk preparation or the pyrosequencing step failed. Many SNPs were also selected before the Ayroles et al. (2009) expression data were available. Amino acid polymorphisms were favored. We also favored SNPs that were diagnostic of important haplotypes seen in the DGRP collection. We only used sites with a minority allele that was more than 10% in the Raleigh data, and attempts were made to minimize LD among sites by spacing SNPs at distance of more than 500 bp when possible.
Population Collections
In 2009 and 2010, we collected samples from 18 local populations across the eastern United States. Adults were collected by sweep net and immediately separated by sex. Males were preserved in 95% ethanol and stored at −70 °C. Females were allowed to oviposit, preserved, and stored. We also included the 2005 population data from Raleigh, NC (Mackay et al. 2012); we obtained 34 inbred DGRP lines from the Bloomington Stock Center. We included two collections (pooled) from 2007 and 2008 from Sudbury, ON. In each isofemale line, the progeny from the F1 generation was preserved in EtOH for bulk DNA preparation. Two female progenies were collected from each preserved line and pooled with the collected males in the bulk sample for pyrosequencing. By sampling two progenies per line in the F1 generation, we are sampling two to four independent chromosomes from the population per line, with an average of 3. The expected number of chromosomes per bulked sample is therefore three times the number of female lines plus twice the number of wild-collected males. The average number of independent genomes pooled per population sample was n = 114.7. The entire data base thus consisted of 2,524 genomes. The sources and sample sizes of the 20 population samples are provided in supplementary table S2, Supplementary Material online.
Pyrosequencing
Bulk DNA purification was performed with Puregene Core Kit A (Qiagen) using 42–100 flies per population (sample sizes in supplementary table S2, Supplementary Material online). We used pyrosequencing in the bulk DNA preps to estimate SNP frequency (Lavebratt and Sengul 2006; Doostzadeh et al. 2008). We checked the precision of the method by comparing the estimated frequency of each SNP to the expected frequency for the DGRP population based on the genome sequences (r = 0.99). Pyrosequencing was carried out using the PyroMark MD machine and peak heights scored to estimate SNP. Primers were designed using the PyroMark Assay Design software. A universal biotinylated primer was used in combination with two locus-specific primers (Guo and Milewicz 2003). In a few cases, performance of universal primer was poor, and direct-biotinylated locus-specific primers were used.
Clines
Allele frequency estimates were arc-sine transformed (Sokal and Rohlf 1981) and tested by linear regression against latitude. Individual probabilities for single tests are determined by random permutation of latitudes 10,000 times. We might expect a proportion of these cline discoveries to be false positives. The within-gene SNP tests are not independent, but we cannot capture the within population SNP correlation structure because the pyrosequencing provides mean estimates without individual genotypes. The entire set was tested for set-wide significance using q values (Storey and Tibshirani 2003), and a q value of 4% was assigned as a cutoff as support of a cline in each SNP.
Expression Variation and eQTNs
We downloaded the whole-adult Affymetrix Drosophila 2.0 array expression data (accession number E-MEXP-1594) reported in Ayroles et al. (2009) and the original 37 sequences of the DGRP first released in 2009 (Mackay et al. 2012). Probes with underlying SNPs were removed or masked (Benovoy et al. 2008; Chen et al. 2009). The sex effect for each gene was removed and the residuals rescaled to standardized deviates using the total sample variance. A nested ANOVA is carried out on standardized residuals to estimate SNP allele, nested line in SNP, and nested vial within line effects (Yijkl = μ + Ai + Bij + Cijk + εijkl, where Yijkl is an individual expression measure, Ai is the effect of the ith allele, Bij is the effect of line j within the ith SNP allele, and Cijk is the effect of kth vial within line j and the ith SNP allele and εijkl is the error term within vials) using the JMP program (JMP-SAS). We used the parameter, ai specifying the genotypic effect for each pair of alleles, to estimate population mean expression (see below).
Some of the within-gene SNP-specific expression effects are not independent. To test for gene-wide significance, we incorporate linkage disequilibrium among sites within each gene and carried out random permutations of expression across lines, keeping the haplotype structure intact. Sexes were treated separately (Massouras et al. 2012). For each 10,000 perturbation set, the highest F value was taken among the SNPs and the 5% tail of the distribution for the 10,000 permutations set as the FDR.
Population Mean Expression and PCA
For each gene, the SNP with the largest cis-acting effect (irrespective of significance) was used. The scaled allelic effect of the ith SNP was used with the SNP allele frequency, qi, to predict, assuming additivity, the mean expression, yi, expected for each collection locality by the simple equation yi = a(1 − 2qi). Thus, the variance in gene expression across populations depends on the cis-acting effect estimate, a, and the variation in allele frequencies, qi. We subjected the variance–covariance matrix for all the genes and populations to a PCA and extracted the major components. The gene loadings on these factors can then be used to summarize the major sources of overall variance–covariance structure of changes in expression for different pathways.
Supplementary Material
Supplementary tables S1 and S2 are available at Molecular Biology and Evolution online (http://www.mbe.oxfordjournals.org/).
Acknowledgments
The authors thank Thomas Merritt for supplying the lines from Sudbury, ON, John True, and Joe Lachance for additional collections from New York, and Frank Jiggins for suggestions on the manuscript. This work was supported by National Institutes of Health grant GM090094 to W.F.E. and John True and Collaborative National Foundation Science grants DEB0921372 to W.F.E. and DEB0542859 and DEB0921307 to P.S.S.
References
- Alvarez-Ponce D, Aguade M, Rozas J. Network-level molecular evolutionary analysis of the insulin/TOR signal transduction pathway across 12 Drosophila genomes. Genome Res. 2009;19:234–242. doi: 10.1101/gr.084038.108. [DOI] [PMC free article] [PubMed] [Google Scholar]
- Alvarez-Ponce D, Guirao-Rico S, Orengo DJ, Segarra C, Rozas J, Aguadé M. Molecular population genetics of the insulin/TOR signal transduction pathway: a network-level analysis in Drosophila melanogaster. Mol Biol Evol. 2012;29:123–132. doi: 10.1093/molbev/msr160. [DOI] [PubMed] [Google Scholar]
- Andres AM, Hubisz MJ, Indap A, Torgerson DG, Degenhardt JD, Boyko AR, Gutenkunst RN, White TJ, Green ED, Bustamante CD, et al. Targets of balancing selection in the human genome. Mol Biol Evol. 2009;26:2755–2764. doi: 10.1093/molbev/msp190. [DOI] [PMC free article] [PubMed] [Google Scholar]
- Ayroles JF, Carbone MA, Stone EA, Jordan KW, Lyman RF, Magwire MM, Rollmann SM, Duncan LH, Lawrence F, Anholt RR, et al. Systems genetics of complex traits in Drosophila melanogaster. Nat Genet. 2009;41:299–307. doi: 10.1038/ng.332. [DOI] [PMC free article] [PubMed] [Google Scholar]
- Baker KD, Thummel CS. Diabetic larvae and obese flies—emerging studies of metabolism in Drosophila. Cell Metab. 2007;6:257–266. doi: 10.1016/j.cmet.2007.09.002. [DOI] [PMC free article] [PubMed] [Google Scholar]
- Baltzer C, Tiefenböck SK, Frei C. Mitochondria in response to nutrients and nutrient-sensitive pathways. Mitochondrion. 2010;10:589–597. doi: 10.1016/j.mito.2010.07.009. [DOI] [PubMed] [Google Scholar]
- Benovoy D, Kwan T, Majewski J. Effect of polymorphisms within probe-target sequences on olignonucleotide microarray experiments. Nucleic Acids Res. 2008;36:4417–4423. doi: 10.1093/nar/gkn409. [DOI] [PMC free article] [PubMed] [Google Scholar]
- Brosnan JT. Glutamate, at the interface between amino acid and carbohydrate metabolism. J Nutr. 2000;130:988S–990S. doi: 10.1093/jn/130.4.988S. [DOI] [PubMed] [Google Scholar]
- Carmon A, MacIntyre R. The alpha-glycerophosphate cycle in Drosophila melanogaster VI. Structure and evolution of enzyme paralogs in the genus Drosophila. J Hered. 2010;101:225–234. doi: 10.1093/jhered/esp111. [DOI] [PubMed] [Google Scholar]
- Chen L, Page GP, Mehta T, Feng R, Cui XQ. Single nucleotide polymorphisms affect both cis- and trans-eQTLs. Genomics. 2009;93:501–508. doi: 10.1016/j.ygeno.2009.01.011. [DOI] [PMC free article] [PubMed] [Google Scholar]
- Cho J, Hur JH, Walker DW. The role of mitochondria in Drosophila aging. Exp Gerontol. 2011;46:331–334. doi: 10.1016/j.exger.2010.08.010. [DOI] [PMC free article] [PubMed] [Google Scholar]
- Cho YH, Yoo SD. Signaling role of fructose mediated by FINS1/FBP in Arabidopsis thaliana. PLoS Genet. 2011;7:e1001263. doi: 10.1371/journal.pgen.1001263. [DOI] [PMC free article] [PubMed] [Google Scholar]
- Clark AG, Eisen MB, Smith DR, Bergman CM, Oliver B, Markow TA, Kaufman TC, Kellis M, Gelbart W, Iyer VN, et al. Evolution of genes and genomes on the Drosophila phylogeny. Nature. 2007;450:203–218. doi: 10.1038/nature06341. [DOI] [PubMed] [Google Scholar]
- Clark NL, Alani E, Aquadro CF. Evolutionary rate covariation reveals shared functionality and coexpression of genes. Genome Res. 2012;22:714–720. doi: 10.1101/gr.132647.111. [DOI] [PMC free article] [PubMed] [Google Scholar]
- Cork JM, Purugganan MD. The evolution of molecular genetic pathways and networks. Bioessays. 2004;26:479–484. doi: 10.1002/bies.20026. [DOI] [PubMed] [Google Scholar]
- Dietzl G, Chen D, Schnorrer F, Su KC, Barinova Y, Fellner M, Gasser B, Kinsey K, Oppel S, Scheiblauer S, et al. A genome-wide transgenic RNAi library for conditional gene inactivation in Drosophila. Nature. 2007;448:151–156. doi: 10.1038/nature05954. [DOI] [PubMed] [Google Scholar]
- DiMichele L, Powers DA. Physiological basis for swimming endurance differences between LDH-B genotypes of Fundulus heteroclitus. Science. 1982;216:1014–1016. doi: 10.1126/science.7079747. [DOI] [PubMed] [Google Scholar]
- Dinur-Mills M, Tal M, Pines O. Dual targeted mitochondrial proteins are characterized by lower MTS parameters and total net charge. PLoS One. 2008;3:e2161. doi: 10.1371/journal.pone.0002161. [DOI] [PMC free article] [PubMed] [Google Scholar]
- Doostzadeh J, Shokralla S, Absalan F, Jalili R, Mohandessi S, Langston JW, Davis RW, Ronaghi M, Gharizadeh B. High throughput automated allele frequency estimation by pyrosequencing. PLoS One. 2008;3:e2693. doi: 10.1371/journal.pone.0002693. [DOI] [PMC free article] [PubMed] [Google Scholar]
- Duvernell DD, Eanes WF. Contrasting molecular population genetics of four hexokinases in Drosophila melanogaster, D. simulans and D. yakuba. Genetics. 2000;156:1191–1201. doi: 10.1093/genetics/156.3.1191. [DOI] [PMC free article] [PubMed] [Google Scholar]
- Eanes WF. Molecular population genetics and selection in the glycolytic pathway. J Exp Biol. 2011;214:165–171. doi: 10.1242/jeb.046458. [DOI] [PMC free article] [PubMed] [Google Scholar]
- Eanes WF, Merritt TJ, Flowers JM, Kumagai S, Sezgin E, Zhu CT. Flux control and excess capacity in the enzymes of glycolysis and their relationship to flight metabolism in Drosophila melanogaster. Proc Natl Acad Sci U S A. 2006;103:19413–19418. doi: 10.1073/pnas.0607095104. [DOI] [PMC free article] [PubMed] [Google Scholar]
- Eanes WF, Merritt TJ, Flowers JM, Kumagai S, Zhu CT. Direct evidence that genetic variation in glycerol-3-phosphate and malate dehydrogenase genes (Gpdh and Mdh1) impacts adult ethanol tolerance in Drosophila melanogaster. Genetics. 2008;181:607–614. doi: 10.1534/genetics.108.089383. [DOI] [PMC free article] [PubMed] [Google Scholar]
- Eto K, Suga S, Wakui M, Tsubamoto Y, Terauchi Y, Taka J, Aizawa S, Noda M, Kimura S, Kasai H, et al. NADH shuttle system regulates K(ATP) channel-dependent pathway and steps distal to cytosolic Ca(2+) concentration elevation in glucose-induced insulin secretion. J Biol Chem. 1999;274:25386–25392. doi: 10.1074/jbc.274.36.25386. [DOI] [PubMed] [Google Scholar]
- Fabian DK, Kapun M, Nolte V, Kofler R, Schmidt PS, Schlotterer C, Flatt T. Genome-wide patterns of latitudinal differentiation among populations of Drosophila melanogaster from North America. Mol Ecol. 2012;21:4748–4769. doi: 10.1111/j.1365-294X.2012.05731.x. [DOI] [PMC free article] [PubMed] [Google Scholar]
- Fell DA. Understanding the control of metabolism. London: Portland Press; 1997. [Google Scholar]
- Flowers J, Sezgin E, Kumagai S, Duvernell D, Matzkin L, Schmidt P, Eanes W. Adaptive evolution of metabolic pathways in Drosophila. Mol Biol Evol. 2007;24:1347–1354. doi: 10.1093/molbev/msm057. [DOI] [PubMed] [Google Scholar]
- Flowers JM, Hanzawa Y, Hall MC, Moore RC, Purugganan MD. Population genomics of the Arabidopsis thaliana flowering time gene network. Mol Biol Evol. 2009;26:2475–2486. doi: 10.1093/molbev/msp161. [DOI] [PubMed] [Google Scholar]
- Fontana L, Partridge L, Longo VD. Extending healthy life span—from yeast to humans. Science. 2010;328:321–326. doi: 10.1126/science.1172539. [DOI] [PMC free article] [PubMed] [Google Scholar]
- Fraser HB. Gene expression drives local adaptation in humans. Genome Res. 2013;23:1089–1096. doi: 10.1101/gr.152710.112. [DOI] [PMC free article] [PubMed] [Google Scholar]
- Fraser HB, Moses AM, Schadt EE. Evidence for widespread adaptive evolution of gene expression in budding yeast. Proc Natl Acad Sci U S A. 2010;107:2977–2982. doi: 10.1073/pnas.0912245107. [DOI] [PMC free article] [PubMed] [Google Scholar]
- Garrigan D, Lewontin R, Wakeley J. Measuring the sensitivity of single-locus “neutrality tests” using a direct perturbation approach. Mol Biol Evol. 2010;27:73–89. doi: 10.1093/molbev/msp209. [DOI] [PMC free article] [PubMed] [Google Scholar]
- Gershman B, Puig O, Hang L, Peitzsch RM, Tatar M, Garofalo RS. High-resolution dynamics of the transcriptional response to nutrition in Drosophila: a key role for dFOXO. Physiol Genomics. 2007;29:24–34. doi: 10.1152/physiolgenomics.00061.2006. [DOI] [PubMed] [Google Scholar]
- Giannakou ME, Goss M, Junger MA, Hafen E, Leevers SJ, Partridge L. Long-lived Drosophila with overexpressed dFOXO in adult fat body. Science. 2004;305:361. doi: 10.1126/science.1098219. [DOI] [PubMed] [Google Scholar]
- Greenberg AJ, Stockwell SR, Clark AG. Evolutionary constraint and adaptation in the metabolic network of Drosophila. Mol Biol Evol. 2008;25:2537–2546. doi: 10.1093/molbev/msn205. [DOI] [PMC free article] [PubMed] [Google Scholar]
- Guay C, Madiraju SRM, Aumais A, Joly E, Prentki M. A role for ATP-citrate lyase, malic enzyme, and pyruvate/citrate cycling in glucose-induced insulin secretion. J Biol Chem. 2007;282:35657–35665. doi: 10.1074/jbc.M707294200. [DOI] [PubMed] [Google Scholar]
- Guo DC, Milewicz DM. Methodology for using a universal primer to label amplified DNA segments for molecular analysis. Biotechnol Lett. 2003;25:2079–2083. doi: 10.1023/b:bile.0000007075.24434.5e. [DOI] [PubMed] [Google Scholar]
- Hall JG, Koehn RK. The evolution of enzyme catalytic efficiency and adaptive inference from steady-state data. Evol Biol. 1983;16:53–69. [Google Scholar]
- Hartmann C, Christen P, Jaussi R. Mitochondrial protein charge. Nature. 1991;352:762–763. doi: 10.1038/352762b0. [DOI] [PubMed] [Google Scholar]
- Heisel TJ, Li CY, Grey KM, Gibson SI. Mutations in histone acetyltransferase1 affect sugar response and gene expression in Arabidopsis. Front Plant Sci. 2013;4:1–13. doi: 10.3389/fpls.2013.00245. [DOI] [PMC free article] [PubMed] [Google Scholar]
- Imai S. Dissecting systemic control of metabolism and aging in the NAD World: the importance of SIRT1 and NAMPT-mediated NAD biosynthesis. FEBS Lett. 2011;585:1657–1662. doi: 10.1016/j.febslet.2011.04.060. [DOI] [PMC free article] [PubMed] [Google Scholar]
- Imai S, Armstrong CM, Kaeberlein M, Guarente L. Transcriptional silencing and longevity protein Sir2 is an NAD-dependent histone deacetylase. Nature. 2000;403:795–800. doi: 10.1038/35001622. [DOI] [PubMed] [Google Scholar]
- Ives PT. Genetic structure of American populations of Drosophila melanogaster. Genetics. 1945;30:167–196. doi: 10.1093/genetics/30.2.167. [DOI] [PMC free article] [PubMed] [Google Scholar]
- Ives PT. Genetic changes in American populations of Drosophila melanogaster. Proc Natl Acad Sci U S A. 1954;40:87–92. doi: 10.1073/pnas.40.2.87. [DOI] [PMC free article] [PubMed] [Google Scholar]
- Jumbo-Lucioni P, Ayroles JF, Chambers MM, Jordan KW, Leips J, Mackay TF, De LM. Systems genetics analysis of body weight and energy metabolism traits in Drosophila melanogaster. BMC Genomics. 2010;11:297. doi: 10.1186/1471-2164-11-297. [DOI] [PMC free article] [PubMed] [Google Scholar]
- Karaca M, Frigerio F, Maechler P. From pancreatic islets to central nervous system, the importance of glutamate dehydrogenase for the control of energy homeostasis. Neurochem Int. 2011;58:510–517. doi: 10.1016/j.neuint.2011.03.024. [DOI] [PubMed] [Google Scholar]
- Kim J, Bang H, Ko S, Jung I, Hong H, Kim-Ha J. Drosophila ia2 modulates secretion of insulin-like peptide. Comp Biochem Physiol A Mol Integr Physiol. 2008;151:180–184. doi: 10.1016/j.cbpa.2008.06.020. [DOI] [PubMed] [Google Scholar]
- Kim JW, Dang CV. Multifaceted roles of glycolytic enzymes. Trends Biochem Sci. 2005;30:142–150. doi: 10.1016/j.tibs.2005.01.005. [DOI] [PubMed] [Google Scholar]
- Kolaczkowski B, Kern AD, Holloway AK, Begun DJ. Genomic differentiation between temperate and tropical Australian populations of Drosophila melanogaster. Genetics. 2011;187:245–260. doi: 10.1534/genetics.110.123059. [DOI] [PMC free article] [PubMed] [Google Scholar]
- Kudla G, Murray AW, Tollervey D, Plotkin JB. Coding-sequence determinants of gene expression in Escherichia coli. Science. 2009;324:255–258. doi: 10.1126/science.1170160. [DOI] [PMC free article] [PubMed] [Google Scholar]
- Lavebratt C, Sengul S. Single nucleotide polymorphism (SNP) allele frequency estimation in DNA pools using pyrosequencing. Nat Protoc. 2006;1:2573–2582. doi: 10.1038/nprot.2006.442. [DOI] [PubMed] [Google Scholar]
- Lee G, Park JH. Hemolymph sugar homeostasis and starvation-induced hyperactivity affected by genetic manipulations of the adipokinetic hormone-encoding gene in Drosophila melanogaster. Genetics. 2004;167:311–323. doi: 10.1534/genetics.167.1.311. [DOI] [PMC free article] [PubMed] [Google Scholar]
- Liti G, Carter DM, Moses AM, Warringer J, Parts L, James SA, Davey RP, Roberts IN, Burt A, Koufopanou V, et al. Population genomics of domestic and wild yeasts. Nature. 2009;458:337–341. doi: 10.1038/nature07743. [DOI] [PMC free article] [PubMed] [Google Scholar]
- Lu Y, Rausher MD. Evolutionary rate variation in anthocyanin pathway genes. Mol Biol Evol. 2003;20:1844–1853. doi: 10.1093/molbev/msg197. [DOI] [PubMed] [Google Scholar]
- MacIntyre RJ, Davis MB. A genetic and molecular analysis of the alpha glycerophosphate cycle in Drosophila melanogaster. Isozymes Curr Top Biol Med Res. 1987;14:195–227. [PubMed] [Google Scholar]
- Mackay TFC, Richards S, Stone EA, Barbadilla A, Ayroles JF, Zhu D, Casillas S, Han Y, Magwire MM, Cridland JM, et al. The Drosophila melanogaster genetic reference panel. Nature. 2012;482:173–178. doi: 10.1038/nature10811. [DOI] [PMC free article] [PubMed] [Google Scholar]
- Marden JH. Nature’s inordinate fondness for metabolic enzymes: why metabolic enzyme loci are so frequently targets of selection. Mol Ecol. 2013;22:5743–5764. doi: 10.1111/mec.12534. [DOI] [PubMed] [Google Scholar]
- Massouras A, Waszak SM, Albarca-Aguilera M, Hens K, Holcombe W, Ayroles JF, Dermitzakis ET, Stone EA, Jensen JD, Mackay TF, et al. Genomic variation and its impact on gene expression in Drosophila melanogaster. PLoS Genet. 2012;8:e1003055. doi: 10.1371/journal.pgen.1003055. [DOI] [PMC free article] [PubMed] [Google Scholar]
- Matschinsky FM. Glucokinase, glucose homeostasis, and diabetes mellitus. Curr Diab Rep. 2005;5:171–176. doi: 10.1007/s11892-005-0005-4. [DOI] [PubMed] [Google Scholar]
- Matschinsky FM, Magnuson MA, Zelent D, Jetton TL, Doliba N, Han Y, Taub R, Grimsby J. The network of glucokinase-expressing cells in glucose homeostasis and the potential of glucokinase activators for diabetes therapy. Diabetes. 2006;55:1–12. [PubMed] [Google Scholar]
- Merritt TJ, Duvernell D, Eanes WF. Natural and synthetic alleles provide complementary insights into the nature of selection acting on the Men polymorphism of Drosophila melanogaster. Genetics. 2005;171:1707–1718. doi: 10.1534/genetics.105.048249. [DOI] [PMC free article] [PubMed] [Google Scholar]
- Moore B, Zhou L, Rolland F, Hall Q, Cheng WH, Liu YX, Hwang I, Jones T, Sheen J. Role of the Arabidopsis glucose sensor HXK1 in nutrient, light, and hormonal signaling. Science. 2003;300:332–336. doi: 10.1126/science.1080585. [DOI] [PubMed] [Google Scholar]
- Nassel DR, Winther AME. Drosophila neuropeptides in regulation of physiology and behavior. Prog Neurobiol. 2010;92:42–104. doi: 10.1016/j.pneurobio.2010.04.010. [DOI] [PubMed] [Google Scholar]
- O'Brien SJ, MacIntyre RJ. The α-glycerophosphate cycle in Drosophila melanogaster. I. Biochemical and developmental aspects. Biochem Genet. 1972;7:141–161. doi: 10.1007/BF00486085. [DOI] [PubMed] [Google Scholar]
- Obbard DJ, Welch JJ, Kim KW, Jiggins FM. Quantifying adaptive evolution in the Drosophila immune system. PLoS Genet. 2009;5:e1000698. doi: 10.1371/journal.pgen.1000698. [DOI] [PMC free article] [PubMed] [Google Scholar]
- Olson-Manning CF, Lee CR, Rausher MD, Mitchell-Olds T. Evolution of flux control in the glucosinolate pathway in Arabidopsis thaliana. Mol Biol Evol. 2013;30:14–23. doi: 10.1093/molbev/mss204. [DOI] [PMC free article] [PubMed] [Google Scholar]
- Place AR, Powers DA. Genetic variation and relative catalytic efficencies: lactate dehtdrogenase-B allozymes of Fundulus heteroclitus. Proc Natl Acad Sci U S A. 1979;76:2354–2358. doi: 10.1073/pnas.76.5.2354. [DOI] [PMC free article] [PubMed] [Google Scholar]
- Ramsay H, Rieseberg LH, Ritland K. The correlation of evolutionary rate with pathway position in plant terpenoid biosynthesis. Mol Biol Evol. 2009;26:1045–1053. doi: 10.1093/molbev/msp021. [DOI] [PubMed] [Google Scholar]
- Rathmell JC, Newgard CB. A glucose-to-gene link. Science. 2009;324:1021–1022. doi: 10.1126/science.1174665. [DOI] [PMC free article] [PubMed] [Google Scholar]
- Reaume CJ, Sokolowski MB. The nature of Drosophila melanogaster. Curr Biol. 2006;16:R623–R628. doi: 10.1016/j.cub.2006.07.042. [DOI] [PubMed] [Google Scholar]
- Savraj SG. Insulin/TOR signaling in growth and homeostasis: a view from the fly world. Int J Biochem Cell Biol. 2009;41:1006–1010. doi: 10.1016/j.biocel.2008.10.010. [DOI] [PubMed] [Google Scholar]
- Schnorrer F, Schonbauer C, Langer CCH, Dietzl G, Novatchkova M, Schernhuber K, Fellner M, Azaryan A, Radolf M, Stark A, et al. Systematic genetic analysis of muscle morphogenesis and function in Drosophila. Nature. 2010;464:287–291. doi: 10.1038/nature08799. [DOI] [PubMed] [Google Scholar]
- Sezgin E, Duvernell DD, Matzkin LM, Duan Y, Zhu CT, Verrelli BC, Eanes WF. Single-locus latitudinal clines and their relationship to temperate adaptation in metabolic genes and derived alleles in Drosophila melanogaster. Genetics. 2004;168:923–931. doi: 10.1534/genetics.104.027649. [DOI] [PMC free article] [PubMed] [Google Scholar]
- Shapiro JA, Huang W, Zhang C, Hubisz MJ, Lu J, Turissini DA, Fang S, Wang HY, Hudson RR, Nielsen R, et al. Adaptive genic evolution in the Drosophila genomes. Proc Natl Acad Sci U S A. 2007;104:2271–2276. doi: 10.1073/pnas.0610385104. [DOI] [PMC free article] [PubMed] [Google Scholar]
- Shpak M, Wakeley J, Garrigan D, Lewontin RC. A structured coalescent process for seasonally fluctuating populations. Evolution. 2010;64:1395–1409. doi: 10.1111/j.1558-5646.2009.00891.x. [DOI] [PubMed] [Google Scholar]
- Smith NG, Eyre-Walker A. Adaptive protein evolution in Drosophila. Nature. 2002;415:1022–1024. doi: 10.1038/4151022a. [DOI] [PubMed] [Google Scholar]
- Sokal RR, Rohlf FJ. Biometry. New York: Freeman; 1981. [Google Scholar]
- Stanley CA. Hyperinsulinism/hyperammonemia syndrome: insights into the regulatory role of glutamate dehydrogenase in ammonia metabolism. Mol Gene Metabol. 2004;81:45–51. doi: 10.1016/j.ymgme.2003.10.013. [DOI] [PubMed] [Google Scholar]
- Storey JD, Tibshirani R. Statistical significance for genomewide studies. Proc Natl Acad Sci U S A. 2003;100:9440–9445. doi: 10.1073/pnas.1530509100. [DOI] [PMC free article] [PubMed] [Google Scholar]
- Stranger BE, Forrest MS, Dunning M, Ingle CE, Beazley C, Thorne N, Redon R, Bird CP, de Grassi A, Lee C, et al. Relative impact of nucleotide and copy number variation on gene expression phenotypes. Science. 2007;315:848–853. doi: 10.1126/science.1136678. [DOI] [PMC free article] [PubMed] [Google Scholar]
- Taguchi A, White MF. Insulin-like signaling, nutrient homeostasis, and life span. Annu Rev Physiol. 2008;70:191–212. doi: 10.1146/annurev.physiol.70.113006.100533. [DOI] [PubMed] [Google Scholar]
- Toivonen JM, Partridge L. Endocrine regulation of aging and reproduction in Drosophila. Mol Cell Endocrinol. 2008;299:39–50. doi: 10.1016/j.mce.2008.07.005. [DOI] [PubMed] [Google Scholar]
- Vishnoi A, Sethupathy P, Simola D, Plotkin JB, Hannenhalli S. Genome-wide survey of natural selection on functional, structural, and network properties of polymorphic sites in Saccharomyces paradoxus. Mol Biol Evol. 2011;28:2615–2627. doi: 10.1093/molbev/msr085. [DOI] [PMC free article] [PubMed] [Google Scholar]
- Wagner A, Fell DA. The small world inside large metabolic networks. Proc R Soc Lond B Biol Sci. 2001;268:1803–1810. doi: 10.1098/rspb.2001.1711. [DOI] [PMC free article] [PubMed] [Google Scholar]
- Wellen KE, Hatzivassiliou G, Sachdeva UM, Bui TV, Cross JR, Thompson CB. ATP-citrate lyase links cellular metabolism to histone acetylation. Science. 2009;324:1076–1080. doi: 10.1126/science.1164097. [DOI] [PMC free article] [PubMed] [Google Scholar]
- Whitehead A, Crawford DL. Neutral and adaptive variation in gene expression. Proc Natl Acad Sci U S A. 2006;103:5425–5430. doi: 10.1073/pnas.0507648103. [DOI] [PMC free article] [PubMed] [Google Scholar]
- Wiederkehr A, Wollheim CB. Minireview: implication of mitochondria in insulin secretion and action. Endocrinology. 2006;147:2643–2649. doi: 10.1210/en.2006-0057. [DOI] [PubMed] [Google Scholar]
- Wright KM, Rausher MD. The evolution of control and distribution of adaptive mutations in a metabolic pathway. Genetics. 2010;184:483–502. doi: 10.1534/genetics.109.110411. [DOI] [PMC free article] [PubMed] [Google Scholar]
- Xiong Y, McCormack M, Li L, Hall Q, Xiang CB, Sheen J. Glucose-TOR signalling reprograms the transcriptome and activates meristems. Nature. 2013;496:181–187. doi: 10.1038/nature12030. [DOI] [PMC free article] [PubMed] [Google Scholar]
- Zera AJ. Microevolution of intermediary metabolism: evolutionary genetics meets metabolic biochemistry. J Exp Biol. 2011;214:179–190. doi: 10.1242/jeb.046912. [DOI] [PubMed] [Google Scholar]
- Zhu CT, Rand DM. A hydrazine coupled cycling assay validates the decrease in redox ratio under starvation in Drosophila. PLoS One. 2012;7:e47584. doi: 10.1371/journal.pone.0047584. [DOI] [PMC free article] [PubMed] [Google Scholar]
Associated Data
This section collects any data citations, data availability statements, or supplementary materials included in this article.