

Abstract
B cell receptor (BCR) signalling plays a critical role in the progression of several B-cell malignancies, but its role in hairy cell leukaemia (HCL) is ambiguous. Bruton tyrosine kinase (BTK), a key player in BCR signalling, migration and adhesion, can be targeted with ibrutinib, a selective, irreversible BTK inhibitor. We analysed BTK expression and function in HCL and analysed the effects of ibrutinib on HCL cells. We demonstrated uniform BTK protein expression in HCL cells. Ibrutinib significantly inhibited HCL proliferation and cell cycle progression. Accordingly, ibrutinib also reduced HCL cell survival after BCR triggering with anti-immunoglobulins (A, G, and M) and abrogated the activation of kinases downstream of the BCR (PI3K and MAPK). Ibrutinib also inhibited BCR-dependent secretion of the chemokines CCL3 and CCL4 by HCL cells. Interestingly, ibrutinib inhibited CXCL12-induced signalling, a key pathway for bone marrow homing. Collectively, our data support the clinical development of ibrutinib in patients with HCL.
Keywords: Hairy Cell Leukaemia (HCL), B cell receptor (BCR), microenvironment, BTK, ibrutinib
Introduction
Hairy cell leukaemia (HCL) is an indolent B-cell malignancy, characterized by marked splenomegaly and progressive pancytopenia. The incidence of HCL is about 1,000 new cases per year in the USA, comprising about 2% of all leukaemias (Siegel, et al 2012), and affecting mainly the male gender (male: female ratio 4:1, median age 55-56 years). HCL cells display “hairy” cytoplasmic projections and a unique immunophenotype. They typically infiltrate the bone marrow and spleen, but rarely the lymph nodes (Forconi, et al 2005, Swerdlow et al 2008). HCL can be classified into two subgroups, the more common classic HCL (HCLc) and variant HCL (HCLv, ∼10% of HCL patients). HCLv is classified by the World Health Organization as ‘splenic lymphoma/leukaemia unclassifiable’, and distinct from HCLc. Cases of HCLc typically express the B cell antigens FMC7, CD11c, CD20, CD22, and surface immunoglobulin (Ig), along with CD103, CD25, and CD123(Matutes 2006, Swerdlow et al 2008) HCLc is exquisitely sensitive to the purine nucleoside analogues cladribine and pentostatin. In contrast, HCLv is characterized by lack of CD25, annexin A1 (ANXA1), and/or tartrate-resistant acid phosphatase (TRAP), and inferior response to purine nucleoside analogues (Robak 2011, Swerdlow et al 2008). Whole-exome sequencing identified the v-raf murine sarcoma viral oncogene homolog B1 (BRAF) V600E mutation as a disease-defining genetic event for HCLc (Tiacci, et al 2011), however BRAF mutations are absent in HCLv and in HCLc cases associated with use of the IGHV4-34 gene (Xi, et al 2012). The BRAF mutation results in constitutive activation of signalling pathways, such as the mitogen-activated protein kinase (MAPK) pathway, which can be targeted with BRAF inhibitors (Dietrich, et al 2012). Currently, standard treatment with cladribine or pentostatin, alone or in combination with rituximab, leads to remission in the vast majority of HCLc patients, with complete remission rates ranging between 70 and 95% (Ravandi, et al 2011). However, there is a lack of plateau on disease-free survival curves, and most treated patients eventually relapse (Else, et al 2009). Additionally, HCL patients treated repetitively with purine analogues may become resistant, as indicated by lower response rates and shorter relapse free survival in the salvage setting. Purine analogues also are toxic to normal haematopoietic cells, with a significant impairment in the T cell compartment, particularly a long-lasting depletion of CD4+ cells, rendering patients prone to opportunistic infections. Therefore, novel therapeutic approaches for HCL, especially for relapsed HCL patients, are needed.
B cell receptor (BCR) signalling is involved in the pathogenesis of several B-cell malignancies, and can be blocked with inhibitors targeting kinases downstream of the BCR. Upon antigen binding, or in a ligand-independent fashion (tonic BCR signalling), BCR signalling activates a cascade of signalling events that promote B cell growth, proliferation and survival. Bruton tyrosine kinase (BTK), a member of the Tec kinase family, is a central player in BCR signalling. Mutations in BTK with a loss of function are the genetic basis for X-linked agammaglobulinaemia (XLA), a primary immunodeficiency characterized by absence of mature B cells and immunoglobulins, causing recurrent opportunistic infections. Upstream kinases LYN and SYK recruit BTK into a signalling complex via docking of its pleckstrin homology domain to PIP3, before activating downstream calcium release and NFkB activation. Besides its prominent role in BCR signalling, BTK is also involved in the signalling of chemokine receptors and adhesion molecules in normal (de Gorter, et al 2007, Spaargaren, et al 2003) and malignant (de Rooij, et al 2012, Ponader, et al 2012) B cells. Ibrutinib (previously called PCI-32765) is an orally bioavailable, selective, irreversible BTK inhibitor (50% inhibitory concentration [IC50] = 0.5 nM), which covalently binds to a cysteine residue (Cys-481) in the BTK kinase domain (Burger and Buggy 2013, Honigberg, et al 2010). Ibrutinib inhibits survival and proliferation of chronic lymphocytic leukaemia (CLL) cells in vitro (Herman, et al 2011, Ponader, et al 2012) and in a CLL mouse model (Ponader, et al 2012). Additionally, ibrutinib antagonized the migration of CLL cells towards the chemokines CXCL12 and CXCL13 and decreased adhesion to fibronectin and VCAM1 (de Rooij, et al 2012, Ponader, et al 2012). Clinical studies of ibrutinib demonstrated highly encouraging results in patients with B cell non-Hodgkin lymphoma, especially in patients with CLL and MCL (Advani, et al 2013) The importance of BCR signalling in HCL pathogenesis has not been well characterized, and targeting of BCR signalling in HCL has not been explored. Therefore, we examined the activity of ibrutinib in BCR signalling in HCL.
Material and Methods
Patient samples, cell lines and reagents
Peripheral blood samples were obtained from patients fulfilling clinical and immunophenotypic criteria for HCL at National Cancer Institutes (NCI) of Health, Bethesda, MD after informed consent obtained by the NCI Investigator's Review Board in accordance with the Declaration of Helsinki. Twenty-one patients' samples (HCL1 - HCL21) with a high percentage of leukaemic cells were selected for the experiments. Viability of the frozen HCL samples was assessed by propidium iodide (PI) and 3,3′-dihexyloxacarbocyanine iodide (DiOC6) staining; only samples with high viabilities were selected for the assays. Supplemental Table 1 and Supplemental figure 1 summarize the percentage of CD19+, CD103+ and CD11c+ cells and viabilities in the patients' samples. Patients' characteristics are summarized in Table I and Supplemental Table 2. Presence of BRAF V600E mutation was found in 9 HCL samples, by DNA amplification and targeted pyrosequencing; in 10 cases only the wild type (WT) BRAF was detected as previously described (Arons, et al 2009). The HCL cell lines ESKOL and HC-1 were purchased from the German Collection of Microorganisms and Cell Cultures GmbH (DSMZ, Braunschweig, Germany) and were grown in RPMI 1640 medium (Hyclone, Logan, UT) supplemented with 2 mM L-glutamine, 100 u/ml penicillin, 100 μg/ml streptomycin (CellGro, Manassas, VA) and 10% or 20% fetal bovine serum (FBS, Hyclone) respectively. Ibrutinib (PCI-32765) was provided by Pharmacyclics Inc. (Sunnyvale, CA), dissolved in dimethylsulfoxide (DMSO) at 100 mM, and stored at −20°C until use.
Table I.
Clinical characteristic of the patients.
| Patient (HCL) | Gender | Age (years) | Diagnosis | BRAF mutation | IGHV gene | Mutational status |
|---|---|---|---|---|---|---|
| 1 | Male | 57 | HCLv | WT | IGHV4-34 | Unmutated |
| 2 | Female | 72 | HCLc | NA | IGHV1-2 | Mutated |
| 3 | Male | 76 | HCLc | V600E | IGHV3-33 | Mutated |
| 4 | Male | 73 | HCLc | V600E | IGHV1-2 | Mutated |
| 5 | Male | 81 | HCLc | WT | IGHV4-34 | Unmutated |
| 6 | Male | 63 | HCLv | NA | IGHV4-34 | Unmutated |
| 7 | Male | 72 | HCLc | WT | IGHV4-34 | Unmutated |
| 8 | Male | 30 | HCLc | WT | IGHV2-70 | Mutated |
| 9 | Male | 51 | HCLc | V600E | IGHV5-a | Mutated |
| 10 | Male | 44 | HCLc | V600E | IGHV4-39 | Mutated |
| 11 | Male | 47 | HCLv | WT | IGHV4-31 | Mutated |
| 12 | Male | 60 | HCLc | WT | IGHV4-34 | Unmutated |
| 13 | Male | 60 | HCLc | V600E | IGHV3-30 | Mutated |
| 14 | Male | 68 | HCLv | WT | IGHV4-4 | Unmutated |
| 15 | Male | 74 | HCLv | WT | IGHV1-8 | Mutated |
| 16 | Male | 74 | HCLc | V600E | IGHV3-23 | Mutated |
| 17 | Female | 75 | HCLv | WT | IGHV1-46 | Mutated |
| 18 | Female | 73 | HCLc | V600E | NA | NA |
| 19 | Male | 60 | HCLc | V600E | NA | NA |
| 20 | Male | 61 | HCLc | V600E | IGHV1-2 | Mutated |
| 21 | Female | 71 | HCLv | WT | IGHV3-33 | Unmutated |
Abbreviations: HCL, hairy cell leukaemia; HCLc, classic HCL; HCLv, variant HCL; WT, wild type; NA, not analysed.
Immunoblotting
Primary HCL cells and HCL cell lines (ESKOL and HC-1) were starved in RPMI medium with 0.5% bovine serum albumin (BSA, Sigma, St. Louis, MO) for 2 h at 37°C, incubated with 0.1 μM, 0.5 μM and 1 μM ibrutinib for 1 h at 37°C, and stimulated for 10 min at 37°C with 10 μg/ml anti-IgA + anti-IgG + anti-IgM (H+L) (goat affiniPure F(ab′)2 fragments; Jackson Immuno-Research Laboratories, West Grove, PA), for the patient samples indicated in the relevant figure legends or 250 ng/ml SDF-1/CXCL12 (R&D, Minneapolis, MN), (Samples HCL14 to HCL16). Cells then were washed with ice-cold phosphate-buffered saline (PBS) and lysed for 30 min on ice with radioimmunoprecipitate assay (RIPA) buffer containing 150 mM NaCl, 1% Triton X-100, 0.5% sodium deoxycholate, 0.1% sodium dodecyl sulfate (SDS), 50 mM Tris-HCl, one mini complete protease inhibitor tablet and one phosphostop tablet (Roche Applied Sciences, Indianapolis, IN) per 10 ml of buffer. Then cells were sonicated for 15 min and centrifuged at 12,000 rpm for 10 min at 4°C, and lysates were stored at −80°C until further use. Protein concentration was measured using the DC protein assay (Bio-Rad, Hercules, CA) following the manufactures instructions. Total protein (30 μg) was boiled with NuPAGE LDS sample buffer (Invitrogen, Life Technologies, Grand Island, NY), loaded onto 4 - 12% SDS-polyacrylamide gels (Invitrogen), and then transferred to polyvinylidene difluoride (PVDF) membranes (EMD Millipore, Billerica, MA) at 100V for 1 h, then membranes were blocked for one hour with BSA 1% in PBS-T (Tween 0.01%), and subsequently incubated with primary antibodies either overnight at 4°C or 2 h at room temperature, with the following antibodies: AKT, phosphor-AKT (Ser473), ERK/p44/42 MAP kinase, phosphor-ERK (Thr202/Tyr204), BTK, phospho-BTK (Y223) and GAPDH as a loading control. The phospho BTK antibody was purchased from Abcam (Cambridge, MA), all the other antibodies were purchased from Cell Signaling Technology (Danvers, MA). The membranes were then incubated with species-specific horseradish peroxidase (HRP)-conjugated secondary antibodies for 1 h at room temperature, followed by incubation with SuperSignal West Pico chemiluminiscent substrate (Thermo Scientific, Pittsburgh, PA) for 5 min or Luminata Western HRP substrate (EMD Millipore) for the phosphorylated antibodies. Measurement of the band intensity by densitometry was performed using the software Image J (Version 1.47, NIH).
Cell growth, proliferation assay and cell cycle
For cell growth curves, 8×10⁴ cells (ESKOL and HC-1) were plated in RPMI 1640 + 10% FBS in 12-well tissue culture plates (Techno Plastic Products, Trasadingen, Switzerland) and incubated with ibrutinib at 0.5 μM, 1 μM and 5 μM in triplicates. Cell counts on a live gate (Forward Scatter-FSC vs. Side Scatter–SSC) were measured after 24, 48, 72 and 96 h by flow cytometry on a FACSCalibur (BD Biosciences, San Jose, CA) for 20 seconds at 60 μL/min. Cell proliferation in HCL cell lines, was assessed using XTT assays according to the manufacturer's instructions (TACS XTT, Trevigen, Gaithersburg, MD). Briefly, 5×10⁴ cells were incubated in RPMI 1640 without phenol red + 10% FBS in 48 well tissue culture plates with ibrutinib at 0.5 μM, 1 μM, 2 μM, 3 μM, 4 μM, 5 μM in triplicates for 48 and 72 h. At the indicated time points, 100-μl aliquots were transferred to a 96-well plate and then incubated for 5 h at 37°C with the yellow tetrazolium salt, which is cleaved to orange formazan dye. Absorbance values were obtained at 490 nm with a reference correction at 630 nm in a microplate reader ELx808 (BioTeK Instruments, Winooski, VT). Cell cycle analysis was evaluated by the incorporation of bromodeoxyuridine (BrdU) and 7-aminoactinomycin D (7-AAD) (APC BrdU flow kit; BD Pharmingen, San Jose, CA) and subsequent analysis on a FACSCalibur flow cytometer (BD Biosciences). Briefly, 1×10⁵ cells were plated in 12-well plates and incubated with ibrutinib at 0.5 μM, 1 μM or 5 μM for 24 h, then cells were pulsed with 10 μM of BrdU for 45 min. Intracellular staining was performed following the manufacturer's instructions, by means of a 20-min incubation with anti-BrdU, after which 7-AAD solution was added to stain total DNA for cell cycle analysis.
Flow cytometry
Flow cytometric analysis was done on HCL cell suspensions (ESKOL, HC-1 and primary HCL cells: HCL1 to HCL7 and HCL9 to HCL14) stained with phycoerythrin (PE)-conjugated mouse anti-human CD184 (CXCR4), allophycocyanin (APC)-conjugated mouse anti-human CD19, and isotype control PE-conjugated mouse IgG2a,κ (BD Pharmingen). Subsequent measurement of mean fluorescence intensity (MFI) was performed on a FACSCalibur (BD Biosciences) and subsequent data analysis was carried out using Flowjo software (Version 8.8.7, TreeStar, Ashland, OR).
BTK occupancy assay
BTK occupancy testing was performed as previously described (Honigberg, et al 2010). Briefly, 5×10⁶ cells were pre-incubated with 0.0001 μM, 0.001 μM, 0.01 μM, 0.1 μM or 1 μM ibrutinib for 1 h, then cells were lysed and labelled with 2 μM of a fluorescence-tagged derivative of ibrutinib (probe PCI-33380) for 1 h at 37°C and analysed by SDS polyacrylamide gel electrophoresis (SDS-PAGE) and fluorescence gel scanning using a Typhoon scanner. The gel was then blotted, and total BTK levels were determined by standard immunoblotting. Control B cell lymphoma DOHH2 cell lysates were labelled with probe at 100% and 10% and analysed by SDS/PAGE in the same gel.
Cell viability testing and chemokine quantification
To evaluate the effects of the ibrutinib on HCL cell viability, 5 × 10⁶ primary HCL cells were incubated in RPMI 1640 medium supplemented with 10% FBS for 24 and 48 h with 10 μg/ml anti-IgA/IgG/IgM (H+L, Jackson ImmunoResearch Laboratories) in 24-well tissue culture plates (Techno Plastic Products) after pre-incubation for one hour with 0.5 μM, 1 μM or 5 μM ibrutinib or DMSO control. At the indicated time points, cells were collected and cell viability measured by analysis of mitochondrial transmembrane potential by DiOC6 (Invitrogen, Molecular Probes) as previously described(Burger, et al 2000). Briefly, aliquots of 100 μl cell suspension were transferred to FACS tubes containing 300 μl of 60 nM DiOC6 and 2 μg/ml PI in RPMI medium with 0.5% BSA. Cells were incubated in the dark for 20 min at 37°C and then 10 min at room temperature, followed by flow cytometric analysis on a FACSCalibur (BD Biosciences). In order to measure the effect of ibrutinib on CCL3 and CCL4 secretion, supernatants were collected at the above indicated time points and chemokines levels were measured by quantitative enzyme-linked immunoabsorbent assays (ELISAs) according to the manufacturer's instructions (Quantikine, R&D Systems, Minneapolis, MN), as described(Burger, et al 2009).
Data analysis and statistics
Results are shown as mean ± standard error of the mean (SEM) of at least 3 experiments. Statistical analysis was performed using GraphPad Prism 6.0 for Macintosh (GraphPad Software, San Diego, CA). For the analysis of the paired or unpaired samples, 2-tailed Student t test was used to determine the significance of the differences between two means, and the p values assigned as follows (*p < 0.05; **p <0.01; ***p <0.001). Flow cytometry data were analysed using FlowJo 8.8.7 software (TreeStar).
Results
BTK is expressed in hairy cell leukaemia
We investigated the expression levels of total and activated BTK protein in primary HCL cells. BTK is phosphorylated at Y551 in the activation loop by SRC family kinases and subsequently autophosphorylated at Y223, causing full kinase activation. We detected expression of total and phosphorylated (pBTK, BTK Y223) BTK in 9 HCL patients' samples. Activated (pBTK) BTK levels increased upon BCR triggering with anti IgA/IgG/IgM and were decreased when the samples were pre-incubated with ibrutinib at 0.1 μM, 0.5 μM or 1μM (Figure 1A and Supplemental Figure 2). This demonstrates that ibrutinib inhibits BTK phosphorylation after BCR stimulation. Interestingly, we also noted constitutive BTK phosphorylation in the primary HCL samples. In order to determine the effects of ibrutinib on BTK occupancy, we used a fluorescent-labelled probe (PCI-33380). As shown in Figure 1B, the active site of BTK was fully occupied with ibrutinib concentrations as low as 10 nM. Therefore, we can conclude that the low concentrations of ibrutinib used in our in vitro experiments effectively inhibited BTK activity by occupation of the ATP binding site.
Figure 1. Ibrutinib reduces phosphorylated BTK expression upon BCR stimulation in HCL cells.
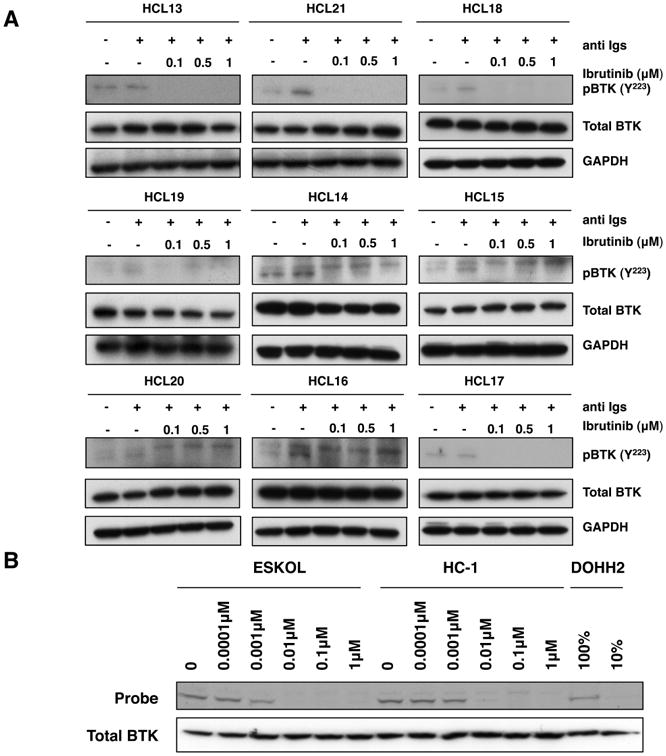
(A) Immunoblots from 9 primary HCL cells, which were stimulated for 10 min with 10 μg/ml of anti Igs (anti IgA, anti IgG and anti IgM) in the presence or absence of 0.1 μM, 0.5 μM or 1 μM ibrutinib, as indicated. P indicates immunobloting for the active phosphorylated form of BTK (lower band). GAPDH was using as a loading control. (B) Occupancy test, assessed by the ability of BTK to bind to the fluorescence labelled probe (PCI-33380) in the presence of dose escalation of ibrutinib in the HCL cell lines, ESKOL and HC-1. Total BTK levels were determined by immunobloting. DOHH2 cell line lysates labelled with probe (100% and 10%) were used as a control.
Ibrutinib inhibits cell growth and proliferation in HCL cell lines
Cell growth of HCL cells lines was significantly inhibited by ibrutinib in a dose-dependent manner (Figure 2A). For example, after 72 h, HCL cell counts (ESKOL) decreased from 0.57 ± 0.02 ×10⁹ to 0.41 ± 0.007 × 10⁹ cells/l in the presence of 0.5 μM ibrutinib (28% decrease); to 0.37 ± 0.01 ×10⁹ cells/l with 1 μM ibrutinib (35% decrease) and to 0.24 ± 0.02 ×10⁹ cells/l with 5 μM ibrutinib (58% decrease, mean ± SEM, p<0.01, n=3). After 96 h, HCL cell counts were 0.83 ± 0.06 ×10⁹ cells/l for untreated control cells, 0.54 ± 0.03 ×10⁹ cells/l in the presence of 0.5 μM ibrutinib (35% decrease), 0.49 ± 0.01 ×10⁹ cells/l in the presence of 1 μM ibrutinib (41% decrease) and 0.24 ± 0.03 ×10⁹ cells/l with 5 μM ibrutinib (71% decrease; mean ± SEM, p<0.01, n=3). Similar degrees of growth inhibition were noted with HC-1 cells. Inhibition of HCL cell proliferation by ibrutinib was confirmed in XTT assays (Figure 2B). HCL metabolic activity in the XTT assay was decreased to 62.6 ± 2.2% in comparison to the untreated controls (100%) with 0.5 μM ibrutinib, to 54.2 ± 6.6% with 1 μM ibrutinib, to 43.8 ± 11.3% with 2 μM ibrutinib, to 45.5 ± 5.2% with 3 μM ibrutinib, to 43.3 ± 6.4% with 4 μM ibrutinib, and to 38.8 ± 1.1% with 5 μM ibrutinib (mean ± SEM, p<0.01, n=3). These results demonstrate dose-dependent inhibition of HCL cell proliferation by ibrutinib. Cell cycle analysis, as evaluated by incorporation of BrdU and 7-AAD in HCL cell lines (HC-1 cells: see Figure 2B, ESKOL: data not shown) demonstrated that ibrutinib caused a reduction in S-phase cells and an increase in G0/G1 in a dose dependent manner. At 48hs, the percentage of cells in S-phase for untreated HCL cells was 28.5 ± 6.7%, which was reduced to 17.3 ± 5.4% with 0.5 μM ibrutinib (39% reduction), to 16.6 ± 4.3% with 1 μM ibrutinib (42% reduction), and to 14.1 ± 0.5% with 5 μM ibrutinib (50% reduction; mean ± SEM, p<0.01, n=3). Taken together, these findings indicate that ibrutinib treatment results in significantly inhibition of HCL cell growth and proliferation.
Figure 2. Ibrutinib inhibits cell growth and proliferation and reduces the percentage of cells in S-phase in a dose-dependent manner.

(A) Cell growth curves for untreated HCL cell lines ESKOL (left) and HC-1 (right), indicated as the control, and treated with ibrutinib (0.5 μM, 1 μM or 5 μM); at the indicated time points, cells were counted by flow cytometry, the graphs represent the mean and SEM, as indicated by the lines and error bars with ** as p<0.01 (n=3). (B) Left-hand graph depicts the effect of ibrutinib on the proliferation of HCL cell lines, ESKOL (black bars) and HC-1 (grey bars), using dose escalation, as assessed by XTT assay after 72 h of incubation., bar diagrams represent the mean ± SEM of 3 independent experiments with ** as p<0.01. The right-hand graph shows the percentage of cell cycle phase distribution, assessed by BrdU and 7-AAD incorporation, in the HC-1 cell line after 48 h of incubation with ibrutinib (0.5 μM, 1 μM or 5 μM), untreated cells are indicated as a control. The bars represent the mean of the percentage of cells in G0/G1 (lighter grey) S-phase (grey) and G2/M (darker grey) (n=3).
Ibrutinib reduces HCL cell survival
BCR triggering with anti-Ig (anti IgA/IgG/IgM) increases HCL cell viability to 110.7 ± 5.2% at 24 h and to 126.7 ± 16.2% at 48 h, when compared to control HCL cells (mean ± SEM, n=8; see Figure 3B). Figure 3A displays a representative case, in which BCR stimulation increased cell survival was reduced in the presence of ibrutinib in a dose dependent manner from 53.4% to 41.5% after 48hs. Figure 3B summarized the results of 8 different HCL samples, here we found a significantly reduction in HCL viability after 24 and 48hs of incubation; For example, after 48hs, preincubation with 0.5 μM ibrutinib before BCR stimulation, significantly reduced HCL cell viability to 83.4 ± 5.1%, 1 μM ibrutinib to 83.1 ± 5.4%, 5 μM ibrutinib to 76.7 ± 6.4% of unstimulated controls (mean ± SEM, p<0.01, n=8). These data were corroborated by XTT assays, performed in parallel, which demonstrated significant inhibition of anti-Ig induced metabolic activity. For example, after 48 h of incubation, 0.5 μM ibrutinib decreased XTT activity to 62.0 ± 10.4% (in comparison with untreated controls), with 1 μM ibrutinib to 63.7 ± 10.3%, and with 5 μM ibrutinib to 66.8 ± 14.7% of respective controls (mean ± SEM, p<0.01, n=5). Similar results were obtained with a different set of 5 HCL patients' samples using lower concentrations of ibrutinib (0.0001 μM, 0.001 μM, 0.01 μM, 0.1 μM, 0.5 μM and 1 μM) and viability assessed at 24 h (Supplemental Figure 3A and 3B). For example, pre-incubation with 0.001 μM ibrutinib reduced HCL cell viability to 95.8 ± 2.1%, 0.01 μM of ibrutinib to 91.8 ± 2.3%, 0.1 μM of ibrutinib to 90.7 ± 3.1%, 0.5 μM of ibrutinib to 93.5 ± 2.4% and 1 μM of ibrutinib to 94.6 ± 2.7% of stimulated control (mean ± SEM, p<0.05, n=5). These results indicate that ibrutinib antagonizes HCL survival signals delivered through the BCR pathways. In comparison to primary HCL cells, the viability of HCL cell lines (ESKOL and HC-1) was less sensitive to ibrutinib (Figure 3B), but significant reductions in viability were still seen. For example, at 48 h of incubation, the proportion of viable cells treated with 0.5 μM ibrutinib was 95.0 ± 1.2 %, it was 89.5 ± 3.0 % with 1 μM ibrutinib, and 75.8 ± 2.9 % with 5 μM ibrutinib (mean ± SEM, p<0.05, n=3).
Figure 3. BCR-induced cell survival signalling in HCL cells is decreased after treatment with ibrutinib.

(A) Contour plots of a representative case, showing HCL cell viabilities after 48 h of incubation with anti Igs (anti IgA, anti IgG and anti IgM), following incubation for 1 h with ibrutinib (0.5 μM, 1 μM or 5 μM), as indicated below the plots. The gates in each plot highlight the viable cell population, defined as DiOC6 positive and PI negative. (B) The left-hand graph represents the mean relative HCL cell viabilities after 24 and 48 h of incubation with anti Igs in the presence or absence of ibrutinib (indicated as control); the right-hand graph shows the XTT assay performed in parallel; results were normalized relative to the untrea1ted controls samples (100%). Displayed are the mean ± SEM, with ** as p<0.01 (n=8). (C) The bar diagrams represent the mean relative viabilities of the HCL cell lines, ESKOL (on the left) and HC-1 (on the right), incubated for 24, 48 and 72 h with medium alone, indicated as control or ibrutinib (0.5 μM, 1 μM and 5 μM). Viabilities in treated samples were normalized to the viabilities in the controls (100%) at their respective time points. The bars represent the mean ± SEM; * p<0.05; ** p<0.01 (n=3).
Ibrutinib inhibits a BCR signalling and BCR-induced secretion of CCL3 and CCL4
Upon BCR ligation, BTK can activate downstream pathways that promote survival, such as the PI3K and MAPK pathways. To determine whether signalling downstream of BTK plays such a role in HCL, we tested for BTK, AKT and ERK/p44/42 MAP kinase activation in 9 HCL primary cells after BCR triggering with anti-Igs. Levels of the phosphorylated-proteins (pBTK, pERK and pAKT) increased after BCR stimulation (Figure 4A, Supplemental Figure 4A, B). This activation was inhibited by pre-treatment with 0.1 μM, 0.5 μM and 1 μM ibrutinib, suggesting that ibrutinib can interfere with activation of the PI3K and MAPK pathways after BCR triggering. A further analysis was performed to study if presence of the BRAF V600E mutation in primary HCL samples influences responses following BCR activation and therefore a possible impact to the inhibition seen with ibrutinib (Supplemental Figure 5A); Interesting mean relative phosphorylated protein levels after BCR engagement were higher in cases where BRAF V600E mutation was detected, however, the inhibition after pre-treatment with ibrutinib was more pronounced in wild type BRAF cases. A similar analysis was performed between IGHV mutated and unmutated cases; a trend could be seen with higher pBTK and pAKT relative protein levels in the IGHV mutated cases. Whether this preliminary results in BCR response between both groups of patients is consistently observed awaits further study with a larger cohort of patients.
Figure 4. Ibrutinib down-regulates BCR signalling and inhibits the secretion of the chemokines CCL3 and CCL4 in HCL cells.

(A) Immunoblots from HCL primary cells (HCL13, HCL21 and HCL18) stimulated with anti Igs (anti IgA, anti IgG and anti IgM) for BCR triggering in the presence or absence of 0.1 μM, 0.5 μM or 1 μM ibrutinib, as indicated. P indicates immunoblots for the active phosphorylated form. GAPDH was used as a protein loading control. (B) The concentration of the chemokines CCL3 and CCL4 secreted in the supernatants of primary hairy cells was measured after BCR stimulation with anti Igs (anti IgA, anti IgG and anti IgM) in the presence or absence of ibrutinib as indicated, after 48 h of incubation. The bars represent the mean ± SEM (n=8) for CCL3 (left) and CCL4 (right).
CCL3 and CCL4 are secreted by normal and CLL B cells in response to BCR activation, and levels of these chemokines in B cell supernatants correlate with the signalling capacity of the BCR(Burger, et al 2009, Quiroga, et al 2009). Concentrations of CCL3 and CCL4 in primary HCL cell supernatants significantly increased after BCR stimulation, to 538.4 ± 253.4 pg/ml for CCL3 and to 637.4 ± 265.8 pg/ml for CCL4 when compared to unstimulated controls (CCL3: 84.3 ± 43.4 pg/ml; CCL4: 106.5 ± 47.4 pg/ml, mean ± SEM, n=8 p<0.05) (Figure 4B), demonstrating secretion of these chemokines by HCL cells in response to BCR activation. Pre-treatment of HCL cells with ibrutinib decreased BCR-induced CCL3 levels significantly, to 201.2 ± 98.5 pg/ml (0.5 μM ibrutinib), 264.5 ± 162.2 pg/ml (1 μM ibrutinib) and 235.2 ± 141.5 pg/ml (5 μM ibrutinib, mean ± SEM, n=8, p<0.5). Similarly, HCL supernatant CCL4 levels were reduced by ibrutinib to 279.2 ± 99.4 pg/ml (0.5 μM ibrutinib), 299.3 ± 129.5 pg/ml (1 μM ibrutinib) and 278.5 ± 122.4 pg/ml with 5 μM ibrutinib. Consistently higher levels of CCL3 and CCL4 after BCR engagement were found in cases where the BRAF V600E mutation was present (Supplemental Figure 5B). As depicted in Supplemental Figure 6A and 6B, lower concentrations of ibrutinib also inhibited secretion of CCL3 and CCL4 by primary HCL cells and HC-1 cell line. These results in HCL are consistent with our CLL data(Ponader, et al 2012)
Ibrutinib inhibits activation of CXCL12-induced signalling
Interactions between HCL cells and the tissue microenvironment seem to be important for the disease biology (reviewed in (Burger, et al 2011)). For example, HCL cells express high levels of the chemokine receptor CXCR4 (Durig, et al 2001, Wong and Fulcher 2004), a key factor for bone marrow homing (Burger and Kipps 2006). In normal B cells (de Gorter, et al 2007) and in CLL(de Rooij, et al 2012, Ponader, et al 2012), BTK is an important signal transmitter for CXCR4, and re-distribution of tissue B cells into the blood, one of the most striking findings during treatment of CLL patients with ibrutinib (Advani, et al 2013), is thought to be related to inhibition of BTK downstream of CXCR4 and other homing receptors. Therefore, we analysed the effects of ibrutinib on CXCR4 signalling in HCL cells. As depicted in Figure 5, HCL cells expressed relatively high levels of surface CXCR4 (CD184) when compared to CXCR4 levels on HCL lines by mean intensity florescence ratios (MIFR). The CXCR4 MIFR for ESKOL was 2.6, for HC-1 it was 2.7, and for primary HCL cells we detected a CXCR4 MFIR of 12.2 ± 2.1 (mean ± SEM, n=13). Immunoblots from HCL primary cells and HCL cell lines (Figure 5B and Supplemental Figure 7), preincubated with ibrutinib and before stimulation of CXCR4 with CXCL12, displayed a reduction of activated (phosphorylated) ERK/p42/44 MAP kinase, indicating that ibrutinib also inhibits CXCL12 signalling in HCL cells.
Figure 5. CXCR4 signalling is down-regulated by ibrutinib.
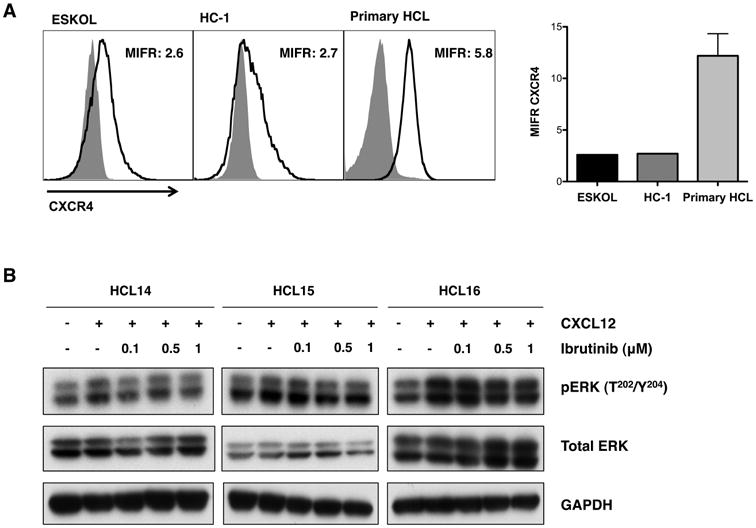
(A) Left: overlay histogram plots that depict the mean CXCR4 intensity florescence ratio (MIFR) in the HCL cell lines, ESKOL and HC-1, and CD19-gated primary cells, as indicated above the histograms. Light grey shaded area represents the corresponding isotype control and dark grey line indicates CXCR4 expression. Right: MIFR for CXCR4 for 13 primary HCL cases; the mean and SEM are indicated by the bars and error lines respectively. (B) Representive immunoblots from HCL primary cells (HCL14, HCL15 and HCL16) stimulated for 10 min with CXCL12 in the presence or absence of 0.1 μM, 0.5 μM or 1 μM ibrutinib as indicated. pERK refers to the phosphorylated form of the protein ERK. GAPDH was used as a protein loading control.
Discussion
BCR activation is key for the maintenance and expansion of mature B-cells, and growth stimulation of malignant B cells via the BCR is increasingly recognized as a key mechanism in several mature B cell malignancies, such as CLL (Chiorazzi and Efremov 2013) and diffuse large B-cell lymphoma (Davis, et al 2010). In HCL, the role of BCR signalling for disease progression is not yet well defined, although there is growing evidence that BCR signalling is of importance (Forconi, et al 2011). In this study we demonstrate that the BCR signalling pathway can be activated in HCL cells, which in turn promotes survival and proliferation of the malignant B cells, which can be inhibited by ibrutinib. BCR activation generally can be induced by antigen or can be ligand-independent (“tonic” BCR signalling), and it triggers a cascade of signalling events that normally cause B cell selection, proliferation, differentiation, and antibody production(LeBien and Tedder 2008). Thereby, BCR signalling allows for the expansion of selected, antigen-specific B cells, and deletion of unwanted, self-reactive B cells (Kuppers 2005). Evidence for BCR activation in HCL comes from analyses of the IGHV mutational status, defining that the majority of HCL cases display mutated Ig variable region genes (M-HCL)(Forconi 2011) and a restricted set of BCR with IGHV gene sequences that are identical or stereotyped in subsets of patients (Forconi, et al 2008, Ghiotto, et al 2004, Messmer, et al 2004, Tobin, et al 2003, Widhopf, et al 2004). These data suggest that such BCRs bind similar antigens that are relevant to the pathogenesis of HCL. A minority of cases is unmutated (UM-HCL)(Forconi 2011) and apparently more responsive to BCR triggering, whereas the BCR of M-HCL may be less sensitive to stimulation by antigen(Forconi 2011). The possibility of targeting signal transduction pathways activated in hairy cells by microenvironmental interactions that activate the BCR is attractive, given the limited options for HCL patients who are resistant to purine analogues. Based on the early success of BCR-related signalling inhibitors in other mature B cell malignancies(Advani, et al 2013, Friedberg, et al 2010), we therefore explored the expression and function of the BCR-associated kinase BTK and its inhibitor ibrutinib in HCL. Interestingly, and consistent with our findings, Weston-Bell et al (2013) recently reported that BCR triggering in HCL cells causes calcium mobilization and ERK 1/2 activation.
First, our study demonstrates that BTK protein expression is present in HCL cells, and that low ibrutinib concentrations induce full BTK target occupancy in HCL cells. Also, we demonstrate that HCL cell activation via the BCR results in increased levels of the tyrosine-phosphorylated activated form of BTK. Treatment with ibrutinib inhibited BCR downstream signalling, reducing levels of BCR-induced activated p44/42 MAPK and AKT. In addition, ibrutinib inhibited the proliferation and metabolism of HCL cells, suggesting that ibrutinib has a direct effect on HCL cell survival and growth. These data mirror, at least in large parts, what has been reported earlier in pre-clinical models of CLL, where ibrutinib was shown to thwart B cell survival and proliferation (Herman, et al 2011, Ponader, et al 2012), and corroborated in an adoptive transfer mouse model(Ponader, et al 2012). Another interesting and potentially clinically important finding in this study is the data related to CCL3 and CCL4. These chemokines are secreted by CLL cells in response to BCR activation (Burger, et al 2009, Quiroga, et al 2009), presumably for attraction of accessory cells, such as T cells. CCL3 and CCL4 function as biomarkers for response to treatment with the new BCR kinase inhibitors, such as ibrutinib(Ponader, et al 2012) and idelalisib(Hoellenriegel, et al 2011). Here, we report that HCL cells secreted CCL3 and CCL4 upon BCR stimulation, and that ibrutinib was very effective in abrogating BCR-dependent induction of these chemokines. These data suggest that CCL3 and CCL4 could become attractive new biomarkers in HCL, where they may indicate the degree of BCR-driven activation of the B cell clone in untreated patients, similar to what that proposed in CLL (Sivina, et al 2010), or they could function as markers for response assessment to new drugs that target BCR signalling. Prior CLL studies also highlighted another somewhat unexpected effect of BTK inhibition that is related to B cell migration and homing. Two studies consistently demonstrated that ibrutinib inhibits CLL cell migration and adhesion in response to the homing chemokines CXCL12 and CXCL13(de Rooij, et al 2012, Ponader, et al 2012). These findings explain, at least in part, the remarkable clinical response to ibrutinib therapy in CLL, which is characterized by an early, transient surge in lymphocyte counts, along with rapid decreases in lymph node sizes (Advani, et al 2013), suggesting that ibrutinib induces mobilization and/or interferes with recirculation into the tissues of CLL cells. Similar response patterns have been reported with other agents affecting BCR signalling and with glucocorticoids (Burger and Montserrat 2013, Friedberg, et al 2010, Furman, et al 2010). Our data in HCL demonstrate that ibrutinib interferes with CXCR4 signalling, suggesting that HCL migration and stromal cell adhesion might be affected in a fashion similar to CLL.
In summary, our study demonstrates that HCL cells can be activated via the BCR, which involves downstream activation of BTK. The BTK inhibitor ibrutinib has a direct effect on HCL cells, inhibiting signalling downstream of the BCR and CXCR4, which are critical for HCL cell survival and proliferation (Figure 6). Thereby, this study provides insight of the importance of BCR signalling and BTK in HCL and provides a rationale for the development of inhibitors of BCR-associated kinases, such as ibrutinib in patients with HCL.
Figure 6. Schematic diagram depicting how ibrutinib may affect BCR and CXCR4 signalling in HCL.

Upon antigen stimulation, BCR signalling induces LYN and SYK phosphorylation (P in orange circles refer to phosphorylation) that initiate a signalling cascade causing downstream BTK activation. BTK is recruited into the signalling complex at the plasma membrane via the docking of its pleckstrin homology domain to phosphatidylinositol 3,4,5 triphosphate (PIP3). BTK becomes phosphorylated and therefore induces calcium release, which initiates a signalling cascade with the consequent induction of cell proliferation and survival. BTK is also involved in signalling of chemokine receptor CXCR4, which is important in cell migration and could be a suitable target for ibrutinib.
Supplementary Material
Acknowledgments
This study was supported by grants from the CLL Global Research Foundation (to JAB), a Cancer Prevention and Research Institute of Texas (CPRIT) grant (to JAB) and by Pharmacyclics Inc.
Footnotes
Authorship: Contributions: M.S. performed the experiments, analysed the data, designed the figures and wrote the paper; R.J.K and E.A, provided patients' samples and reviewed the paper; F.R, reviewed the paper and J.A.B. designed the research, supervised the study, analysed the data and wrote the paper.
Conflict of interest disclosure: J.A.B is consultant for Pharmacyclics Inc. and received research support from Pharmacyclics Inc. The remaining authors declare no competing financial interests.
References
- Advani RH, Buggy JJ, Sharman JP, Smith SM, Boyd TE, Grant B, Kolibaba KS, Furman RR, Rodriguez S, Chang BY, Sukbuntherng J, Izumi R, Hamdy A, Hedrick E, Fowler NH. Bruton tyrosine kinase inhibitor ibrutinib (PCI-32765) has significant activity in patients with relapsed/refractory B-cell malignancies. J Clin Oncol. 2013;31:88–94. doi: 10.1200/JCO.2012.42.7906. [DOI] [PMC free article] [PubMed] [Google Scholar]
- Arons E, Suntum T, Stetler-Stevenson M, Kreitman RJ. VH4-34+ hairy cell leukemia, a new variant with poor prognosis despite standard therapy. BLOOD. 2009;114:4687–4695. doi: 10.1182/blood-2009-01-201731. [DOI] [PMC free article] [PubMed] [Google Scholar]
- Burger JA, Buggy JJ. Emerging drug profiles: Bruton tyrosine kinase (BTK) inhibitor ibrutinib (PCI-32765) Leuk Lymphoma. 2013 doi: 10.3109/10428194.2013.777837. [DOI] [PubMed] [Google Scholar]
- Burger JA, Kipps TJ. CXCR4: a key receptor in the crosstalk between tumor cells and their microenvironment. BLOOD. 2006;107:1761–1767. doi: 10.1182/blood-2005-08-3182. [DOI] [PubMed] [Google Scholar]
- Burger JA, Montserrat E. Coming full circle: 70 years of chronic lymphocytic leukemia cell redistribution, from glucocorticoids to inhibitors of B-cell receptor signaling. BLOOD. 2013;121:1501–1509. doi: 10.1182/blood-2012-08-452607. [DOI] [PMC free article] [PubMed] [Google Scholar]
- Burger JA, Tsukada N, Burger M, Zvaifler NJ, Dell'Aquila M, Kipps TJ. Blood-derived nurse-like cells protect chronic lymphocytic leukemia B cells from spontaneous apoptosis through stromal cell-derived factor-1. BLOOD. 2000;96:2655–2663. [PubMed] [Google Scholar]
- Burger JA, Quiroga MP, Hartmann E, Burkle A, Wierda WG, Keating MJ, Rosenwald A. High-level expression of the T-cell chemokines CCL3 and CCL4 by chronic lymphocytic leukemia B cells in nurselike cell cocultures and after BCR stimulation. BLOOD. 2009;113:3050–3058. doi: 10.1182/blood-2008-07-170415. [DOI] [PMC free article] [PubMed] [Google Scholar]
- Burger JA, Sivina M, Ravandi F. The microenvironment in hairy cell leukemia: pathways and potential therapeutic targets. Leuk Lymphoma. 2011;52 Suppl 2:94–98. doi: 10.3109/10428194.2011.568649. [DOI] [PMC free article] [PubMed] [Google Scholar]
- Chiorazzi N, Efremov DG. Chronic lymphocytic leukemia: A tale of one or two signals? Cell Res. 2013;23:182–185. doi: 10.1038/cr.2012.152. [DOI] [PMC free article] [PubMed] [Google Scholar]
- Davis RE, Ngo VN, Lenz G, Tolar P, Young RM, Romesser PB, Kohlhammer H, Lamy L, Zhao H, Yang Y, Xu W, Shaffer AL, Wright G, Xiao W, Powell J, Jiang JK, Thomas CJ, Rosenwald A, Ott G, Muller-Hermelink HK, Gascoyne RD, Connors JM, Johnson NA, Rimsza LM, Campo E, Jaffe ES, Wilson WH, Delabie J, Smeland EB, Fisher RI, Braziel RM, Tubbs RR, Cook JR, Weisenburger DD, Chan WC, Pierce SK, Staudt LM. Chronic active B-cell-receptor signalling in diffuse large B-cell lymphoma. Nature. 2010;463:88–92. doi: 10.1038/nature08638. [DOI] [PMC free article] [PubMed] [Google Scholar]
- de Gorter DJ, Beuling EA, Kersseboom R, Middendorp S, van Gils JM, Hendriks RW, Pals ST, Spaargaren M. Bruton's tyrosine kinase and phospholipase Cgamma2 mediate chemokine-controlled B cell migration and homing. Immunity. 2007;26:93–104. doi: 10.1016/j.immuni.2006.11.012. [DOI] [PubMed] [Google Scholar]
- de Rooij MF, Kuil A, Geest CR, Eldering E, Chang BY, Buggy JJ, Pals ST, Spaargaren M. The clinically active BTK inhibitor PCI-32765 targets B-cell receptor- and chemokine-controlled adhesion and migration in chronic lymphocytic leukemia. BLOOD. 2012;119:2590–2594. doi: 10.1182/blood-2011-11-390989. [DOI] [PubMed] [Google Scholar]
- Dietrich S, Hullein J, Hundemer M, Lehners N, Meissner J, Jethwa A, Acker T, Galanov B, Andrulis M, Schulte C, Mandel T, Dreger P, Frohling S, von Kalle C, Ho AD, Glimm H, Zenz T. Exquisite sensitivity of refractory hairy-cell leukemia to BRAF inhibition with Vemurafenib. Onkologie. 2012;35:246–247. [Google Scholar]
- Durig J, Schmucker U, Duhrsen U. Differential expression of chemokine receptors in B cell malignancies. Leukemia : official journal of the Leukemia Society of America, Leukemia Research Fund, UK. 2001;15:752–756. doi: 10.1038/sj.leu.2402107. [DOI] [PubMed] [Google Scholar]
- Else M, Dearden CE, Matutes E, Garcia-Talavera J, Rohatiner AZ, Johnson SA, O'Connor NT, Haynes A, Osuji N, Forconi F, Lauria F, Catovsky D. Long-term follow-up of 233 patients with hairy cell leukaemia, treated initially with pentostatin or cladribine, at a median of 16 years from diagnosis. Br J Haematol. 2009;145:733–740. doi: 10.1111/j.1365-2141.2009.07668.x. [DOI] [PubMed] [Google Scholar]
- Forconi F. Hairy cell leukaemia: biological and clinical overview from immunogenetic insights. Hematol Oncol. 2011;29:55–66. doi: 10.1002/hon.975. [DOI] [PubMed] [Google Scholar]
- Forconi F, Raspadori D, Lenoci M, Lauria F. Absence of surface CD27 distinguishes hairy cell leukemia from other leukemic B-cell malignancies. Haematologica. 2005;90:266–268. [PubMed] [Google Scholar]
- Forconi F, Sozzi E, Intermesoli T, Stelitano C, Rigacci L, Tavera S, Zaja F, Cantaffa R, Gherlinzoni F, Pulsoni A, Galieni P, Zaccaria A, Baraldi A, Martinelli G, Morello E, Raspadori D, Tassi M, Pietrini A, Cencini E, Pierri I, Stefoni V, Caremani A, Bertoni F, Lauria F. Hairy Cell Leukemias with Unmutated Ighv Genes Define the Minor Aggressive Subset Unresponsive to Single Agent 2cda. Haematologica-the Hematology Journal. 2008;93:S97–S97. [Google Scholar]
- Forconi F, Cencini E, Sicuranza A, Sozzi E, Lauria F. Molecular insight into the biology and clinical course of hairy cell leukemia utilizing immunoglobulin gene analysis. Leuk Lymphoma. 2011;52:15–23. doi: 10.3109/10428194.2010.530362. [DOI] [PubMed] [Google Scholar]
- Friedberg JW, Sharman J, Sweetenham J, Johnston PB, Vose JM, Lacasce A, Schaefer-Cutillo J, De Vos S, Sinha R, Leonard JP, Cripe LD, Gregory SA, Sterba MP, Lowe AM, Levy R, Shipp MA. Inhibition of Syk with fostamatinib disodium has significant clinical activity in non-Hodgkin lymphoma and chronic lymphocytic leukemia. BLOOD. 2010;115:2578–2585. doi: 10.1182/blood-2009-08-236471. [DOI] [PMC free article] [PubMed] [Google Scholar]
- Furman RR, Byrd JC, Brown JR, Coutre SE, Benson DM, Jr, Wagner-Johnston ND, Flinn IW, Kahl BS, Spurgeon SE, Lannutti B, Giese NA, Webb HK, Ulrich RG, Peterman S, Holes LM, Yu AS. CAL-101, An Isoform-Selective Inhibitor of Phosphatidylinositol 3-Kinase P110{delta}, Demonstrates Clinical Activity and Pharmacodynamic Effects In Patients with Relapsed or Refractory Chronic Lymphocytic Leukemia. Blood. 2010;116:31a. [Google Scholar]
- Ghiotto F, Fais F, Valetto A, Albesiano E, Hashimoto S, Dono M, Ikematsu H, Allen SL, Kolitz J, Rai KR, Nardini M, Tramontano A, Ferrarini M, Chiorazzi N. Remarkably similar antigen receptors among a subset of patients with chronic lymphocytic leukemia. J Clin Invest. 2004;113:1008–1016. doi: 10.1172/JCI19399. [DOI] [PMC free article] [PubMed] [Google Scholar]
- Herman SE, Gordon AL, Hertlein E, Ramanunni A, Zhang X, Jaglowski S, Flynn J, Jones J, Blum KA, Buggy JJ, Hamdy A, Johnson AJ, Byrd JC. Bruton tyrosine kinase represents a promising therapeutic target for treatment of chronic lymphocytic leukemia and is effectively targeted by PCI-32765. BLOOD. 2011;117:6287–6296. doi: 10.1182/blood-2011-01-328484. [DOI] [PMC free article] [PubMed] [Google Scholar]
- Hoellenriegel J, Meadows SA, Sivina M, Wierda WG, Kantarjian H, Keating MJ, Giese N, O'Brien S, Yu A, Miller LL, Lannutti BJ, Burger JA. The phosphoinositide 3′-kinase delta inhibitor, CAL-101, inhibits B-cell receptor signaling and chemokine networks in chronic lymphocytic leukemia. BLOOD. 2011;118:3603–3612. doi: 10.1182/blood-2011-05-352492. [DOI] [PMC free article] [PubMed] [Google Scholar]
- Honigberg LA, Smith AM, Sirisawad M, Verner E, Loury D, Chang B, Li S, Pan Z, Thamm DH, Miller RA, Buggy JJ. The Bruton tyrosine kinase inhibitor PCI-32765 blocks B-cell activation and is efficacious in models of autoimmune disease and B-cell malignancy. Proc Natl Acad Sci U S A. 2010;107:13075–13080. doi: 10.1073/pnas.1004594107. [DOI] [PMC free article] [PubMed] [Google Scholar]
- Kuppers R. Mechanisms of B-cell lymphoma pathogenesis. Nat Rev Cancer. 2005;5:251–262. doi: 10.1038/nrc1589. [DOI] [PubMed] [Google Scholar]
- LeBien TW, Tedder TF. B lymphocytes: how they develop and function. Blood. 2008;112:1570–1580. doi: 10.1182/blood-2008-02-078071. [DOI] [PMC free article] [PubMed] [Google Scholar]
- Matutes E. Immunophenotyping and differential diagnosis of hairy cell leukemia. Hematology-Oncology Clinics of North America. 2006;20:1051–+. doi: 10.1016/j.hoc.2006.06.012. [DOI] [PubMed] [Google Scholar]
- Messmer BT, Albesiano E, Efremov DG, Ghiotto F, Allen SL, Kolitz J, Foa R, Damle RN, Fais F, Messmer D, Rai KR, Ferrarini M, Chiorazzi N. Multiple distinct sets of stereotyped antigen receptors indicate a role for antigen in promoting chronic lymphocytic leukemia. J Exp Med. 2004;200:519–525. doi: 10.1084/jem.20040544. [DOI] [PMC free article] [PubMed] [Google Scholar]
- Ponader S, Chen SS, Buggy JJ, Balakrishnan K, Gandhi V, Wierda WG, Keating MJ, O'Brien S, Chiorazzi N, Burger JA. The Bruton tyrosine kinase inhibitor PCI-32765 thwarts chronic lymphocytic leukemia cell survival and tissue homing in vitro and in vivo. BLOOD. 2012;119:1182–1189. doi: 10.1182/blood-2011-10-386417. [DOI] [PMC free article] [PubMed] [Google Scholar]
- Quiroga MP, Balakrishnan K, Kurtova AV, Sivina M, Keating MJ, Wierda WG, Gandhi V, Burger JA. B-cell antigen receptor signaling enhances chronic lymphocytic leukemia cell migration and survival: specific targeting with a novel spleen tyrosine kinase inhibitor, R406. BLOOD. 2009;114:1029–1037. doi: 10.1182/blood-2009-03-212837. [DOI] [PMC free article] [PubMed] [Google Scholar]
- Ravandi F, O'Brien S, Jorgensen J, Pierce S, Faderl S, Ferrajoli A, Koller C, Challagundla P, York S, Brandt M, Luthra R, Burger J, Thomas D, Keating M, Kantarjian H. Phase 2 study of cladribine followed by rituximab in patients with hairy cell leukemia. BLOOD. 2011;118:3818–3823. doi: 10.1182/blood-2011-04-351502. [DOI] [PMC free article] [PubMed] [Google Scholar]
- Robak T. Hairy-cell leukemia variant: Recent view on diagnosis, biology and treatment. Cancer Treatment Reviews. 2011;37:3–10. doi: 10.1016/j.ctrv.2010.05.003. [DOI] [PubMed] [Google Scholar]
- Siegel R, Naishadham D, Jemal A. Cancer statistics, 2012. CA Cancer J Clin. 2012;62:10–29. doi: 10.3322/caac.20138. [DOI] [PubMed] [Google Scholar]
- Sivina M, Hartmann E, Kipps TJ, Rassenti L, Krupnik D, Lerner S, Lapushin R, Xiao L, Huang X, Werner L, Neuberg D, Kantarjian H, O'Brien S, Wierda WG, Keating MJ, Rosenwald A, Burger JA. CCL3 (MIP-1{alpha}) plasma levels and the risk for disease progression in chronic lymphocytic leukemia (CLL) BLOOD. 2010 doi: 10.1182/blood-2010-09-307249. [DOI] [PMC free article] [PubMed] [Google Scholar]
- Spaargaren M, Beuling EA, Rurup ML, Meijer HP, Klok MD, Middendorp S, Hendriks RW, Pals ST. The B cell antigen receptor controls integrin activity through Btk and PLCgamma2. J Exp Med. 2003;198:1539–1550. doi: 10.1084/jem.20011866. [DOI] [PMC free article] [PubMed] [Google Scholar]
- Swerdlow S, Campo E, Harris NL, et al. WHO Classification of Tumours of Haematopoietic and Lymphoid Tissues. 4th 2008. [Google Scholar]
- Tiacci E, Trifonov V, Schiavoni G, Holmes A, Kern W, Martelli MP, Pucciarini A, Bigerna B, Pacini R, Wells VA, Sportoletti P, Pettirossi V, Mannucci R, Elliott O, Liso A, Ambrosetti A, Pulsoni A, Forconi F, Trentin L, Semenzato G, Inghirami G, Capponi M, Di Raimondo F, Patti C, Arcaini L, Musto P, Pileri S, Haferlach C, Schnittger S, Pizzolo G, Foa R, Farinelli L, Haferlach T, Pasqualucci L, Rabadan R, Falini B. BRAF Mutations in Hairy-Cell Leukemia. New England Journal of Medicine. 2011;364:2305–2315. doi: 10.1056/NEJMoa1014209. [DOI] [PMC free article] [PubMed] [Google Scholar]
- Tobin G, Thunberg U, Johnson A, Eriksson I, Soderberg O, Karlsson K, Merup M, Juliusson G, Vilpo J, Enblad G, Sundstrom C, Roos G, Rosenquist R. Chronic lymphocytic leukemias utilizing the VH3-21 gene display highly restricted Vlambda2-14 gene use and homologous CDR3s: implicating recognition of a common antigen epitope. Blood. 2003;101:4952–4957. doi: 10.1182/blood-2002-11-3485. [DOI] [PubMed] [Google Scholar]
- Weston-Bell NJ, Hendriks D, Sugiyarto G, Bos NA, Kluin-Nelemans HC, Forconi F, Sahota SS. Hairy cell leukemia cell lines expressing annexin A1 and displaying B-cell receptor signals characteristic of primary tumor cells lack the signature BRAF mutation to reveal unrepresentative origins. Leukemia. 2013;27:241–245. doi: 10.1038/leu.2012.163. [DOI] [PubMed] [Google Scholar]
- Widhopf GF, 2nd, Rassenti LZ, Toy TL, Gribben JG, Wierda WG, Kipps TJ. Chronic lymphocytic leukemia B cells of more than 1% of patients express virtually identical immunoglobulins. Blood. 2004;104:2499–2504. doi: 10.1182/blood-2004-03-0818. [DOI] [PubMed] [Google Scholar]
- Wong S, Fulcher D. Chemokine receptor expression in B-cell lymphoproliferative disorders. Leuk Lymphoma. 2004;45:2491–2496. doi: 10.1080/10428190410001723449. [DOI] [PubMed] [Google Scholar]
- Xi L, Arons E, Navarro W, Calvo KR, Stetler-Stevenson M, Raffeld M, Kreitman RJ. Both variant and IGHV4-34-expressing hairy cell leukemia lack the BRAF V600E mutation. BLOOD. 2012;119:3330–3332. doi: 10.1182/blood-2011-09-379339. [DOI] [PMC free article] [PubMed] [Google Scholar]
Associated Data
This section collects any data citations, data availability statements, or supplementary materials included in this article.