Abstract
ATP is the dominant energy source in animals for mechanical and electrical work (e.g., muscle contraction, neuronal firing). For chemical work, there is an equally important role for NADPH, which powers redox defense and reductive biosynthesis1. The most direct route to produce NADPH from glucose is the oxidative pentose phosphate pathway (oxPPP), with malic enzyme sometimes also important. While the relative contribution of glycolysis and oxidative phosphorylation to ATP production has been extensively analyzed, similar analysis of NADPH metabolism has been lacking. Here we demonstrate the ability to directly track, by liquid chromatography-mass spectrometry, the passage of deuterium from labeled substrates into NADPH, and combine this approach with carbon labeling and mathematical modeling to measure cytosolic NADPH fluxes. In proliferating cells, the largest contributor to cytosolic NADPH is the oxPPP. Surprisingly a nearly comparable contribution comes from serine-driven one-carbon metabolism, where oxidation of methylene tetrahydrofolate to 10-formyl-tetrahydrofolate is coupled to reduction of NADP+ to NADPH. Moreover, tracing of mitochondrial one-carbon metabolism revealed complete oxidation of 10-formyl-tetrahydrofolate to make NADPH. Since folate metabolism has not previously been considered an NADPH producer, confirmation of its functional significance was undertaken through knockdown of methylenetetrahydrofolate dehydrogenase (MTHFD) genes. Depletion of either the cytosolic or mitochondrial MTHFD isozyme resulted in decreased cellular NADPH/NADP+ and GSH/GSSG ratios and increased cell sensitivity to oxidative stress. Thus, while the importance of folate metabolism for proliferating cells has been long recognized and attributed to its function of producing one carbon units for nucleic acid synthesis, another crucial function of this pathway is generating reducing power.
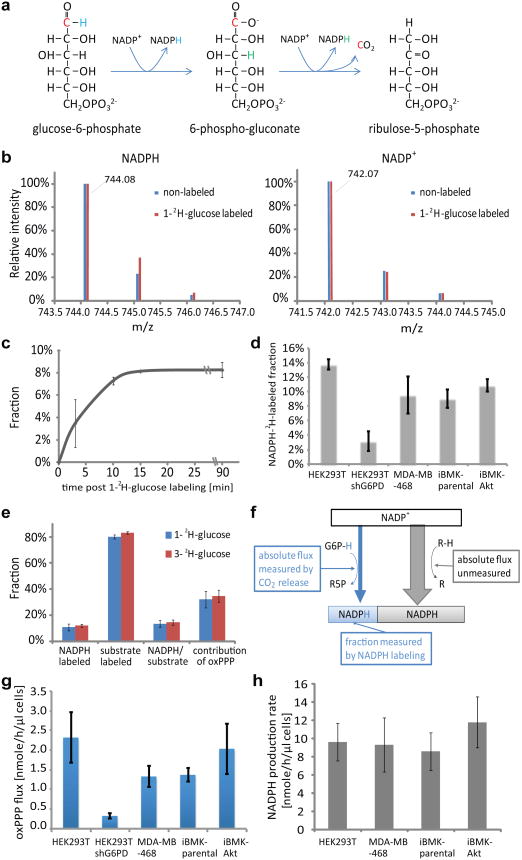
Past examination of NADPH production during cell growth has analyzed metabolic fluxes in cells using 13C and 14C isotope tracers2-5. For NADPH metabolism, however, carbon tracers alone are insufficient, because they cannot determine whether a particular redox reaction is making NADH versus NADPH or the reaction's fractional contribution to total cellular NADPH production. To address these limitations, we developed a deuterium tracer approach that directly measures NADPH redox active hydrogen labeling. To probe the oxPPP, we shifted cells from unlabeled to 1-2H-glucose or 3-2H-glucose (Figure 1a) and measured the resulting NADP+ and NADPH labeling by liquid chromatography-mass spectrometry6, as shown in the mass spectrum in Figure 1b (for associated chromatogram, see Extended Figure 1a). The M+1 and M+2 peaks in NADP+ are natural isotope abundance, primarily from 13C. The difference between NADP+ and NADPH reflects the redox active hydrogen labeling. The labeling of NADPH's redox-active hydrogen is fast (t1/2 ∼ 5 min) (Figure 1c; note: as opposed to relative mass intensities, all fractional labeling data are corrected for natural isotope abundance). NADPH labeling was similar across four different transformed mammalian cell lines. Knockdown of the committed enzyme of the oxPPP, glucose-6-phosphate dehydrogenase, eliminated most of the labeling, confirming that the NADPH-deuterium labeling reflects oxPPP flux (Figure 1d).
Figure 1.
Quantitation of NADPH labeling via oxPPP and of total cytosolic NADPH production. (a) OxPPP pathway schematic. (b) Mass spectra of NADPH and NADP+ from cells labeled with 1- 2H-glucose (iBMK-parental cells, 20 min). (c) Kinetics of NADPH labeling from 1-2H-glucose (iBMK-parental cells). (d) NADPH labeling from 1-2H-glucose (20 min). (e) 1-2H-glucose and 3-2H-glucose yield similar NADPH labeling (iBMK-parental cells, 20 min). Substrate labeling is reported for glucose-6-phosphate for 1-2H-glucose and 6-phosphogluconate for 3-2H-glucose. (f) Schematic illustrating that the total cytosolic NADP+ reduction flux is the absolute oxPPP flux (measured based on 14C-CO2 excretion) divided by the fractional oxPPP contribution (measured based on NADPH 2H-labeling). (g) OxPPP flux based on difference in 14C-CO2 release from 1-14C- and 6-14C-glucose. (h) Total cytosolic NADP+ reduction flux. All results are mean ± SD, N ≥ 2 biological replicates from a single experiment and were confirmed in multiple experiments.
Since most NADPH is cytosolic7, the 2H-glucose labeling results can be used to quantitate the fractional contribution of the oxPPP to total cytosolic NADPH production:
| (Eqn. 1) |
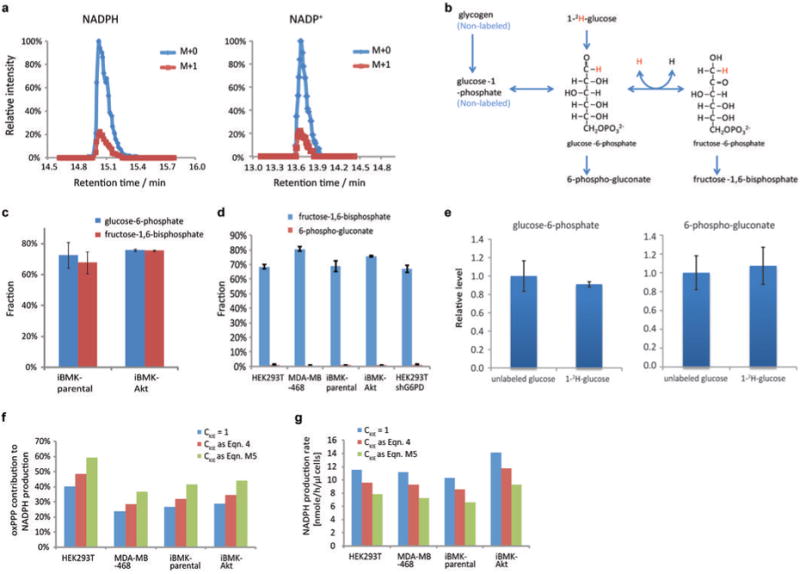
The terms in parentheses are the fractional 2H-labeling of NADPH's redox active hydrogen and of glucose-6-phosphate's targeted hydrogen (Figure 1e, Extended Figure 1b-d). The term CKIE accounts for the deuterium kinetic isotope effect8,9 (see Methods, Extended Figure 1e-g). Note that these 2H-labeling experiments directly measure the fraction of NADPH made by the oxPPP without relying on measurement of the absolute pathway flux. Using either 1-2H- or 3-2H-glucose, we find that oxPPP accounts for 30-50% of overall NADP+ reduction.
The inferred fractional contribution of oxPPP to NADPH production can be used to deduce the total cytosolic NADPH production rate, which is equal to the absolute oxPPP flux divided by the fractional contribution of oxPPP to NADPH production (Figure 1f). To this end, we measured absolute oxPPP flux using two orthogonal approaches. The first approach measures 14C-CO2 release from 1-14C versus 6-14C-glucose (Extended Figure 2a-c, Extended Figure 3). The second measures the kinetics of 6-phosphogluconate labeling from U-13C-glucose (Extended Figure 2d-f). Both approaches gave consistent fluxes with the radioactive measurement more precise (Extended Figure 2g). As confirmation of its specificity, we knocked down glucose-6-phosphate dehydrogenase and observed markedly reduced oxPPP 14C-CO2 release (Figure 1g). In the absence of such knockdown, the observed oxPPP flux ranged from 1 - 2.5 nmol uL-1 h-1 (where volume is the packed cell volume; Figure 1g). This flux is similar to, but slightly less than, the cellular ribose demand (Extended Figure 3f). In combination with the fractional NADPH labeling, we deduced a total cytosolic NADPH production rate of ∼10 nmol uL- h-1 (Figure 1h), which is 5 – 20% of the glucose uptake rate.
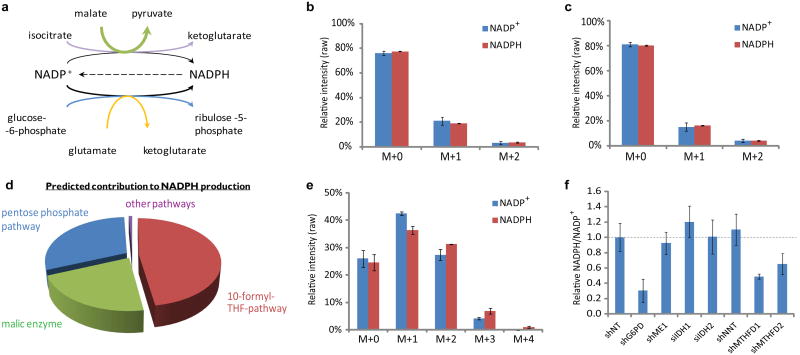
To investigate whether we could use 2H-labeling to directly observe NADPH production by other pathways (Figure 2a), we fed cells 2,3,3,4,4-2H-glutamine and 2,3,3-2H-aspartate. Downstream products of glutamine can potentially transfer 2H to NADPH via glutamate dehydrogenase or malic enzyme, while downstream products of aspartate may do so via isocitrate dehydrogenase (Extended Figure 4a-f). We observed identical mass spectra for NADP+ and NADPH after feeding the deuterium-labeled glutamine and aspartate (Figure 2b,c, Extended Figure 4b,d), and thus could not directly assign a fractional contribution to these pathways. Given recent evidence that malic enzyme is particularly important in cancer10,11, we used an orthogonal approach based on feeding U-13C-glutamine and measuring labeling of pyruvate, lactate and citrate to evaluate its activity (Extended Figure 4g,h). While such carbon tracer studies cannot distinguish between NADH-dependent and NADPH-dependent malic enzyme, they put an upper bound on their collective activities, which ranged from 15% to 50% of cytosolic NADPH production depending on the cell line.
Figure 2.
Pathways contributing to NADPH production. (a) Canonical NADPH production pathways. (b) NADPH and NADP+ isotopic distribution (without correction for natural isotope abundances) after incubation with 2,3,3,4,4-2H-glutamine tracer to probe NADPH production via glutamate dehydrogenase and malic enzyme (HEK293T cells, 20 min). See also Extended Figure 4. (c) NADPH and NADP+isotopic distribution as in (b) using 2,3,3-2H–aspartate tracer to probe NADPH production via IDH. See also Extended Figure 4. (d) NADPH production routes predicted by experimentally-constrained genome-scale flux balance analysis. (e) NADPH and NADP+ isotopic distribution as in (b) using 2,3,3-2H-serine tracer to probe NADPH production via folate metabolism (no glycine in the media). See also Extended Figure 5. (f) Relative NADPH/ NADP+ ratio in HEK293T cells with knockdown of various potential NADPH producing enzymes: glucose-6-phosphate dehydrogenase (G6PD), cytosolic malic enzyme (ME1), cytosolic and mitochondrial isocitrate dehydrogenase (IDH1 and IDH2), transhydrogenase (NNT), and cytosolic and mitochondrial methylene tetrahydrofolate dehydrogenase (MTHFD1 and MTHFD2). Plotted ratios are relative to vector control knockdown. Results are mean ± SD, N ≥ 2 biological replicates from a single experiment and were confirmed in multiple experiments.
To identify other potential NADPH producing pathways, we used a genome-scale human metabolic model12. We constrained the model based on the observed steady-state growth rate, biomass composition, and metabolite uptake and excretion rates of immortalized baby mouse kidney cells (iBMK-parental cells)13, without enforcing any constraints on NADPH production routes. The model, assessed via flux balance analysis with an objective of minimizing total enzyme expression requirements and hence flux14 (see Methods), predicted that both the oxPPP and malic enzyme contribute ∼ 30% of NADPH (Figure 2d). Surprisingly, however, ∼ 40% of NADPH production was predicted to come from one carbon metabolism mediated by tetrahydrofolate (THF). An alternative objective function of maximizing growth rate further predicts a potentially substantial contribution of folate metabolism to NADPH production (Extended Figure 5a,b).
The main folate-dependent NADPH-producing pathway was predicted to involve transfer of a one carbon unit from serine to THF, followed by oxidation of the resulting product (methylene-THF) by the enzyme MTHFD to form the purine precursor formyl-THF with concomitant NADPH production. To assess whether this pathway indeed contributes to NADPH production, we fed cells 2,3,3-2H-serine and observed labeling of both NADP+ and NADPH. The NADP+ labeling results from incorporation of the serine-derived formyl-THF one-carbon unit into NADP+'s adenine ring. Relative to NADP+, the labeling pattern of NADPH was shifted towards more heavily labeled forms, indicating specific labeling of NADPH's redox active hydrogen (Figure 2e, Extended Figure 5c,d). Thus, we were able to directly confirm that serine-driven folate metabolism contributes to NADP+ reduction.
To assess the functional significance of different pathways to NADPH homeostasis, we knocked down in HEK293T cells a variety of potential NADPH-producing enzymes and measured the cellular NADPH/NADP+ ratio (Figure 2f). While knockdown of malic enzyme 1 (ME1), cytosolic or mitochondrial NADP-dependent isocitrate dehydrogenase (IDH1 and IDH2), and transhydrogenase (NNT) did not significantly impact NADPH/NADP+, knockdown of glucose-6-phosphate dehydrogenase or either isozyme of methylene tetrahydrofolate dehydrogenase (MTHFD1, cytosolic, or MTHFD2, mitochondrial) substantially decreased it. These observations further support the primacy, at least in this growing cell line, of the pentose phosphate and folate pathways in NADPH production.
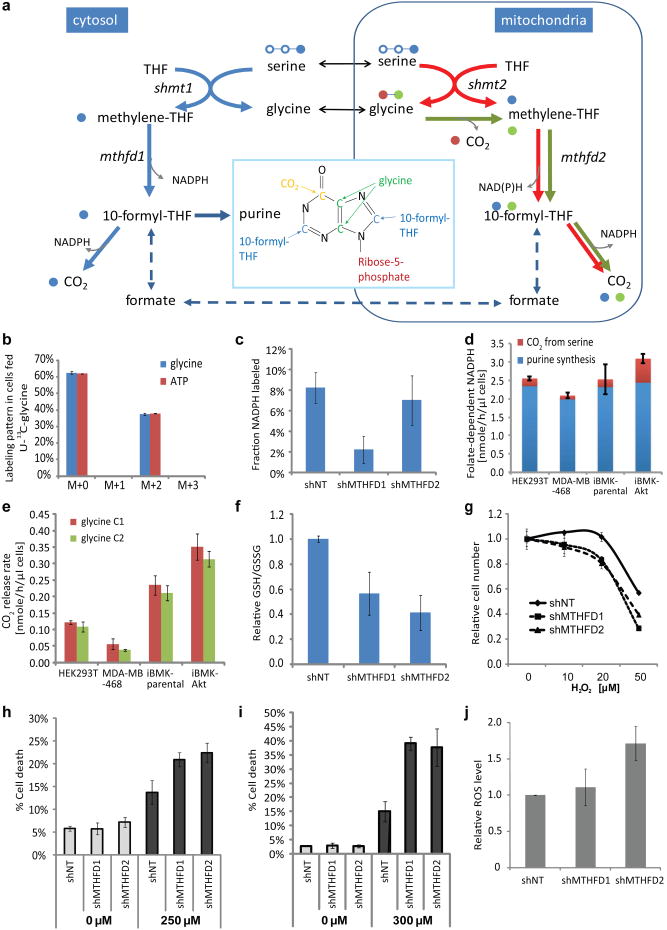
The importance of both isozymes of methylene tetrahydrofolate dehydrogenase suggests that cytosolic and mitochondrial folate metabolism (Figure 3a) both contribute to NADPH homeostasis. The product of methylene tetrahydrofolate dehydrogenase, 10-formyl-THF, is a required purine precursor, with each purine ring containing two formyl groups. Thus, the cytosolic 10-formyl-THF production rate must be at least twice the purine biosynthetic flux. The most direct path to cytosolic 10-formyl-THF is via MTHFD1 with concomitant NADPH production (Figure 3a, solid blue lines). Alternatively, 10-formyl-THF could potentially be made from formate initially generated in the mitochondrion (Figure 3a, dashed lines)15,16. To distinguish between these possibilities, we fed U-13C-glycine, which contributes selectively to mitochondrial one-carbon pools (Figure 3a, green lines). Glycine is assimilated intact into purines, resulting in M+2 labeling of ATP; however, we did not observe any M+1, M+3, or M+4 ATP, indicating that mitochondrial-derived one-carbon units do not contribute to purine biosynthesis (Figure 3b). Consistent with this, feeding of U-13C-serine revealed that most one-carbon units assimilated into purines come from serine (Extended Figure 6a,b), and knockdown of MTHFD1 nearly eliminated NADPH redox-active hydrogen labeling from 2,3,3-2H-serine (Figure 3c). Assuming that all 10-formyl-THF production for purine synthesis is coupled via MTHFD1 to NADP+ reduction, the total NADPH production rate is ∼ 2 nmol uL-1 h-1 (Figure 3d) or ∼ 25% of total cytosolic NADPH flux. To probe potential further oxidation of serine, we fed 3-14C-serine and observed 14C-CO2 release, implying that the THF pathway runs in excess of one-carbon demand yielding additional NADPH (Figure 3d, Extended Figure 7).
Figure 3.
Quantitation of folate-dependent NADPH production. (a) Pathway schematic with serine C3 in blue, glycine C1 in red, and glycine C2 in green. (b) Glycine and ATP labeling pattern after incubation with U-13C-glycine (HEK293T cells, 24 h). The lack of M+3 and M+4 ATP indicates that no glycine-derived one-carbon units contribute to purine synthesis. (c) Fraction of NADPH labeled at the redox active hydrogen after 24 h incubation with 2,3,3-2H-serine in HEK293T cells with stable MTHFD1 or MTHFD2 knockdown. Same cells used also in (f) – (i). (d) Absolute rate of cytosolic folate-dependent NADPH production. (e) CO2 release rate from glycine C1 and glycine C2. (f) GSH/GSSG ratio. (g) Relative growth, normalized to untreated samples, during 48 h exposure to H2O2. (h) Fractional death after 24 h exposure to 250 μM H2O2. (i) Fractional death after 24 h exposure to 300 μM diamide. (j) Relative ROS levels measured using DCFH assay. Mean ± SD, N=3.
We also investigated the consequences of elimination of serine from the medium (Extended Figure 8). As has been observed previously both in vitro17,18 and in tumor models19, serine depletion impaired cell growth (Extended Figure 8b). Consistent with one important downstream product of serine being NADPH, its removal decreased NADPH/NADP+ (Extended Figure 8c). Glycine is both a product of serine metabolism, and itself a potential source of one-carbon units via the mitochondrial glycine cleavage system, whose expression has been linked to oncogenic transformation20. We accordingly tested the impact of both removing serine and increasing glycine in the culture media. We found that increased glycine further impaired cell growth and decreased the NADPH/NADP+ ratio (Extended Figure 8 b,c). These results are consistent with increased glycine impairing methylene-THF production, perhaps due to reverse flux through serine hydroxymethyltransferase (Extended Figure 8d,e).
The above results establish a major contribution of serine-driven cytosolic one-carbon metabolism in NADPH homeostasis. Knockdown of MTHFD2 also alters NADPH/NADP+, suggesting an additional role for mitochondrial one-carbon metabolism. Mitochondrial folate-dependent enzymes, especially MTHFD2, are overexpressed across human cancers21. To probe specifically mitochondrial folate metabolism, we fed 14C-labeled glycine and monitored radioactive CO2 release. The glycine cleavage system releases glycine C1 as CO2, while transferring glycine C2 to THF, making methylene-THF. Notably, almost as much radioactive CO2 was released from 2-14C-glycine as from 1-14C-glycine (Figure 3e), indicating that a majority of mitochondrial methylene-THF is fully oxidized to CO2. Consistent with such complete oxidation, when we fed 13C-labeled glycine, we did not observe transfer of one-carbon units to the cytosol based on the thymidine triphosphate (dTTP) or methionine labeling, with dTTP's one-carbon unit coming from serine (90 – 100%) and methionine coming from the medium (Extended Figure 6c-f). As expected based on the mitochondrial methylene-THF oxidation pathway, release of glycine C2 as CO2was decreased by knockdown of either MTHFD2 or ALDH1L2 (Extended Figure 7g). Such complete one-carbon unit oxidation may be beneficial for reducing the cellular glycine concentration. In addition, it produces mitochondrial NADPH. Thus, two functions of mitochondrial folate metabolism are glycine detoxification and NADPH production.
One important role of NADPH is antioxidant defense. Consistent with folate metabolism being a significant NADPH producer, antifolates have been found to induce oxidative stress22. To more directly link folate-mediated NADPH production with cellular redox defenses, we measured glutathione, reactive oxygen species, and hydrogen peroxide sensitivity of MTHFD1 and MTHFD2 knockdown cells. Knockdown of either isozyme decreased the ratio of reduced to oxidized glutathione (Figure 3f) and impaired resistance to oxidative stress induced by hydrogen peroxide (Figure 3g, h) or diamide (Figure 3i). MTHFD2 knockdown specifically increased reactive oxygen species (Figure 3j), and ALDH1L2 knockdown decreased the ratio of reduced to oxidized glutathione (Extended Figure 7h), demonstrating that the complete mitochondrial methylene-THF oxidation pathway is required for redox homeostasis.
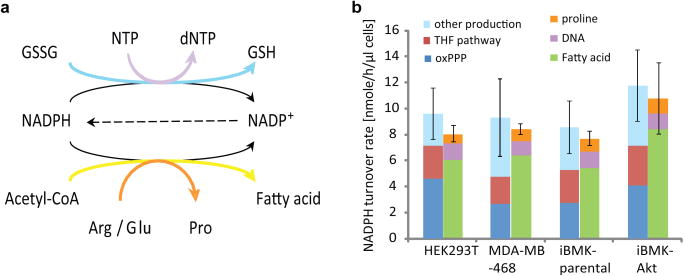
A major open question regards the relative use of NADPH for biosynthesis versus redox defense. To address this, we compared total cytosolic NADPH production (as measured above) to consumption for biosynthesis (Figure 4a, Methods) based on the measured cellular content of DNA, amino acids, and lipids; their production routes (measured by 13C tracer experiment, see Methods);and cellular growth rate (Extended Figure 9a-g). The overall demand for NADPH for biosynthesis is > 80% of total cytosolic NADPH production (Figure 4b), with a majority of this NADPH consumed by fatty acid synthesis. At least in transformed cells growing under aerobic conditions, most cytosolic NADPH is devoted to biosynthesis, not redox defense.
Figure 4.
Comparison of NADPH production and consumption. (a) Major NADPH consumption pathways. (b) Cytosolic NADPH production and consumption fluxes. Mean ± SD, with error bar showing the variation of total production or consumption, N = 3.
To evaluate NADPH consumption for redox defense under overt redox stress, we treated HEK293T cells with hydrogen peroxide at a concentration that blocks growth without causing substantial cell death and measured the total cytosolic NADPH production rate. The rate was 5.5nmol μL-1 h-1, about half that in freely growing cells (Extended Figure 9h). Thus, consistent with most cytosolic NADPH in growing cells being used for biosynthesis, growth-inhibiting oxidative stress decreases cytosolic NADPH production.
The production of NADPH by the oxidative pentose phosphate pathway, which makes the nucleotide building block ribose, and by the 10-formyl-THF pathway, which contributes to purine synthesis, leads to an inherent coupling of nucleotide synthesis with NADPH production. These reactions together produce in growing cells roughly the amount of NADPH required for replication of cellular lipids (Figure 4b). Interruption of this intrinsic coordination by feeding of purines can impair cell growth23. In non-growing cells, or other cases where NADPH needs outstrip production coupled to nucleotide synthesis, it is likely that alternative pathways, e.g., malic enzyme and IDH, will be of greater importance than observed here.
The contribution of the 10-formyl-THF pathway to NADPH production is particularly interesting in light of the importance of metabolism of serine and glycine, the major carbon sources of this pathway, to cancer growth24. Serine synthesis is promoted by the cancer-associated M2 isozyme of pyruvate kinase (PKM2) and by amplification of 3-phosphoglycerate dehydrogenase17,18. The present data suggest that serine serves dual roles in providing both one carbon units and NADPH. In this respect, it is intriguing that PKM2, in addition to sensing serine25,26, is inactivated by oxidative stress27. Such inactivation should increase 3-phosphoglycerate and thus potentially serine-driven NADPH production.
In addition to synthesizing serine, rapidly growing cells avidly consume glycine28. Intriguingly, while only intact glycine (and not glycine-derived one carbon units) is incorporated into purines, knockdown of the glycine cleavage system impairs cancer growth20. We find that most glycine-derived one-carbon units are fully oxidized, arguing against the glycine cleavage system's primary role, at least in the tested cell lines, being to release one-carbon units to the cytosol. Instead, its function may be simultaneous elimination of unwanted glycine and production of mitochondrial NADPH.
Understanding NADPH's production and consumption routes is essential to global understanding of metabolism. The approaches provided here will enable evaluation of these routes in different cell types and environmental conditions. Analogous measurements for ATP, achieved first more than a half century ago29, have formed the foundation for much of subsequent metabolism research. Given NADPH's comparable role in medically important processes including lipogenesis, oxidative stress, and tumor growth30, quantitative analysis of its metabolism may prove of similar importance.
Methods Summary
Cells were grown in Dulbecco's modified eagle media (DMEM) without pyruvate (CELLGRO) with 10% dialyzed fetal bovine serum (Invitrogen) in 5% CO2 at 37°C and harvested at ∼80% confluency. Stable knockdown cell lines were generated by shRNA-expressing lentivirus with puromycin selection. IDH1, IDH2 and ALDH1L2 knockdown was generated by transfecting cells with siRNA. For confirmation of knockdown, see Extended Figure 10. For metabolite measurements, metabolism was quenched and metabolites extracted by aspirating media and immediately adding -80°C 80:20 methanol:water. Supernatants from two rounds of extraction were combined, dried under N2, resuspended in water, placed in 4°C autosampler, and analyzed within 6 h by reversed-phase ion-pairing chromatography negative-mode electrospray-ionization high-resolution MS on a stand-alone orbitrap (Thermo)6. Fluxes from 14C-labeled substrates to CO2 were measured by adding trace 14C-labeled nutrient to normal culture media, quantifying radioactive CO2 release14, and correcting for intracellular substrate labeling according to percentage of radioactive tracer in the media and fraction of particular intracellular metabolite deriving from media uptake, as measured using 13C-tracer. To assess the potential contribution of various metabolic pathways to NADPH production, we analyzed feasible steady-state fluxes of a genome-scale human metabolic network model12 constrained by experimentally measured uptake and excretion fluxes and growth rate of the iBMK cell line. The flux balance equations were solved in MATLAB with the objective function formulated to minimize the total sum of fluxes14. NADPH consumption by reductive biosynthesis was determined based on reaction stoichiometries, experimentally measured cellular biomass composition, growth rate, fractional de novo synthesis of fatty acids (by 13C-labeling from U-13C-glucose and U-13C-glutamine), and fractional synthesis of proline from glutamate versus arginine (by 13C-labeling from U-13C-glutamine). Correction for the deuterium kinetic isotope effect was based on the assumption that total metabolic fluxes are not impacted. Let x be the fractional labeling of the relevant substrate hydrogen, FU be the NADPH production flux from unlabeled substrate and FL be the NADPH production flux from the labeled substrate.
| (Eqn.2) |
| (Eqn.3) |
FL/x is the flux in cases without a discernible kinetic isotope effect (e.g., for 13C). The remaining term is the correction factor for the kinetic isotope effect:
| (Eqn.4) |
Methods
Cell lines and culture conditions
HEK293T and MDA-MB-468 were purchased from ATCC. Immortalized baby mouse kidney epithelial cells (iBMK) with and without myr-AKT were a gift of Eileen White 13,32. All cell lines were grown in Dulbecco's modified eagle medium (DMEM) without pyruvate (CELLGRO), supplemented with 10% dialyzed fetal bovine serum (Invitrogen) in a 5% CO2 incubator at 37°C. Knockdown of enzymes were by infection with lentivirus expressing the corresponding shRNA (shMTHFD1,#1:CCGGGCTGAAGAGATTGGGATCAAACTCGAGTTTGATCCCAATCTCTTCAGCTTTTTG,#2:CCGGGCCATTGATGCTCGGATATTTCTCGAGAAATATCCGAGCATCAATGGCTTTTTG;shMTHFD2,#1:CCGGGCAGTTGAAGAAACATACAATCTCGAGATTGTATGTTTCTTCAACTGCTTTTTG,#2:CCGGGCTGGGTATATCACTCCAGTTCTCGAGAACTGGAGTGATATACCCAGCTTTTTG;shG6PD,#1:CCGGCAACAGATACAAGAACGTGAACTCGAGTTCACGTTCTTGTATCTGTTGTTTTTG,#3:CCGGGCTGATGAAGAGAGTGGGTTTCTCGAGAAACCCACTCTCTTCATCAGCTTTTTG;shNNT:CCGGCCCTATGGTTAATCCAACATTCTCGAGAATGTTGGATTAACCATAGGGTTTTTG;shME1,#1:CCGGGCCTTCAATGAACGGCCTATTCTCGAGAATAGGCCGTTCATTGAAGGCTTTTTG,#2:CCGGCCAACAATATAGTTTGGTGTTCTCGAGAACACCAAACTATATTGTTGGTTTTTG) and puromycin selection. To obtain the shRNA-expressing virus, pLKO-shRNA vectors (Sigma-Aldrich) were cotransfected with the third generation lentivirus packaging plasmids (pMDLg, pCMV-VSV-G and pRsv-Rev) into HEK293T cells using FuGENE 6 Transfection Reagent (Promega), fresh media added after 24 h, and viral supernatants collected at 48 h. Target cells were infected by viral supernatant (diluted 1:1 with DMEM; 6 μg/ml polybrene), fresh DMEM added after 24 h, and selection with 3 μg/ml puromycininitiated at 48 h and allowed to proceed for 2 – 3 days. Thereafter, cells were maintained in DMEM with 1 μg/ml puromycin. For IDH1, IDH2 and ALDH1L2 knockdown, siRNA targeting IDH1 or IDH2 (Thermo Scientific, 40 nM) or ALDH1L2 (Santa Cruz, 30 nM) were transfected into H293T cells using Lipofectamine™ RNAiMAX (Invitrogen). Knockdown of the enzymes was confirmed by immunobloting with commercial antibodies: G6PD (Bethyl Laboratories), MTHFD1 and MTHFD2 (Abgent), IDH1 (Proteintech Group), IDH2 (Abcam) and ALDH1L2 (Santa Cruz) or quantitative RT-PCR probes (ME1 and NNT, Applied Biosystems) (Extended Figure 10). For enzymes with more than one successful knockdown sequence, data presented here are mean ± SD of independent experiments using different shRNA sequences.
Measurement of metabolite concentrations and labeling patterns
Cells were harvested at ∼80% confluency. For metabolomic experiments, medium was replaced every 2 days and additionally 2 h before metabolome harvesting and/or isotope tracer addition. Metabolism was quenched and metabolites extracted by aspirating media and immediately adding -80°C 80:20 methanol:water. Supernatants from two rounds of methanol:water extraction were combined, dried under N2, resuspended in HPLC water, placed in 4°C autosampler, and analyzed within 6 h to avoid NADPH degradation.
The LC-MS method involved reversed-phase ion-pairing chromatography coupled by negative mode electrospray ionization to a stand-alone orbitrap mass spectrometer (Thermo Scientific) scanning from m/z 85-1000 at 1 Hz at 100,000 resolution 6,33,34 with LC separation on a Synergy Hydro-RP column (100 mm ×2 mm, 2.5 μm particle size, Phenomenex, Torrance, CA) using a gradient of solvent A (97:3 H2O/MeOH with 10 mM tributylamine and 15 mM acetic acid), and solvent B (100% MeOH). The gradient was 0 min, 0% B; 2.5 min, 0% B; 5 min, 20% B; 7.5 min, 20% B; 13 min, 55% B; 15.5 min, 95% B; 18.5 min, 95% B; 19 min, 0% B; 25 min, 0% B. Injection volume was 10 μL, flow rate 200μl/min, and column temperature 25 °C. Data were analyzed using the MAVEN software suite35. Data from 13C-labeling experiments were adjusted for natural 13C abundance and impurity of labeled substrate; those from 2H-labeling were not adjusted (natural 2H abundance is negligible)36. The absolute concentration of 6-phosphogluconate was quantified by comparing the signal of 13C-labeled intracellular compound (from feeding U-13C-glucose) to the signal of unlabeled internal standard.
Fractional labeling of NADPH redox active site
The fractional NADPH redox active site labeling (x) was measured from the observed NADPH and NADP+ labeling patterns from the same sample. We calculated x to best fit the steady-state mass distribution vectors of NADPH and NADP+ (MNADPH and MNADP+) by least square fitting in MATLAB (function: lsqcurvefit).
| (Eqn. M1) |
Network analysis of potential NADPH producing pathways
To assess the potential contribution of various metabolic pathways to NADPH production, we analyzed feasible steady-state fluxes of a genome-scale human metabolic network model12. The glucose (98 nmol/(μL*h)), glutamine (40 nmol/(μL*h)), and oxygen uptake rates (21 nmol/(μL*h)), and lactate (143 nmol/(μL*h)), alanine (2 nmol/(μL*h)), pyruvate (15 nmol/(μL*h)), and formate (< 0.25 nmole/(μL*h)) excretion rates were set to experimental measured fluxes in the iBMK cell line, as measured by a combination of electrochemistry (glucose, glutamine, lactate on YSI7200 instrument, YSI, Yellow Springs, OH), LC-MS (alanine, pyruvate with isotopic internal standards), fluorometry (oxygen on XF24 flux analyzer, Seahorse Bioscience, North Billerica, MA), and NMR (formate by 1H 500 MHz, Bruker, 10 μM limit of detection). The uptake of amino acids from DMEM media were bounded to not more than a third of that of glutamine, which is a loose constraint relative to experimental observations in iBMK cells and in NCI-60 cells28. Biomass requirements were based on the experimentally determined growth rate of the iBMK cell-line with protein, fatty acids and nucleotides accounting for 60%, 10% and 10% of the total cellular dry mass, respectively, based on experimental measurements. Steady-state intracellular fluxes that best fit these experimental constraints were then selected by solving the flux balance equations in MATLAB with the objective function formulated to minimize the sum of total fluxes14.
Correction for deuterium's kinetic isotope effect
The kinetic isotope effect (VH/VD) for isolated NADPH producing enzymes ranges from 1.8 – 4, with isolated G6PD and 6-phosphogluconate dehydrogenase having VH/VD = 1.8 8,9. However, cellular homeostatic mechanisms (including flux control being distributed across multiple pathway enzymes) may result in a lesser impact on labeling patterns in cells.
The smallest reasonable correction for the deuterium kinetic isotope effect is based on the assumption that total metabolic fluxes are not impacted. This correction was used as the default in this work. Let x be the fractional labeling of the relevant substrate hydrogen, FU be the NADPH production flux from unlabeled substrate and FL be the NADPH production flux from the labeled substrate.
| (Eqn.M2) |
| (Eqn.M3) |
FL/x is the flux in cases without a discernible kinetic isotope effect (e.g., for 13C). The remaining term is the correction factor for the kinetic isotope effect:
| (Eqn.M4) |
The largest reasonable correction for the deuterium kinetic isotope effect is based on the assumption that pathway flux is decreased by the introduction of 2H-labeled tracer equivalent to the decrease in activity of the associated enzyme observed in vitro:
| (Eqn.M5) |
where N is the number of NADPH produced per substrate molecule passing through the pathway. For the oxPPP, N = 2. Note that the impact of the kinetic isotope effect on NADP2H production may be partially offset by an analogous (albeit smaller) kinetic isotope effect in NADP2H consuming reactions. VH/VD for fatty acid synthetase is ∼1.137. The impact of different mechanisms of correcting for the deuterium kinetic isotope is shown in Extended Figure 1.
Quantifying absolute oxPPP flux based on 6-phosphogluconate labeling kinetics
To quantify the absolute oxPPP flux, cells were switched to media containing U-13C-glucose, and the kinetics glucose-6-phosphate and 6-phosphogluconate labeling were measured. The unlabeled fraction of 6-phosphoglucanate decays with time as:
| (Eqn.M6) |
where FoxPPP is the flux of oxPPP, is the total cellular [6-phophogluconate]total concentration, which was directly measured, and is the unlabeled fraction of glucose-6-phosphate at time t, which decays exponentially. FoxPPP was obtained by least square fitting as per Yuan et al.38
Quantifying the upper limit of NADPH production via malic enzyme by 13C labeling
Malic enzyme can produce either NADH or NADPH. Thus, total malic enzyme flux puts an upper limit on the associated NADPH production. To probe overall malic enzyme activity, cells were incubated with U-13C-glutamine for 48 h, which resulted in majority of intracellular malate being uniformly labeled (13C4), with a small portion being 13C3. For simplicity, we assume that 13C3- malate is an equal mix of 1,2,3-13C3-malate and 2,3,4-13C3-malate due to rapid interconversion with fumarate (which is symmetric). Malic enzyme produces 13C3- pyruvate from both 13C4-malate and 1,2,3-13C3-malate, whereas glycolysis produces unlabeled pyruvate (See Extended Figure 4).
| (Eqn.M7) |
Estimation of fractional contribution of MTHFD to NADPH production based on 2H-serine labeling
Similar to quantifying relative contribution of oxPPP to cytosolic NADPH production, the contribution of THF-pathway can be estimated from 2H-serine labeling as follows:
| (Eqn.M8) |
Existing methods do not allow direct measurement of methylene-THF labeling, but such labeling can be approximated based on intracellular serine labeling (formally, the 2H-serine labeling places an upper bound on 2H-methylene-THF labeling).
| (Eqn.M9) |
MTHFD1 has deuterium kinetic isotope effect VH/VD of ∼ 3.
Measurement of 14C-CO2 release
Radioactive CO2 released by cells from positionally-labeled substrates was measured by trapping the CO2 in filter paper saturated with 10 M KOH as previously described14. Cells were grown in tissue culture flasks with DMEM medium with less than normal bicarbonate (0.74 g/L) and addition of HEPES buffer (6 g/L, pH 7.4). At the beginning of experiment, trace amount of desired 14C-labeled tracer was added to the media. For each cell line, the amount was selected to be the minimum that gives a sufficient radioactive CO2 signal to quantitate accurately (∼1 μCi/ml). All knockdown lines were treated identically to their corresponding parental line. Then the flask was sealed with a rubber stopper with a central well (Kimble Chase) containing a piece of filter paper saturated with 10 M KOH solution. The flasks were incubated at 37°C for 24 h. CO2 released by cells was absorbed by the base (i.e., KOH) in the central well. Metabolism was stopped by injection of 1 mL 3 M acetic acid solution through the rubber stopper. The flasks were then incubated at room temperature for 1 h to ensure all the CO2 dissolved in media was released and absorbed into the central well. The filter paper and all the liquid in central well was transfer to a scintillation vial containing 15 mL liquid scintillation cocktail (PerkinElmer Inc.). The central well was washed with 100 μL water twice, and the water was added to the same scintillation vial. Radioactivity was measured by liquid scintillation counting. In parallel, the same experiments were performed using U-13C-labeled nutrient (in amounts that fully replaced the unlabeled nutrient in DMEM) and the extent of labeling of the intracellular metabolite that is the substrate of the CO2-releasing reaction was measured by LC-MS. Absolute CO2 release rates from the nutrients of interest were calculated as follows:
| (Eqn.M10) |
Fractional labeling of cytosolic formyl groups from U-13C-serine
Cells were cultured with media containing U-13C-serine for 48 h, washed three times with cold PBS to remove extracellular serine, extracted, and the intracellular labeling pattern analyzed by LC-MS for ATP (representing purines; there is no labeling of ribose-phosphate based on LC-MS measurements), glycine, and serine. The purine ring has 5 carbons: 1 from CO2, 2 from glycine, and 2 from formyl groups (from 10-formyl-THF). Assume that CO2 labeling is negligible, which is realistic for cells grown in a 5% CO2 incubator. Let XATP-i and XGly-j represent the experimentally observed fraction ATP and glycine with i and j labeled carbons. The cytosolic 10-formyl-THF labeling fraction, x, was fit by least squares:
| (Eqn.M11) |
Cytosolic NADPH production from 10-formyl-THF pathway
Cytosolic NADPH production from 10-formyl-THF pathway was quantified by tracking its end products: 10-formyl-THF consumed by purine synthesis and CO2. (Formate excretion into media is below detection limit of NMR.) All 10-formyl-THF consumed by purine synthesis is generated in cytosol and associated with production of 1 NADPH. For each CO2 released from serine C3, assuming reaction happens in cytosol, 1 NADPH is produced from 10-formyl-THF oxidation, and another NADPH is produced via MTHFD1. Total cytosolic NADPH production via 10-formyl-THF pathway is:
| (Eqn. M12) |
If complete oxidation of serine C3 instead happens in mitochondria, there is no cytosolic NADPH production associated with CO2 released from serine C3 (i.e., no red bar in figure 3d). Instead, one mitochondrial NADPH is produced from10-formyl-THF oxidation, and zero to one other mitochondrial NADPH from 5,10-methylene-THF oxidation depending on the enzyme used to catalyze the reaction and its cofactor specificity. In mitochondria, this reaction can be catalyzed by MTHFD2, which (at least in the presence of high phosphate in vitro) preferentially uses NAD+ or by MTHFD2L, which uses NADP+.)
ROS measurement, cell proliferation and cell death assay
ROS measurement followed published protocols39. Briefly, HEK293T cells were incubated with 5 μM CM-H2DCFDA (Invitrogen) for 30 min. Cells were trypsinized, and mean FL1 fluorescence was measured by flow cytometry. Cell proliferation was measured by trypsinizing cells and counting using a Beckman's Multisizer 4 Coulter Counter. To measure cell death, cells were stained with Trypan Blue. Stained/unstained cells were counted and cell death percentages tabulated.
Quantitation of NADPH consumption by reductive biosynthesis
The general strategy for measuring consumption fluxes was as follows: (i) identifying the biomass components produced in cells grown in DMEM by NADPH-driven reductive biosynthesis (these are DNA, proline, and fatty acids); (ii) determining the biomass fraction of each component in each cell line; (iii) quantifying the cellular growth rate Rgrowth =ln (2) / t1/2; (iv) measuring the fractional contribution of different biosynthetic routes to each biomass component via experiments with 13C-labeled glucose and/or glutamine and LC-MS analysis; (v) computing the average number of NADPH per unit of biomass component, which equals the sum of the fractional contribution of each route multiplied by the number of NADPH consumed by that route; and (vi) determining NADPH consumption as follows:
| (Eqn. M13) |
The required data were acquired as follows:
DNA: Cellular DNA and RNA were extracted and separated with TRIzol reagent (Invitrogen), purified, and quantified by Nanodrop spectrophotometer.
Fatty acids: Total cellular lipid was extracted and saponified after addition of isotope-labeled internal standards for the C16:0, C16:1, C18:0, and C18:1. Samples were analyzed by negative ESI-LC-MS with LC separation on a C8 column. Concentrations of other fatty acids, for which isotope-labeled internal standard were not available, were measured by comparison to the palmitate internal standard. The calculated fatty acid concentrations were multiplied with a correction factor to account for incomplete lipid recovery in the first step of the sample preparation procedure. This correction factor was empirically determined to be 1.9 by experiments in which lipid standards were spiked into extraction solution.
The extent of fatty acid synthesis and elongation (both of which consume NADPH) was determined by feeding cells U-13C-glucose and U-13C-glutamine for multiple doublings to achieve pseudo-steady state labeling of their lipid pools. Fatty acid labeling patterns were measured and computationally simulated to quantify the fraction of production versus import for each individual fatty acid species. Extended Figure 9 shows the associated data for C16:0, C16:1, C18:0, and C18:1, which together account for ∼ 80% of total cellular fatty acids and > 90% of non-essential fatty acids (essential fatty acids are imported, not synthesized, and thus do not impact NADPH production). NADPH calculations include similar data for all measurable fatty acids.
Proline: Proline can be made from either arginine or glutamate. Proline synthesis from either substrate requires two high-energy electrons at the step catalyzed by pyrroline-5-carboxylate reductase, which may use NADH or NADPH (for simplicity, we assume an equally contribution from each). Proline synthesis from glutamate consumes one additional NADPH40. To quantify the fraction of proline synthesized from each substrate, cells were labeled with U-13C-glutamine to steady state, which labels glutamate but not arginine. Labeling of intracellular proline and glutamate were measured.
| (Eqn.M14) |
| (Eqn.M15) |
Proline synthesis enzymes are present in both the cytosol and mitochondria. For simplicity, main text Figure 4 assumes exclusively cytosolic proline synthesis.
Extended Data
Extended Figure 1. Probing the fractional contribution of the oxPPP to NADPH production with 2H-glucose.
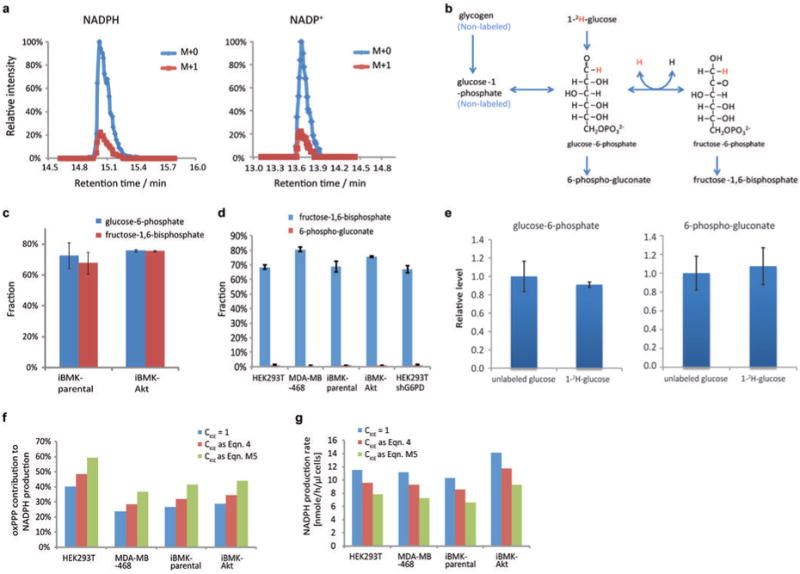
(a) Example of LC-MS chromatogram of M+0 and M+1 forms of NADPH and NADP+. Plotted values are 5 ppm mass window around each compound. (b) Extent of NADPH labeling must be corrected for extent of glucose-6-phosphate labeling. Incomplete labeling can occur due to influx from glycogen or H/D exchange. (c) Labeling fraction of glucose-6-phosphate and fructose-1,6-phosphate in iBMK cells with and without activated Akt (20 min after switching into 1-2H-glucose). (d) Labeling fraction of fructose-1,6-phosphate and 6-phosphogluconate after feeding 1-2H-glucose. Labeling fraction of fructose-1,6-phosphate reflects the labeling of glucose-6-phosphate, whose peak after addition of the 2H-glucose was not sufficiently resolved from other LC-MS peaks in HEK293T and MDA-MB-468 cells to allow precise quantitation of its labeling directly. The difference in the labeling fraction between glucose-6-phosphate and 6-phosphogluconate reflects the fraction of deuterium labeling specifically at position 1 of glucose-6-phosphate. (e) Due to the kinetic isotope effect, feeding of deuterium tracer can potentially alter pathway fluxes. To assess whether the feeding of 1-2H-glucose creates a bottleneck in the oxPPP, we measured the relative concentration of oxPPP intermediates with or without feeding of 1-2H-glucose. No significant changes were observed. (f) Impact of different mechanisms of correcting for the deuterium kinetic isotope effect on fractional contribution of oxPPP to NADPH production. (g) Impact of different mechanisms of correcting for the deuterium kinetic isotope effect on calculated total NADPH production rate. The correction mechanisms are (i) no kinetic isotope effect (CKIE = 1), (ii) no impact on total pathway flux but preferential utilization of 1H over 2H-labeled substrate (Eqn. 4 of main text) (the smallest reasonable correction, and the one applied in the main text), or (iii) full kinetic isotope effect observed for the isolate enzyme with associated decrease in total pathway flux (Eqn. M5 of Methods) (the largest reasonable correction). All results are mean ± SD, N ≥ 2 biological replicates from a single experiment and were confirmed in multiple experiments.
Extended Figure 2. Two independent measurement methods give consistent oxPPP fluxes.
(a) Diagram of 1-14C-glucose and 6-14C-glucose metabolism through glycolysis and pentose phosphate pathway. The oxPPP specifically releases glucose C1 as CO2, whereas all other CO2-releasing reactions are downstream of triose phosphate isomerase (TPI). As TPI renders C1 and C6 of glucose indistinguishable (both positions become C3 of glyceraldehyde-3-phosphate), the difference in CO2 release from C1 versus C6, multiplied by two, gives the absolute rate of NADPH production via oxPPP. A potential complication involves carbon scrambling via the reactions of the non-oxidative PPP, but this was insignificant (see Extended Figure 3). (b) Complete carbon labeling of glucose-6-phosphate. Glucose-6-phosphate labeled completely (> 99%) within 2 h of switching cells into U-13C- glucose. (c) CO2 release rate from1-14C-glucose and 6-14C-glucose. (d) Pool size of 6-phosphogluconate. (e) Kinetics of glucose-6-phosphate and 6-phosphogluconate labeling upon switching cells to U-13C-glucose. (f) Overlay upon the 6-phosphogluconate data from (e) of simulated labeling curves based on the flux that best fits the labeling kinetics (blue) (see Methods), and the flux from 14C-CO2 release measurements (green). (g) Calculated fluxes and 95% confidence intervals based on kinetics of 6-phosphogluconate labeling from U-13C- glucose, compared to radioactive CO2 release from 1-14C- glucose and 6-14C- glucose. The two approaches give consistent results, with the 14C-CO2 release data more precise. Mean ± SD, N=3.
Extended Figure 3. The extent of carbon scrambling via non-oxPPP is insufficient to impact substantially oxPPP flux determination using 1-14C and 6-14C-glucose, with most carbon entering oxPPP directed towards nucleotide synthesis.
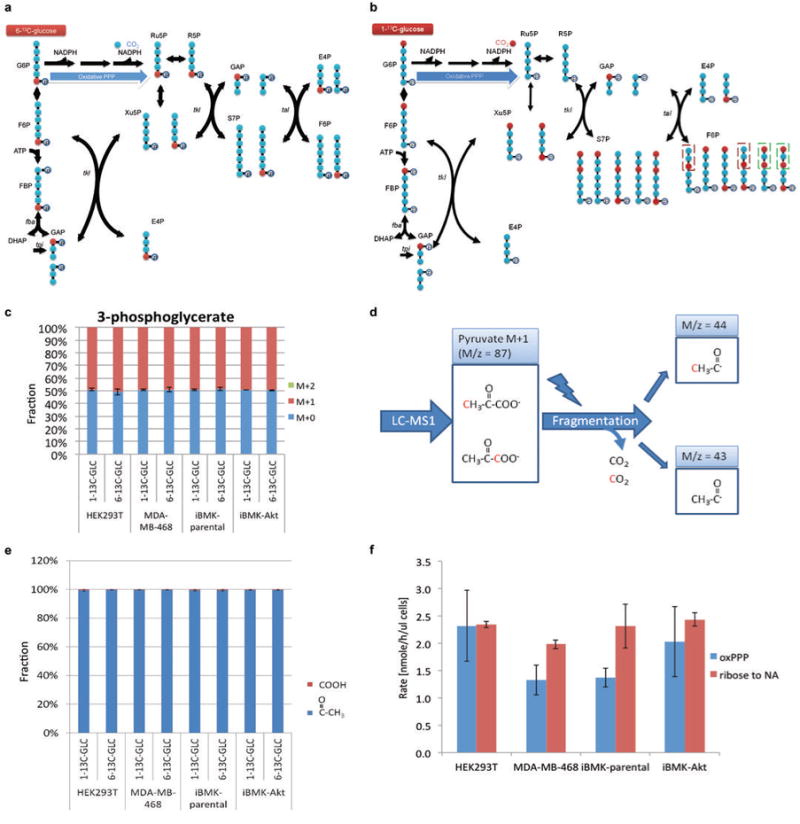
(a) Schematic of glycolysis and PPP showing fate of glucose C6. Note that glucose C6 occupies the phosphorylated position (i.e. last carbon) in every intermediate. Thus, upon catabolism to pyruvate, glucose C6 always becomes pyruvate C3, irrespective of any potential scrambling reactions. (b) Schematic of glycolysis and PPP showing fate of glucose C1. Glucose C1 can be scrambled via the non-oxPPP, moving to C3 (red boxes) or C6 as shown here. The forms shown in the green boxes were not experimentally observed. As glucose C3 becomes pyruvate C1 (the carboxylic acid carbon of pyruvate), which is selectively released as CO2 by pyruvate dehydrogenase, scrambling of C1 to C3 can potentially increase CO2 release from glucose C1 relative to C6. This is ruled out in panels (d) and (e). (c) Feeding 1-13C-glucose or 6-13C-glucose results in 50% labeling of 3-phosphoglycerate without any double labeling (i.e., M+2), as expected in the absence of scrambling. (d) MS/MS method to analyze positional labeling of 1-labeled pyruvate. Collision induced dissociation breaks pyruvate to release the carboxylic acid group as CO2. If the daughter peak of 1-labeled pyruvate does not contain labeled carbon (M/z = 43), the labeling is at the C1 position; otherwise, it is at C2 or C3. (e) After feeding 1-13C-glucose or 6-13C-glucose, pyruvate is not labeled at the C1 position (<0.5%), ruling out extensive scrambling. (f) OxPPP flux is similar to or smaller than ribose demand for nucleotide synthesis. Mean ± SD, N=3.
Extended Figure 4. Probing the contribution of alternative NADPH producing pathways.
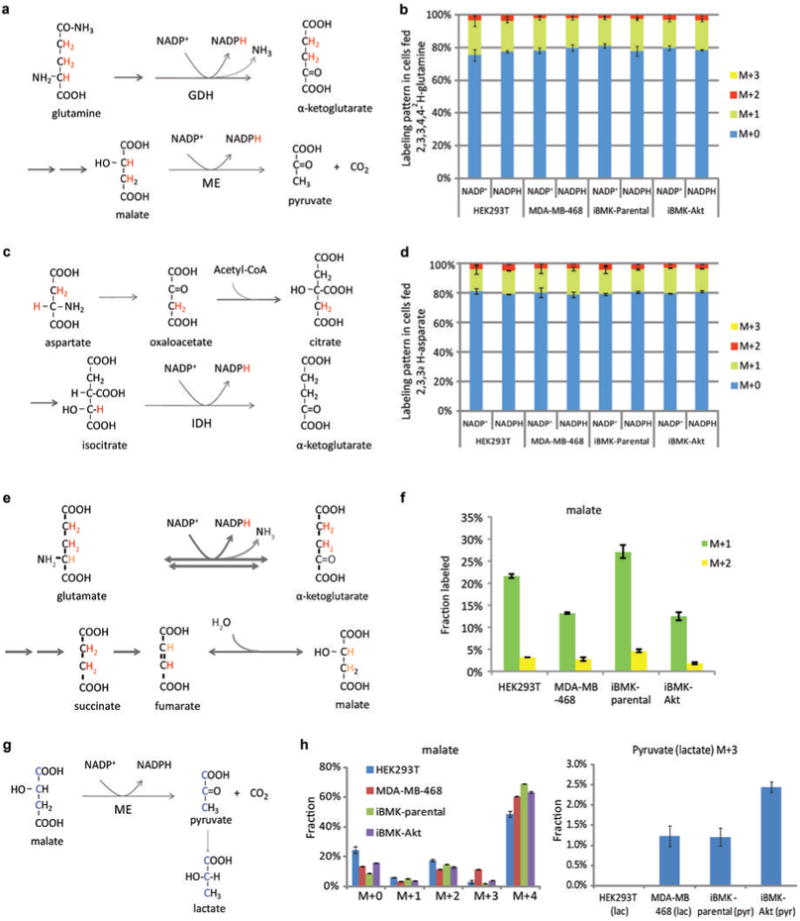
(a) Pathway diagram showing potential for 2,3,3,4,4-2H -glutamine to label NADPH via glutamate dehydrogenase and via malic enzyme. Labeled hydrogens are shown in red. (b) NADP+ and NADPH labeling patterns (without correction for natural 13C-abundance) after 48 h incubation with 2,3,3,4,4-2H-glutamine. The indistinguishable labeling of NADP+ and NADPH implies lack of NADPH redox active hydrogen labeling. (c) Pathway diagram showing potential for 2,3,3-2H-aspartate to label NADPH via isocitrate dehydrogenase. (d) NADP+ and NADPH labeling patterns (without correction for natural 13C-abundance) after 48 h incubation with 2,3,3-2H -aspartate. The indistinguishable labeling of NADP+ and NADPH implies lack of redox active hydrogen labeling. (e) Diagram of 2,3,3,4,4-2H-glutamine metabolism through TCA cycle, tracing labeled hydrogen. Hydrogen atoms of lighter shade indicate potential H/D exchange with water. (f) Malate labeling fraction after cells were fed 2,3,3,4,4-2H-glutamine for 48 h. (g) Pathway diagram showing potential for 1,2,3-13C-malate (made by feeding U-13C-glutamine) to label pyruvate and lactate via malic enzyme. (h) Extent of malate and pyruvate/lactate 13C-labeling. Cells were incubated with U-13C-glutamine for 48 h. M+3 pyruvate indicates malic enzyme flux, which may generate either NADH or NADPH. Similar results were obtained also for M+3 lactate, which was used as a surrogate for pyruvate in cases where lactate was better detected The corresponding maximal possible malic enzyme-driven NADPH production rate ranges, depending on the cell line, from < 2 nmol μL-1 h-1 to 6 nmol μL-1 h-1. Mean ± SD, N ≥ 2.
Extended Figure 5. Computational and experimental evidence for THF-dependent NADPH production.
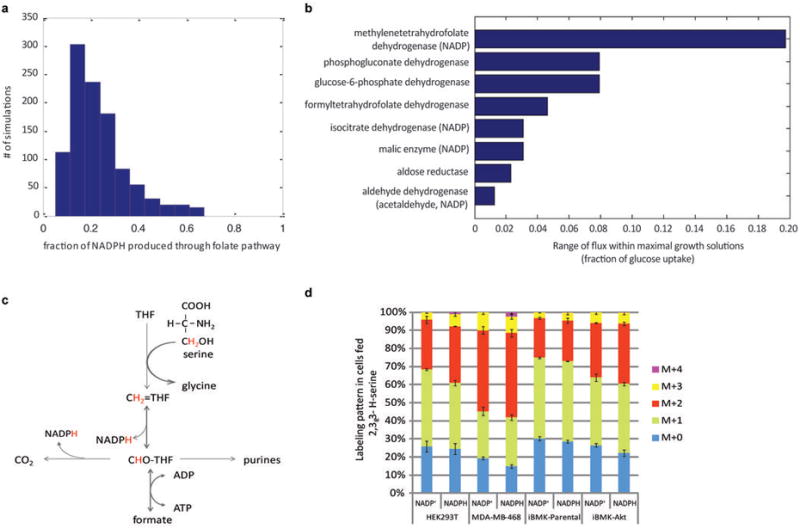
(a) Predicted contribution of folate metabolism to NADPH production based on flux balance analysis, using minimization of total flux as the objective function, across different biomass compositions. The biomass fraction of cell dry weight consisting of protein, nucleic acid, and lipid was varied as follows: protein 50% - 90% with a step size of 10%; RNA/DNA 3%-20% with step size of 1%, and lipids 3% - 20% with step size of 1% (considering only those combinations that sum to no more than 100%). With this range of physiologically possible biomass compositions, the model predicts a median contribution of folate metabolism of 24%. Note that with the constraint of experimentally measured biomass composition, yet without constraining the uptake rate of amino acids other than glutamine to be ≤ 1/3 of the glutamine uptake rate, the contribution of folate pathway to total NADPH production is predicted to be 23%. (b) Range of feasible flux through NADPH producing reactions in Recon1 model computed via Flux Variability Analysis under the constraint of maximal growth rate. As shown, the model predicts that each NADPH producing reaction can theoretically have zero flux, with all NADPH production proceeding through alternative pathways. Only reactions whose flux upper bound is greater than zero are shown. Reactions producing NADPH via a thermodynamically infeasible futile cycle were manually removed. As shown, among all NADPH producing reactions, MTHFD has the highest flux consistent with maximal growth. (c) Pathway diagram showing potential for 2,3,3-2H–serine to label NADPH via methylene tetrahydrofolate dehydrogenase. (d) NADP+ and NADPH labeling pattern after 48 h incubation with 2,3,3-2H-serine (no glycine present in the media). The greater abundance of more heavily labeled forms of NADPH relative to NADP+ indicates redox active hydrogen labeling. Results are mean ± SD, N ≥ 2 biological replicates from a single experiment and were confirmed in N ≥ 2 experiments. Based on the data in panel (d) the contribution of MTHFD1 to cytosolic NADPH production spans a broad range (10% - 40% of total cytosolic NADPH; the range is due to variation across cell lines, experimental noise, and the large KIE31). This range includes the flux calculated based on purine biosynthetic rate and 14C-CO2 release from serine (Figure 3d). Note that the total contribution of the cytosolic folate metabolism to NADPH production can exceed that of MTHFD1, as 10-formyl-THF dehydrogenase also produces NADPH.
Extended Figure 6. One-carbon units used in purine and thymidine synthesis are derived from serine.
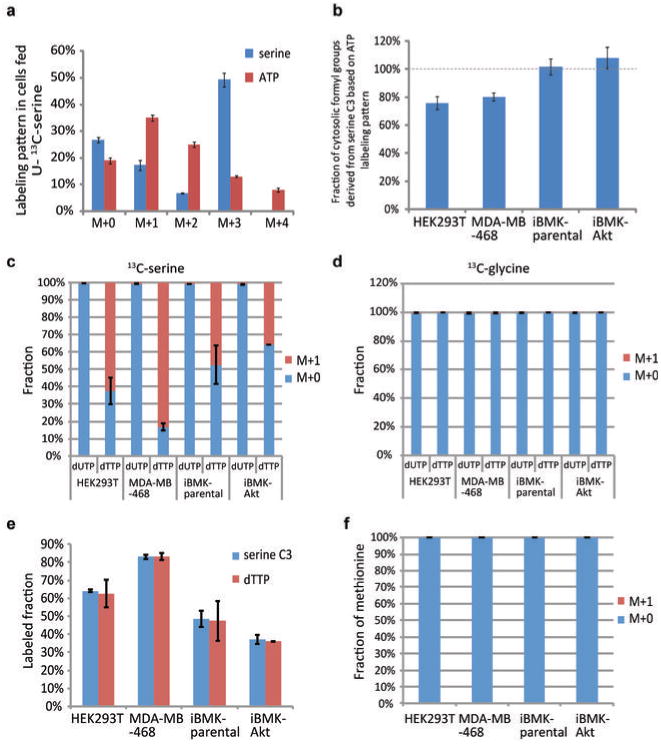
(a) Serine and ATP labeling pattern after 24 h incubation of HEK293T cells with U-13C-serine. The presence of M+1 to M+4 ATP indicates that serine contributes carbon to purines both through glycine and through one-carbon units derived from serine C3. (b) Quantitative analysis of cytosolic one-carbon unit labeling from measured the intracellular ATP, glycine, and serine labeling reveals that most cytosolic 10-formyl-THF assimilated into purines comes from serine. (c) U-13C- serine labels the methyl group that distinguishes dTTP from dUTP. (d) U-13C-glycine does not label dTTP. (e) The extent of dTTP labeling mirrors the extent of intracellular serine labeling. (f) Methionine does not label from U-13C-glycine. In all experiments, cells were grown in U-13C-serine or glycine for 48 h. Mean ± SD, N = 3.
Extended Figure 7. Measurement of CO2 release rate from serine and glycine by combination of 14C- and 13C-labeling.
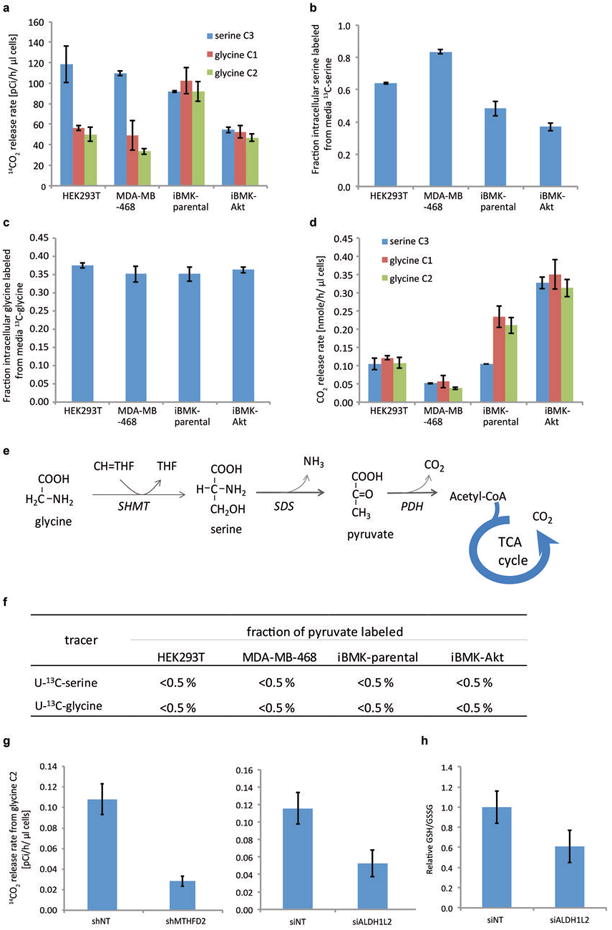
(a) 14C-CO2 release rate when cells are fed medium with a trace amount of 3-14C-serine, 1-14C-glycine or 2-14C-glycine. (b) Fraction of intracellular serine labeled in cells grown in DMEM media containing 0.4 mM 3-13C-serine in place of unlabeled serine. The residual unlabeled serine is presumably from de novo synthesis. (c) Fraction of intracellular glycine labeled in cells grown in DMEM medium containing 0.4 mM U-13C-glycine in place of unlabeled glycine. (d) CO2 release rates from serine C3, glycine C1 or C2. (e) Potential alternative pathway to metabolize glycine or serine into CO2, via pyruvate. (f) Pyruvate labeling fraction after 48 h labeling with U-13C-serine or U-13C-glycine. The lack of labeling in pyruvate indicates that serine and glycine are not metabolized through this pathway. (g) Knockdown of MTHFD2 or ALDH1L2 decreases CO2 release from glycine C2. (h) Knockdown of ALDH1L2 decreases the GSH/GSSG ratio. Mean ± SD, N=3.
Extended Figure 8. In the absence of serine, elevated concentrations of glycine inhibit cell growth and decrease the NADPH/NADP+ ratio.
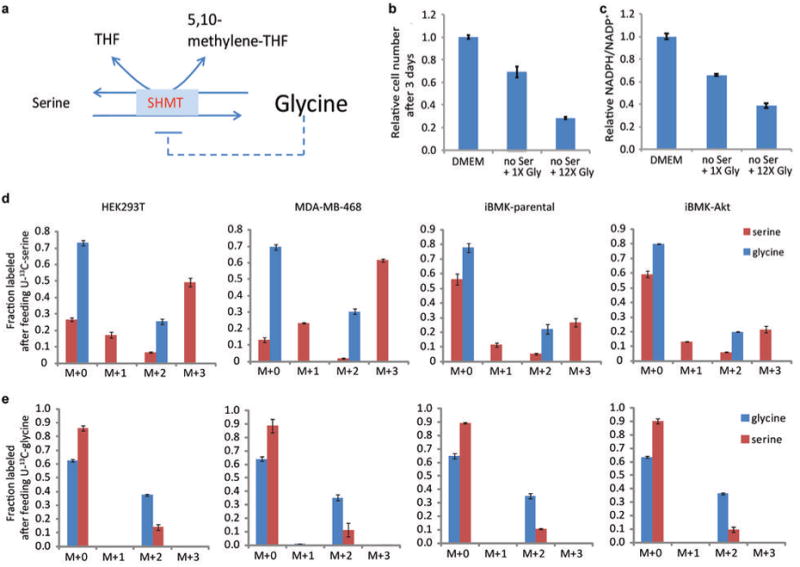
(a) Schematic of serine hydroxymethyltransferase reaction. High glycine may either inhibit forward flux (product inhibition) or drive reserve flux. (b) Relative cell number after culturing HEK293T cells for 3 days in regular DMEM, DMEM with no serine, and DMEM with no serine and 12.5-times the normal concentration of glycine (5 mM instead of 0.4 mM). (c) Relative NADPH/NADP+ ratio (normalized to cells grown in DMEM) after culturing HEK293T cell for 3 days in regular DMEM, DMEM with no serine, and DMEM with no serine and 12.5-times the normal concentration of glycine. (d), (e) Labeling of serine and glycine after feeding U-13C-serine or U-13C-glycine reveals reverse serine hydroxymethyltransferase flux. Mean ± SD, N=3.
Extended Figure 9. Quantitative analysis of NADPH consumption for biomass production and antioxidant defense.
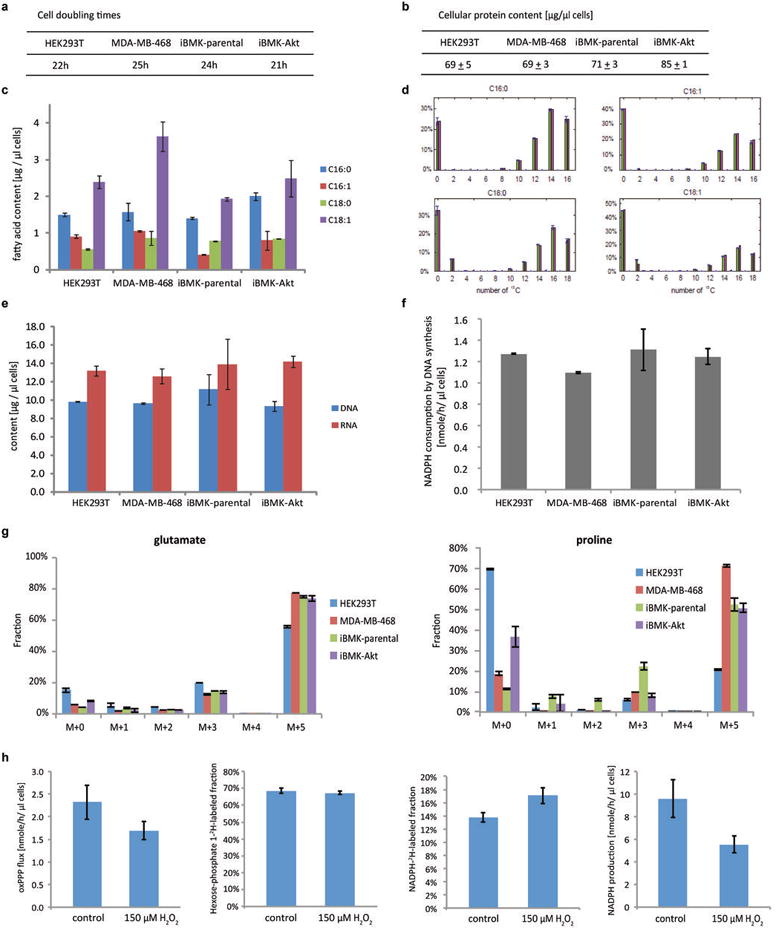
(a) Cell doubling times, which are inversely proportional to biomass production rates. (b) Cellular protein content. (c) Cellular fatty acid content (from saponification of total cellular lipid). (d) Quantitation of fatty acid synthesis versus import, with synthesis but not import requiring NADPH. HEK293T cells were cultured in U-13C-glucose and U-13C-glutamine until pseudo-steady state, and fatty acids saponified from total cellular lipids and their labeling patterns measured (green bars), and production versus import of each fatty acid was stimulated based on this experimental data. The fractional contribution of each route was determined by least square fitting, with the theoretical labeling pattern based on the elucidated routes shown (pink bars). Similar data were obtained also for MD-MBA-468, iBMK-parental, and iBMK-Akt cells (not shown) and used to calculate associated NADPH consumption by fatty acid synthesis. (e) Cellular DNA and RNA contents. (f) NADPH consumption by de novo DNA synthesis. (g) Proline and glutamate labeling patterns after 24 h in U-13C-glutamine media, which was used to quantitate different proline synthesis routes and associated NADPH consumption. (h) Quantitative analysis of cytosolic NADPH consumption in normally growing HEK293T cells (control) and non-growing cell under oxidative stress (150 μM H2O2, 5 h). Total cytosolic NADPH turnover was measured based on the absolute oxPPP flux divided by the fractional contribution of the oxPPP to total NADPH as measured using NADP2H formation from 1-2H-glucose. Mean ± SD, N=3.
Extended Figure 10. Confirmation of knockdown efficiency by western blot or Q-PCR.
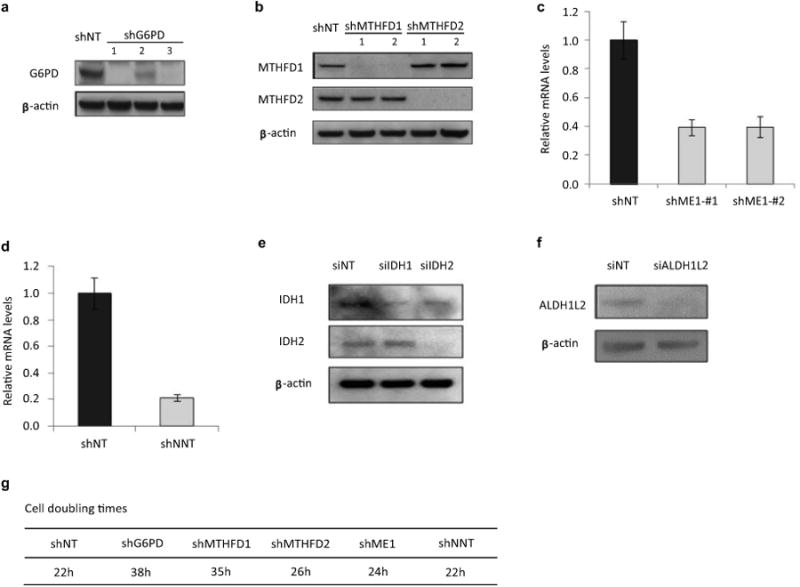
(a) Western blot for G6PD knockdown. (b) Western blot for MTHFD1 and MTHFD2 knockdown. (c) mRNA level for ME1 knockdown. (d) mRNA level for NNT knockdown. (e) Western blot for IDH1 and IDH2 knockdown. (f) Western blot for ALDH1L2 knockdown. (g) Cell doubling times of HEK293T with stable knockdown of indicated genes (results for different hairpins of the same gene were indistinguishable).
Acknowledgments
The iBMK parental and Akt cell lines were generously provided by Dr. Eileen White. The 14C labeled CO2 release experiments were conducted with the great help of Dr. Eric Suhand Dr. Hilary Coller. NMR measurement of formate was with help of Dr. Ian Lewis. We thank Dr. Hakim Djaballah and the High-Throughput Drug Screening Facility at MSKCC for supplying the hairpins, and Dr. Matthew Vander Heiden and his lab members for helpful discussions. This work was supported by Stand Up To Cancer and NIH R01 grants CA163591, AI097382, and CA105463, P01 grant CA104838, P50 grant GM071508. Jing Fan is a Howard Hughes Medical Institute (HHMI) international student research fellow. Jurre J. Kamphorst is a Hope Funds for Cancer Research fellow (HFCR-11-03-01).
Footnotes
Author Contributions: J.F. and J.D.R. conceived the study. J.F., J.Y., C.B.T., and J.D.R. designed the experiments. J.F., J.Y., and J.J.K. performed the experiments. T.S. and J.F. conducted the computational analyses. J.D.R. and J.F., assisted by J.Y., T.S. and C.B.T., wrote the manuscript.
Declaration of competing interests: The authors declare competing financial interests: details accompany the full-text HTML version of the paper at (url of journal website). The authors declare that they are bound by confidentiality agreements that prevent them from disclosing their financial interests in this work.
References
- 1.Voet DV, Voet JG. Biochemistry. 3rd. John Wiley & Sons; 2004. [Google Scholar]
- 2.Lee WN, et al. Mass isotopomer study of the nonoxidative pathways of the pentose cycle with [1,2-13C2] glucose. Am J Physiol. 1998;274:E843–851. doi: 10.1152/ajpendo.1998.274.5.E843. [DOI] [PubMed] [Google Scholar]
- 3.Metallo CM, Walther JL, Stephanopoulos G. Evaluation of 13C isotopic tracers for metabolic flux analysis in mammalian cells. J Biotechnol. 2009;144:167–174. doi: 10.1016/j.jbiotec.2009.07.010. [DOI] [PMC free article] [PubMed] [Google Scholar]
- 4.Fan TW, et al. Rhabdomyosarcoma cells show an energy producing anabolic metabolic phenotype compared with primary myocytes. Mol Cancer. 2008;7:79. doi: 10.1186/1476-4598-7-79. [DOI] [PMC free article] [PubMed] [Google Scholar]
- 5.Brekke EM, Walls AB, Schousboe A, Waagepetersen HS, Sonnewald U. Quantitative importance of the pentose phosphate pathway determined by incorporation of 13C from [2-13C]- and [3-13C] glucose into TCA cycle intermediates and neurotransmitter amino acids in functionally intact neurons. J Cereb Blood Flow Metab. 2012;32:1788–1799. doi: 10.1038/jcbfm.2012.85. [DOI] [PMC free article] [PubMed] [Google Scholar]
- 6.Lu W, et al. Metabolomic analysis via reversed-phase ion-pairing liquid chromatography coupled to a stand alone orbitrap mass spectrometer. Analytical chemistry. 2010;82:3212–3221. doi: 10.1021/ac902837x. [DOI] [PMC free article] [PubMed] [Google Scholar]
- 7.Circu ML, Maloney RE, Aw TY. Disruption of pyridine nucleotide redox status during oxidative challenge at normal and low-glucose states: implications for cellular adenosine triphosphate, mitochondrial respiratory activity, and reducing capacity in colon epithelial cells. Antioxid Redox Signal. 2011;14:2151–2162. doi: 10.1089/ars.2010.3489. [DOI] [PMC free article] [PubMed] [Google Scholar]
- 8.Shreve DS, Levy HR. Kinetic mechanism of glucose-6-phosphate dehydrogenase from the lactating rat mammary gland. Implications for regulation. The Journal of biological chemistry. 1980;255:2670–2677. [PubMed] [Google Scholar]
- 9.Price NE, Cook PF. Kinetic and chemical mechanisms of the sheep liver 6-phosphogluconate dehydrogenase. Arch Biochem Biophys. 1996;336:215–223. doi: 10.1006/abbi.1996.0551. [DOI] [PubMed] [Google Scholar]
- 10.Jiang P, Du W, Mancuso A, Wellen KE, Yang X. Reciprocal regulation of p53 and malic enzymes modulates metabolism and senescence. Nature. 2013;493:689–693. doi: 10.1038/nature11776. [DOI] [PMC free article] [PubMed] [Google Scholar]
- 11.Son J, et al. Glutamine supports pancreatic cancer growth through a KRAS-regulated metabolic pathway. Nature. 2013;496:101–105. doi: 10.1038/nature12040. [DOI] [PMC free article] [PubMed] [Google Scholar]
- 12.Duarte NC, et al. Global reconstruction of the human metabolic network based on genomic and bibliomic data. Proceedings of the National Academy of Sciences of the United States of America. 2007;104:1777–1782. doi: 10.1073/pnas.0610772104. [DOI] [PMC free article] [PubMed] [Google Scholar]
- 13.Degenhardt K, Chen G, Lindsten T, White E. BAX and BAK mediate p53-independent suppression of tumorigenesis. Cancer cell. 2002;2:193–203. doi: 10.1016/s1535-6108(02)00126-5. [DOI] [PubMed] [Google Scholar]
- 14.Folger O, et al. Predicting selective drug targets in cancer through metabolic networks. Mol Syst Biol. 2011;7:501. doi: 10.1038/msb.2011.35. [DOI] [PMC free article] [PubMed] [Google Scholar]
- 15.Tibbetts AS, Appling DR. Compartmentalization of Mammalian folate-mediated one-carbon metabolism. Annual review of nutrition. 2010;30:57–81. doi: 10.1146/annurev.nutr.012809.104810. [DOI] [PubMed] [Google Scholar]
- 16.Christensen KE, Mackenzie RE. Mitochondrial methylenetetrahydrofolate dehydrogenase, methenyltetrahydrofolate cyclohydrolase, and formyltetrahydrofolate synthetases. Vitamins and hormones. 2008;79:393–410. doi: 10.1016/S0083-6729(08)00414-7. [DOI] [PubMed] [Google Scholar]
- 17.Locasale JW, et al. Phosphoglycerate dehydrogenase diverts glycolytic flux and contributes to oncogenesis. Nature genetics. 2011;43:869–874. doi: 10.1038/ng.890. [DOI] [PMC free article] [PubMed] [Google Scholar]
- 18.Possemato R, et al. Functional genomics reveal that the serine synthesis pathway is essential in breast cancer. Nature. 2011;476:346–350. doi: 10.1038/nature10350. [DOI] [PMC free article] [PubMed] [Google Scholar]
- 19.Maddocks OD, et al. Serine starvation induces stress and p53-dependent metabolic remodelling in cancer cells. Nature. 2013;493:542–546. doi: 10.1038/nature11743. [DOI] [PMC free article] [PubMed] [Google Scholar]
- 20.Zhang WC, et al. Glycine decarboxylase activity drives non-small cell lung cancer tumor-initiating cells and tumorigenesis. Cell. 2012;148:259–272. doi: 10.1016/j.cell.2011.11.050. [DOI] [PubMed] [Google Scholar]
- 21.Nilsson R, et al. Metabolic enzyme expression highlights a key role for MTHFD2 and the mitochondrial folate pathway in cancer. Nature communications. 2014;5:3128. doi: 10.1038/ncomms4128. [DOI] [PMC free article] [PubMed] [Google Scholar]
- 22.Ayromlou H, Hajipour B, Hossenian MM, Khodadadi A, Vatankhah AM. Oxidative effect of methotrexate administration in spinal cord of rabbits. JPMA The Journal of the Pakistan Medical Association. 2011;61:1096–1099. [PubMed] [Google Scholar]
- 23.Bradley KK, Bradley ME. Purine nucleoside-dependent inhibition of cellular proliferation in 1321N1 human astrocytoma cells. The Journal of pharmacology and experimental therapeutics. 2001;299:748–752. [PubMed] [Google Scholar]
- 24.Tedeschi PM, et al. Contribution of serine, folate and glycine metabolism to the ATP, NADPH and purine requirements of cancer cells. Cell Death Dis. 2013;4:e877. doi: 10.1038/cddis.2013.393. [DOI] [PMC free article] [PubMed] [Google Scholar]
- 25.Ye J, et al. Pyruvate kinase M2 promotes de novo serine synthesis to sustain mTORC1 activity and cell proliferation. Proc Natl Acad Sci U S A. 2012;109:6904–6909. doi: 10.1073/pnas.1204176109. [DOI] [PMC free article] [PubMed] [Google Scholar]
- 26.Chaneton B, et al. Serine is a natural ligand and allosteric activator of pyruvate kinase M2. Nature. 2012;491:458–462. doi: 10.1038/nature11540. [DOI] [PMC free article] [PubMed] [Google Scholar]
- 27.Anastasiou D, et al. Inhibition of pyruvate kinase M2 by reactive oxygen species contributes to cellular antioxidant responses. Science. 2011;334:1278–1283. doi: 10.1126/science.1211485. [DOI] [PMC free article] [PubMed] [Google Scholar]
- 28.Jain M, et al. Metabolite profiling identifies a key role for glycine in rapid cancer cell proliferation. Science. 2012;336:1040–1044. doi: 10.1126/science.1218595. [DOI] [PMC free article] [PubMed] [Google Scholar]
- 29.Warburg O. On the origin of cancer cells. Science. 1956;123:309–314. doi: 10.1126/science.123.3191.309. [DOI] [PubMed] [Google Scholar]
- 30.Vander Heiden MG, Cantley LC, Thompson CB. Understanding the Warburg effect: the metabolic requirements of cell proliferation. Science. 2009;324:1029–1033. doi: 10.1126/science.1160809. [DOI] [PMC free article] [PubMed] [Google Scholar]
- 31.Pawelek PD, MacKenzie RE. Methenyltetrahydrofolate cyclohydrolase is rate limiting for the enzymatic conversion of 10-formyltetrahydrofolate to 5,10-methylenetetrahydrofolate in bifunctional dehydrogenase-cyclohydrolase enzymes. Biochemistry. 1998;37:1109–1115. doi: 10.1021/bi971906t. [DOI] [PubMed] [Google Scholar]
- 32.Mathew R, Degenhardt K, Haramaty L, Karp CM, White E. Immortalized mouse epithelial cell models to study the role of apoptosis in cancer. Methods Enzymol. 2008;446:77–106. doi: 10.1016/S0076-6879(08)01605-4. [DOI] [PubMed] [Google Scholar]
- 33.Munger J, et al. Systems-level metabolic flux profiling identifies fatty acid synthesis as a target for antiviral therapy. Nat Biotechnol. 2008;26:1179–1186. doi: 10.1038/nbt.1500. [DOI] [PMC free article] [PubMed] [Google Scholar]
- 34.Lemons JM, et al. Quiescent fibroblasts exhibit high metabolic activity. PLoS Biol. 2010;8:e1000514. doi: 10.1371/journal.pbio.1000514. [DOI] [PMC free article] [PubMed] [Google Scholar]
- 35.Melamud E, Vastag L, Rabinowitz JD. Metabolomic analysis and visualization engine for LC-MS data. Anal Chem. 2010;82:9818–9826. doi: 10.1021/ac1021166. [DOI] [PMC free article] [PubMed] [Google Scholar]
- 36.Millard P, Letisse F, Sokol S, Portais JC. IsoCor: correcting MS data in isotope labeling experiments. Bioinformatics. 2012;28:1294–1296. doi: 10.1093/bioinformatics/bts127. [DOI] [PubMed] [Google Scholar]
- 37.Yuan Z, Hammes GG. Elementary steps in the reaction mechanism of chicken liver fatty acid synthase. pH dependence of NADPH binding and isotope rate effect for beta-ketoacyl reductase. The Journal of biological chemistry. 1984;259:6748–6751. [PubMed] [Google Scholar]
- 38.Yuan J, Bennett BD, Rabinowitz JD. Kinetic flux profiling for quantitation of cellular metabolic fluxes. Nat Protoc. 2008;3:1328–1340. doi: 10.1038/nprot.2008.131. [DOI] [PMC free article] [PubMed] [Google Scholar]
- 39.Eruslanov E, Kusmartsev S. Identification of ROS using oxidized DCFDA and flow-cytometry. Methods Mol Biol. 2010;594:57–72. doi: 10.1007/978-1-60761-411-1_4. [DOI] [PubMed] [Google Scholar]
- 40.Lorans G, Phang JM. Proline synthesis and redox regulation: differential functions of pyrroline-5-carboxylate reductase in human lymphoblastoid cell lines. Biochem Biophys Res Commun. 1981;101:1018–1025. doi: 10.1016/0006-291x(81)91850-7. [DOI] [PubMed] [Google Scholar]


