

Abstract
While nanoparticles occur naturally in the environment and have been intentionally used for centuries, the production and use of engineered nanoparticles has seen a recent spike, which makes environmental release almost certain. Therefore, recent efforts to characterize the toxicity of engineered nanoparticles have focused on the environmental implications, including exploration of toxicity to organisms from wide-ranging parts of the ecosystem food webs. Herein, we summarize the current understanding of toxicity of engineered nanoparticles to representatives of various trophic levels, including bacteria, plants, and multicellular aquatic/terrestrial organisms, to highlight important challenges within the field of econanotoxicity, challenges that analytical chemists are expertly poised to address.
Nanotechnology has provided a basis for innovation in a wide range of fields, from pharmaceuticals to athletic gear, and has resulted in an exponential increase in both the deployment of nanotechnologies in products along with the development of novel materials.1,2 Nanoparticles’ unique size-dependent physicochemical properties are often the reason for their increased use in products; however, these same unique properties have prompted concern that unique physiological responses will be elicited in living systems by interaction with these materials. Accordingly, much work on the biological implications of this interaction, both intended and unintended (i.e., toxicity), have been examined using a suite of in vitro and in vivo studies to characterize the bionanointerface.3–7 As the global production and use of nanoparticles increases, estimated to be thousands of tons in 20048 and projected to grow to over half a million tons by 2020,9,10 it is almost certain that engineered nanoparticles will be released into the environment. So, while the majority of studies to date have focused on human health implications of nanoparticles, many recent efforts consider the ecological implications of nanoparticles, including the fate, transport, and toxicity, to promote sustainable use of these novel materials.11–13 These efforts have advanced significantly in recent years and warrant new consideration.
Though nanoparticles occur naturally in the environment (i.e., as minerals, clays, and products of bacteria) and have been intentionally used for centuries (e.g., as finely divided metal colorants), the systematic design and engineering of nanoscale materials has only occurred in the last few decades. Much work in today’s studies of engineered nanoparticle transformation, fate, and toxicity is based on previous work in the colloids community, focused on naturally occurring colloids such as inorganic minerals (e.g., Fe2O3), organic biopolymers (e.g., dissolved organic matter), and microorganisms on the submicrometer scale.14 The previous studies of naturally occurring colloids have centered on their fate and transformation, including their role in atmospheric chemistry15 and in the transport of micropollutants such as potentially toxic metals.16 Engineered nanoparticles are composed of a much wider variety of materials and occur in monodisperse sizes and shapes with a suite of synthetic surface molecules, distinct from naturally occurring materials; this has prompted the colloids community to consider more strongly the impact of engineered nanoscale particles on ecosystem health in the emergent field of nanotoxicology.
Econanotoxicity studies have sought to describe the toxicity of nanoparticles to ecosystems, often within modeled laboratory systems or, in a small number of cases, within mesocosms. Herein, we summarize and analyze the current body of literature focused on the toxicity of engineered nanoparticles on various levels of the food web, going beyond previous reviews that had a narrower focus on specific classes of nanomaterials and/or model systems.17–19 Consideration will also be given to the transformation of nanoparticles as they enter the environment, which has been reviewed recently in detail.20,21 Through this broad analysis of econoanotoxicity studies, we aim to illuminate gaps in the econanotoxicity literature where the expertise of analytical chemists can advance this interdisciplinary field.
ENGINEERED NANOPARTICLES IN THE ENVIRONMENT
Though the number of commercial and manufactured products containing nanoparticles is growing and novel nanoparticles are continually developed, only a few materials are currently used in a large number of products or in high volume; therefore, only a small subset of nanomaterials are currently being released or will likely be released to the environment in the coming decades. These include silver, titanium dioxide, zinc oxide, silica, and carbon-based nanomaterials (single-walled carbon nanotubes (SWCNTs), multiwalled carbon nanotubes (MWCNTs), and fullerenes);22 accordingly, these nanomaterials are the main focus of studies within the current econanotoxicology literature. It should be noted that this list of materials is not exhaustive and other materials in the future may be released in high volumes.
There are various entry points for engineered nanomaterials into the environment, including direct application to an environmental compartment (either intentionally or through unintentional product degradation), wastewater treatment plant (WWTP) effluent, and WWTP sludge;23,24 yet, it is difficult to estimate the relevant concentrations of nanoparticles that will be released at any given time. Some of the difficulty in predicting relevant concentrations of nanoparticle release is the result of limited data on current and future nanoparticle prevalence in commercial products.21,25 Additionally, transformations of nanomaterials, such as dissolution, agglomeration, sedimentation, or change of surface moieties, could greatly affect the pathway and extent of environmental release. A number of risk assessment efforts have been made to model and calculate predicted environmental concentrations (PECs) of nanoparticles with the current understanding of nanoparticle transformations and fate,2,23,26–31 along with a few experimental approaches to examine nanoparticle fate under natural conditions.31,32 A summary of the PECs is found in Table 1, with ranges including the lowest and highest PECs reported in the literature, and it should be noted that these values are sometimes calculated considering all species of the material (e.g., Ag2S, Ag+, and Ag nanoparticles) and other times considering simply the expected predominant form.
Table 1.
Predicted Environmental Concentrations (PECs) of Highly Produced and Used Nanoparticles in Three Major Pathways in the Environmenta
| nanoparticle | PEC, pathway into environment | ref |
|---|---|---|
| Ag | 0.088–10 000 ng/L, surface water | 23, 25, 26, 28 |
| 0.0164–17 μg/L, WWTP effluent | 26, 28 | |
| 1.29–39 mg/kg, WWTP sludge | 26, 28 | |
| TiO2 | 21–10 000 ng/L, surface water | 2, 23, 25, 26, 29, 30 |
| 1–100 μg/L, WWTP effluent | 26, 31, 32 | |
| 100–2000 mg/kg, WWTP sludge | 26, 30, 31 | |
| ZnO | 1–10 000 ng/L, surface water | 26 |
| 0.22–1.42 μg/L, WWTP effluent | 26 | |
| 13.6–64.7 mg/kg, WWTP sludge | 26 | |
| carbon-based | 0.001–0.8 ng/L, surface water | 23, 26 |
| 3.69–32.66 ng/L, WWTP effluent | 26 | |
| 0.0093–0.147 mg/kg, WWTP effluent | 26 |
WWTP: wastewater treatment plant.
The compilation of PECs in Table 1 highlights some important considerations for analytical chemists within the field. First, there is a large dynamic range for individual types of nanoparticles that requires important method development to capture accurate environmental release of nanoparticles. The challenges with assessment in a large dynamic range are compounded by differences in the complex environmental matrixes, which also necessitates the development of sensitive tools for quantification of release, an area in which analytical chemists can contribute. Finally, the PEC ranges in Table 1 include all species of a material; however, the field would be greatly advanced with detailed characterization of the oxidation state of the nanoparticles, or transformed nanoparticle state, because there are important toxicological implications for various oxidation states (e.g, Hg2+ is more toxic than Hg33). This understanding of nanoparticle release behavior is dominated by theoretical modeling; the scientific community would be well served if nanotoxicologists did collaborative work with experts in experimental ecosystem models. These models would facilitate more realistic PECs, especially if scientists could make better assessment of nanoparticle release into the ecosystem. It is clear that real-time measurement of nano-particle environmental release necessitates important methodological and technological advancements capable of dealing with complex matrixes, a large nanoparticle concentration range, and evolving primary nanoparticle characteristics.
NANOPARTICLE TRANSFORMATIONS
From the body of literature, it is clear that nanoparticles are transformed from their original, synthesized state no matter the type, amount, or pathway of environmental nanoparticle release, which follows from their high reactivity. Transformations are the result of a myriad of processes, including aggregation/agglomeration, redox reactions, dissolution, exchange of surface moieties, and reactions with biomacromolecules. These dynamic transformations in turn affect the transport, fate, and toxicity of nanoparticles in the environment, making it critical to understand and characterize these transformations. Numerous reviews have given detailed description of the status quo analytical tools utilized to measure nanoparticle characteristics,3–5,34 and thus, these will not be discussed herein. Rather, trends in nanoparticle aggregation, surface molecule transformations, and speciation/dissolution under environmental conditions will be the focus of this section. Typically, environmental conditions are simulated in the laboratory by modeling ionic strength and natural organic matter (NOM) content, two key characteristics in nanoparticle transformation in aqueous solutions; however, some work monitoring transformations in reconstructed mesocosms, such as freshwater wetlands35 or wastewater treatment plants (WWTPs),32 has been performed. Mesocosms better simulate nanoparticle transformations in natural environments, but there are limited analytical techniques for quantifying nanoparticle transformations, which may have implications for their toxicity, in these complex matrices. Tools for in situ nanoparticle characterization are critical for a better understanding of toxicity within complex mesocosm studies.
The size of nanoparticles is an important determinant of reactivity, transport, and toxicity. While toxicology studies commonly characterize the primary particle size, typically using electron microscopy, nanoparticles tend to interact with environmental systems as aggregates. Light scattering techniques are most commonly employed to study stability of nanoparticles in solution5 or as an aerosol.36 While systematic studies of aggregation of engineered nanoparticles in soil have not been completed, one technique used is scanning electron microscopy (SEM) to study nanoparticle aggregates sorbed onto soil particles.37 Within solutions, there are some notable aggregation trends observed no matter the nanomaterial. First, increasing ionic strength increases the rate and extent of aggregation of most nanomaterials,38,39 and the ionic species has some effect on the extent of aggregation.20,39,40 Intentionally modifying the surface of nanoparticles can prevent or enhance the effect of ionic strength on aggregation as demonstrated by Badawy et al. with Ag nanoparticles that were “bare”, citrate-, PVP (polyvinylpyrrolidone)-, or BPEI (branched polyethyleneimine)-capped, where steric hindrance and electrostatic repulsion prevented aggregation of PVP- and BPEI-capped Ag nanoparticles.39
Besides ionic strength, the presence of NOM and other biomacromolecules (e.g., extracellular polymeric substances) plays a key role in determining the aggregation state of nanoparticles. NOM is a ubiquitous, and poorly defined, component of environmental systems consisting of high molecular weight humic and fulvic acids resulting from plant and animal material decomposition that readily sorbs onto the highly reactive surface of nanomaterials.41 Typically, NOM displaces weakly bound capping agents and forms a dynamic, heterogeneous layer of molecules42 similar to the “protein corona” that has been the focus of many biological toxicity studies.43 With respect to aggregation, the presence of biomacromolecules has had varied effects. There is significant evidence that, in the presence of NOM, nanoparticles are stabilized and aggregation is limited at realistic NOM concentrations (1–30 mg of carbon/L),40,44 but flocculation is observed at higher NOM concentrations.45 Other molecules, like extracellular polymeric substance (i.e., a bacterial secretion containing polysaccharides and proteins), cause an increase in nanoparticle aggregation rate,46 while still other molecules like cysteine, a component of proteins and NOM, cause an initial increase in the aggregation rate but not in the long term aggregate size.47 Understanding aggregation is critical for characterizing transport of nanoparticles through environmental compartments; for example, less aggregation yields lower rates of sedimentation and greater mobility. In addition, understanding the interaction of nanoparticles under natural conditions (e.g., salinities, pH, and molecular species) enables a better assessment of exposure and transport.
These aggregation studies bring to light the importance of the nanoparticle surface and localized environment around that surface to transformation of the material. As alluded to previously, NOM is of particular importance in this respect because of its pervasiveness throughout the environment. While it clearly plays a role in the aggregation dynamics, NOM is itself dynamic, with an undefined molecular structure and a variety of reactive moieties; therefore, its sorption onto nanoparticle surfaces may aid transformations beyond aggregation, such as surface reduction, where NOM can reduce ionic metals at a nanoparticle surface to increase nanoparticle size.48 Other molecules at the nanoparticle surface, such as fatty acids,49 can also influence nanoparticle transformation. In addition to organic molecules (e.g., NOM, proteins, carbohydrates), potentially toxic metal ions also have the ability to adsorb onto the nanoparticle surface, increasing the transport and toxicity effects of metal atoms but also prompting the use of nanoparticles in remediation of potentially toxic metal pollutants.50
Beyond sorption of molecules/atoms, the transformation of the nanomaterial itself into other species plays a role in the toxicity assessment. For example, the dissolution of Ag nanoparticles (Ag(0) to Ag+), is responsible for the antimicrobial nature of Ag nanoparticles,51 and therefore, understanding this speciation, studied primarily using atomic spectroscopy, is important for assessing econanotoxicity. However, the surface of Ag nanoparticles, in addition to surface adsorption of NOM and other macromolecules, is susceptible to reaction with oxygen and sulfur atoms, making it unlikely that Ag(0) is the primary species at the nanoparticle surface.20 Likewise, free dissolved Ag+ is unlikely to be present in large concentrations, as many naturally occurring compounds have a propensity to complex Ag+. Scientists working in this field must resist oversimplifying conclusions regarding speciation as it will certainly invalidate translation of their results into real, complex environments. Other nanoparticles (e.g., Au, ZnO, and CuO)52 experience similar speciation either in the dissolution to ions or chemical reactions that, in turn, could affect other physicochemical changes in the nanoparticles and ultimately, nanoparticle fate and toxicity. Greater attention to nanoparticle speciation is necessary within the nanotoxicity literature in order to identify nanospecific toxicity.
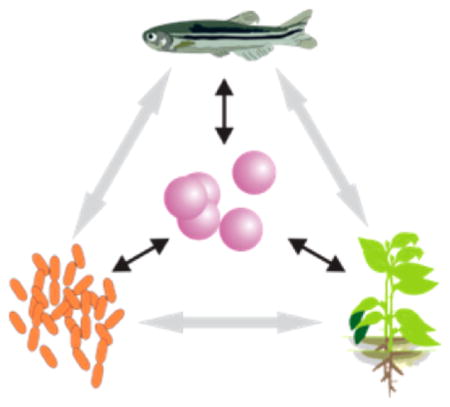
The importance of the nanoparticle state on subsequent transport and toxicity, complicated by the interplay between different, dynamic nanoparticle transformations (Figure 1), necessitates careful, time-dependent in situ characterization of nanoparticles in environmentally relevant conditions. Current analytical methods yield limited insight into a subset of these transformations; development of sensitive, in situ characterization tools, a strength of the analytical chemistry community, would significantly advance this field.
Figure 1.
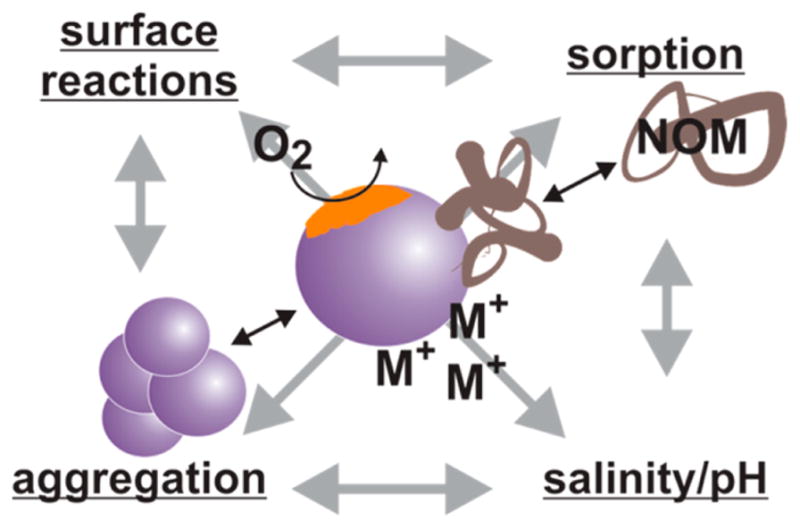
Illustration of the dynamic transformations nanoparticles undergo in the body or the environment (black arrows) and the interplay (as illustrated by gray arrows) between these transformations.
CASE STUDY: TOXICITY TO FOOD WEB MEMBERS
As the measurement of all the processes in Figure 1 remains a challenge, particularly speciation of metals according to their oxidation state and ligand environment, so too does the determination of the impacts of engineered nanomaterials on living organisms, all the way from single cells to human communities. We consider here the work that has been done thus far to follow the toxicity effects of engineered nanomaterials on the various members of the food web, including bacteria, plants, and multicellular aquatic/terrestrial organisms in order to better understand the generalized toxicological conclusions while also illuminating gaps within the field.
BACTERIA
Bacteria act as components of the base of the food web and serve integral environmental functions. They are ubiquitous members of ecosystems with particular importance in global nutrient cycling. This ecological import along with the relative ease of culture has made bacteria a primary focus of econanotoxicity studies to date, including use of a wide range of model organisms and toxicity assays to assess the impacts of nanoparticles. Algae are also important, low trophic-level members of aquatic systems and are critical in photosynthesis and as food sources; however, since the methods of nanotoxicity study are similar to those of bacteria and the literature is limited compared to that of bacteria, algal nanotoxicity will not be discussed herein.
Bacterial model choices for nanotoxicity studies vary greatly and have included common research species such as Escherichia coli,53 Bacillus subtilis,54 and Pseudomonas aeruginosa55 along with bacteria that play key roles within environmental compartments, such as Nitrosomonaseuropaea56,57 (nitrifying bacteria with a role in wastewater treatment). The breadth of choices in these monoculture systems is wide, which has led to some challenges within the field in generalizing experimental results. That is, many studies have utilized common microbial species that may not be likely to come in contact with nanoparticles in the environment, while more environmentally relevant species have been considered less thoroughly. To overcome this issue, some research groups have pursued toxicity studies on naturally sampled bacteria.58–60 Natural isolates increase the complexity of the model system, providing environmental relevancy; however, these community-based studies are typically limited in their ability to elucidate mechanisms of toxicity because individual species functions are not separated from the response of the whole. Contributions from analytical chemists may be able to address this issue. For example, surface-enhanced Raman spectroscopy has been successfully applied to detect pathogenic bacteria and in the future may be able to both identify (and therefore distinguish) bacteria and observe changes in outer membrane composition following nanomaterial exposure.61
While there is a large body of evidence that nanoparticles are internalized by a variety of mammalian cells, bacterial cell uptake of nanomaterials is yet unclear. Few systematic studies have been reported that measure rates and intracellular locations of nanoparticles in bacteria and those that have been reported conflict with each other. Some studies suggest that internalization of nanoparticles does occur;53,62 however, other studies have indicated that there may be adsorption of nanoparticles to membranes or association of nanoparticles near the bacteria, without internalization.63,64 For the studies that report internalization of nanoparticles by bacteria, no mechanistic explanation is pursued; the current consensus within the field is that nanoparticles typically do not cross the bacterial cell membrane.
Much of the current understanding of bacterial nanotoxicity has been informed by analysis of bacterial viability and growth, using methods such as colony forming unit assays and optical density measurements to create growth curves or calculate minimum inhibitory concentrations. Morphological changes and reactive oxygen species generation have also been commonly observed using electron microscopy and fluorescent probes, respectively. These techniques have been used to assess bacterial response to nanoparticle exposure as a function of nanoparticle dose, agglomeration state, surface modifications (e.g., engineered surface coatings and natural transformations in the environment), and external environmental conditions (e.g., UV light exposure and interaction with NOM). Table 2 provides an overview of the monoculture bacterial model systems and assays that have been used in the literature. Traditional microbiological assays still dominate toxicity assessments in the bacterial nanotoxicity literature. While these assays provide valuable information, continued development of more sensitive and quantitative spectroscopic and -omic methods (genomic, proteomic, metabolomic), spurred by the analytical chemistry community, will significantly advance our understanding of bacterial nanotoxicity. Less common methods to assess the bacteria-nanoparticle interaction have included FT-IR for metabolic profiling of changes in functional groups,65 mass spectrometry to characterize the binding of nanoparticles to bacterial surface proteins,66 and genetic methods such as quantitative-PCR67 to observe targeted gene expression and terminal restriction fragment length polymorphism (T-RFLP) to assess community composition of naturally sampled bacterial isolates.58 In general, bacterial nanotoxicity studies have fallen into one of two camps: those utilizing monoculture model systems versus those utilizing natural bacteria isolates.
Table 2.
Bacterial Monoculture Models Used in Nanotoxicity Studies and the Nanoparticles and Methods of Toxicity Analyzeda
| bacteria model | nanoparticle | dose range | assay(s) | refs |
|---|---|---|---|---|
| Escherichia coli | Ag | 0.025–158 mg/L | CFU, growth (OD), liquid-to-plate (colony area), viability (LIVE/DEAD Baclight and diameter of inhibition zone in disk diffusion), minimum inhibitory concentration (OD), β-galactosidase activity (MetPLATE bioassay) | 51, 68–70 |
| TiO2 | 0.01–500 mg/L | CFU, ROS (H2DCFDA, XTT, p-chlorobenzoic acid, furfuryl alcohol), β-galactosidase activity (MetPLATE bioassay), growth (OD), viability (LIVE/DEAD BacLight) | 70–73 | |
| ZnO | 0.01–500 mg/L | CFU, ROS (XTT, p-chlorobenzoic acid, furfuryl alcohol), viability (LIVE/DEAD BacLight), β-galactosidase activity (MetPLATE bioassay) | 70, 71, 74–76 | |
| CeO2 | 5–150 mg/L | CFU, ROS (XTT, p-chlorobenzoic acid, furfuryl alcohol), disk diffusion, MIC, viability (LIVE/DEAD BacLight) | 54, 71 | |
| nC60 | 1–342 mg/L | CFU, MIC, ROS (XTT, furfuryl alcohol, 2-chlorophenol), lipid peroxidation, protein oxidation | 77, 78 | |
| CuO | 0.01–350 mg/L | CFU, ROS (XTT, p-chlorobenzoic acid, furfuryl alcohol), bioluminescence changes | 71, 76, 79 | |
| Al2O3 | 5–500 mg/L | CFU, ROS (H2DCFDA, XTT, p-chlorobenzoic acid, furfuryl alcohol), viability (LIVE/DEAD BacLight) | 71, 73 | |
| Fe2O3 | 5 and 100 mg/L | CFU, ROS (XTT, p-chlorobenzoic acid, furfuryl alcohol), nanoparticle adsorption to cells (ICP-OES) | 71, 80 | |
| SiO2 | 5 mg/L | CFU, ROS (XTT, p-chlorobenzoic acid, furfuryl alcohol) | 71 | |
| CdSe QDs | 0.01–100 mg/L | β-galactosidase activity (MetPLATE bioassay) | 70 | |
| NiO | 0–350 mg/L | CFU | 76 | |
| Sb2O3 | 0–350 mg/L | CFU | 76 | |
| MWCNT | 10–100 mg/L | viability (LIVE/DEAD BacLight), ROS (H2DCFDA) | 73 | |
| Bacillus subtilis | CeO2 | 50–150 mg/L | disk diffusion, MIC, CFU, viability (LIVE/DEAD BacLight) | 54 |
| nC60 | 1–342 mg/L | MIC (OD), CFU, ROS production, lipid peroxidation, protein oxidation | 77, 78 | |
| ZnO | 2 μg/mL-500 mg/L | CFU, viability (LIVE/DEAD BacLight) | 74, 76 | |
| CuO | 0–350 mg/L | CFU | 76 | |
| NiO | 0–350 mg/L | CFU | 76 | |
| Sb2O3 | 0–350 mg/L | CFU | 76 | |
| Ag | 0.025–50 mg/L | growth (OD), CFU, liquid-to-plate (colony area), viability (disk diffusion, LIVE/DEAD BacLight) | 68, 69 | |
| Vibrio fischeri | fullerene | 0.5–2.5 mg/L | respiration (bioluminescence), ROS production (2-chlorophenol degradation) | 81 |
| TiO2 | ≤20 g/L | CFU, kinetic bioluminescence inhibition (Flash assay using luminometer) | 82 | |
| CuO | ≤200 mg/L | CFU, kinetic bioluminescence inhibition (Flash assay using luminometer) | 82 | |
| ZnO | ≤100 mg/L | CFU, kinetic bioluminescence inhibition (Flash assay using luminometer) | 82 | |
| Nitrosomonas europaea | CdSe/ZnS QDs | 10–100 nM | MIC (OD), ROS production (H2DCFDA), transcriptome analysis | 67 |
| Ag | 0.2–20 mg/L | nitrification activity (nitrite production observed with NitriVer 3 Reagents), membrane integrity (LIVE/DEAD BacLight), select gene expression (qRT-PCR) | 56 | |
| Shewanella oneidensis | CeO2 | 50–150 mg/L | disk diffusion, MIC, CFU, Viability (LIVE/DEAD BacLight) | 54 |
| Cu-doped TiO2 | 20 mg/L | CFU, select gene expression (qRT-PCR) | 83 | |
| ZnO | 2–40 mg/L | cell density, (OD), EPS polysaccharide content (colorimetric detection using phenol- sulfuric acid) and protein content (Bradford assay), intracellular protein production (GFP) | 84 | |
| Ag | 2–7.5 mg/L | viability (diameter of inhibition zone in disk diffusion, MIC (OD), LIVE/DEAD BacLight), | 69 | |
| Pseudomonas aeruginosa | CdSe/ZnS QDs | 20 nM | transcriptome analysis (qRT-PCR), antibiotic resistance | 55 |
| TiO2 | 10–100 mg/L | viability (LIVE/DEAD BacLight), ROS (HPF), FT-IR membrane, EPS characterization wrt EPS secretion genetic variants | 85 |
Note, only models that have been used more than once in nanotoxicity studies are highlighted below. CFU, colony forming unit; OD, optical density; ROS, reactive oxygen species; MIC, minimum inhibitory concentration; H2DCFDA, 2′,7′-dichlorodihydrofluorescein; XTT, sodium 2,3-bis(2-methoxy-4-nitro-5-sulfophenyl)-5-[(phenylamino)-carbonyl]-2H-tetrazolium inner salt; ICP-OES, inductively coupled plasma optical emission spectroscopy; qRT-PCR, quantitative real time polymerase chain reaction; EPS, extracellular polymeric substance; GFP, green fluorescent protein; HPF, hydroxyphenyl fluorescein; FT-IR, Fourier transform-infrared spectroscopy.
Despite the wide variety of monoculture bacterial species that have served as model systems for econanotoxicity evaluation, general trends are beginning to emerge regarding bacterial response to engineered nanoparticle exposure. One such trend is the correlation between nanoparticle-induced ROS production under UV light exposure and increased bacterial toxicity, which has been studied with a variety of nanoparticles. For example, Wiesner and co-workers considered the effect of fullerene nanoparticle (C60 and single-wall and multiwall carbon nanotubes) aggregate size on ROS production and toxicity toward Vibrio fischeri, a bioluminescent marine bacterium that is the exclusive symbiont of Euprymnascolopes (Hawaiian Bobtail Squid).81 Bacterial toxicity was measured based on changes in bacterial luminescence, which is directly proportional to the respiration rate for V. fischeri, and related to nanoparticle aggregate size (as determined through filtration using 1.2 μm, 450 nm, 100 nm, 50 nm, and 20 nm filters). ROS production, measured by degradation of 2-chlorophenol, was quantified as a function of aggregate size, and results revealed an increase in ROS concentration under UV-A illumination and an increase in respiration inhibition with a decrease in the mean nanoparticle agglomerate diameter. These results mirror the size-dependent toxicity observed for nonaggregated nano-particles in other model systems.54,86 However, there is some disagreement within the field regarding the role of ROS in conveying fullerene nanoparticle toxicity. A study by Alvarez and co-workers observed no evidence of photocatalytic ROS production, as measured with molecular probes, from C60 nanoparticle aggregates (nC60).77 Here, the authors demonstrated that nC60 are oxidants by measuring their oxidation-reduction potential across a 1–10 mg/L concentration range, and they suggest that toxic effects of fullerene nanoparticles are due to direct oxidative damage of membrane proteins and lipids by nanoparticles without ROS production. In addition to fullerene nanoparticle aggregates, photocatalytic-ROS production by metal oxide nanoparticles has also been observed, where wide-bandgap semiconductors like TiO2 or ZnO can be expected to produce electron-hole pairs under UV light, causing reduction/oxidation of nearby species. One study compared 20–100 nm diameter TiO2 nanoparticle-induced toxicity in Bacillus licheniformis, a common soil bacterium, under UV light and nonilluminated conditions and, unlike the aforementioned nC60 results, observed a similar reduction in bacterial viability under both control and UV-illuminated conditions.87 Toxicity under UV light was attributed to TiO2-induced ROS generation while damage under nonilluminated conditions was attributed to nanoparticle attachment to cell membranes and subsequent membrane damage through oxidative stress. Similar results were observed by Sadiq et al. where 20 nm diameter TiO2 nanoparticles imparted toxicity to E. coli, P. aeruginosa, and B. subtilis through membrane damage under nonilluminated conditions.65 Conversely to the above study, good correlation (R = 0.84) has been shown between UV-light induced ROS production and E. coli survival rate following TiO2, ZnO, CeO2, Al2O3, and Fe2O3 nanoparticle exposure, even though release of toxic Zn2+ ions (measured at 178.3 μg/L) may have also contributed to toxicity in the case of ZnO nanoparticles.71 In this study, E. coli were exposed to 5 μg/mL nanoparticles of aggregate size ranging from 100 to 2000 nm for 2 h under 365 nm, 0.78 mW/cm2 UV light exposure with ROS concentration measured with a variety of molecular indicators and E. coli survival rate determined via the plate count assay.71 These differences may be the result of many different assays used to quantify/observe ROS throughout the literature. The assessments of nanoparticle-induced ROS production would benefit from more consistent methods and/or including select gene expression analysis (e.g., super-oxide dismutase) to observe whether ROS stimulation does in fact promote oxidative stress.
In addition to ROS production, the correlation between nanoparticle dissolution and bacterial toxicity has emerged out of the econanotoxicity literature. Of the commonly used nanoparticles, this is most apparent for Ag nanoparticles, which, as mentioned above, impart toxicity to bacteria through the dissolution to Ag+.51,88 A recent study by Alvarez and coworkers showed that under both aerobic and anaerobic conditions (the latter precluding ROS generation), Ag nanoparticle toxicity toward E. coli correlates directly with Ag+ concentration.51 Both commercially available polyvinylpyrrolidone-coated Ag nanoparticles of diameters 18, 51, and 72 nm and synthesized glycol-thiol coated Ag nanoparticles of diameters 3, 5, and 11 nm were used in this work. E. coli suspensions were dosed with 0–200 μg/mL Ag nanoparticles or 0–400 μg/L Ag+ (in the form of AgNO3) and toxicity was assessed via colony forming units. Complexation of Ag+ by media components (e.g., Cl−) was minimized by using a sodium bicarbonate buffer as the exposure medium. The authors suggest that Ag nanoparticle properties shown elsewhere to influence antimicrobial activity, including size, surface charge, and surface coating, influence toxicity only by changing the dissolution properties. In addition to Ag nanoparticles, ions released from both ZnO and CuO nanoparticles (Zn2+ and Cu2+) have shown toxicity toward microorganisms.71 Similar to Ag, ZnO, and CuO nanoparticles, quantum dot (QD)-induced bacterial toxicity must be considered along with the effect of dissolved metal ions. Alvarez and co-workers recently demonstrated that exposure to commercially available 7.4 nm diameter QDs (CdSe core with ZnS shell) caused defense and stress responses in Pseudomonas aeruginosa at sublethal concentrations, including increased expression of heavy-metal ion efflux system genes upon exposure to QDs and the metal ions along with extracellular nanoparticle biosynthesis following ion exposure. These responses were increased upon exposure to weathered nanoparticles that typically have increased toxic metal ion release.55 A change in bacterial gene expression was also observed in nitrifying bacteria N. Europaea, P. stutzeri, and A. vinelandii upon QD exposure with an up-regulation of nitrogen cycling genes;67 unlike Ag nanoparticles, QDs still induced a change in the nitrification/denitrification cycle after controlling for ion release, indicating some nanospecific toxicity.
As with ROS, ion dissolution from nanoparticles may be impacted by a number of environmental conditions as discussed above and therefore should be considered within relevant experimental matrixes. These surface-mediated processes are likely to be affected by nanoparticle transformations in natural environments, especially adsorption of NOM. Li et al. studied the effect of NOM sorption on the toxicity of nC60(<0.22 μM-in-diameter) imparted to E. coli, and it was revealed that NOM (Suwanee River humic and fulvic acids) adsorption mitigated most growth and respiration impairments that were caused by nC60.89 A similar NOM-abated toxicity of Ag nanoparticles toward E. coli was observed,90 which is attributed to decreased interaction of nanoparticles with bacteria cells upon NOM adsorption.91 Chloride and calcium (a representative divalent ion) concentrations also correlated significantly with antibacterial activity, where the presence of chloride and/or divalent ions decreased the toxicity of Ag nanoparticles to E. coli. The decrease in toxicity is attributed to chloride binding Ag+, decreasing its bioavailability, and divalent ions increasing the ionic strength of the suspension, destabilizing nanoparticles, and giving larger aggregates,91 which have been shown to be less toxic.92
Monoculture bacteria nanotoxicity studies have shed light on the mechanisms of nanoparticle-induced toxicity (e.g., ROS production and dissolution of toxic ions) and the significance of nanoparticle physical properties such as particle and aggregate size and surface modifications in determining toxicity. Natural isolate studies, on the other hand, comprise complex mixtures of bacterial species from a particular environment and have generally focused less on identifying the mechanisms of toxicity and more on understanding toxicity in more complex and ecologically relevant environments, often at the bacterial community level.
The approach of natural isolate studies has generally been to assess nanoparticle-induced toxicity via changes in species diversity and composition and community growth and performance. For example, Ge et. al evaluated soil microbial biomass, diversity, and composition in a microcosm with respect to a 15–20 nm diameter TiO2 and 20–30 nm diameter ZnO nanoparticle dose and exposure time by quantifying the total extractable soil DNA and substrate-induced respiration, which showed a negative relationship between exposure dose and microbial biomass.58 Terminal restriction fragment length polymorphism (T-RFLP), a tool used for determining the microbial community profiles, showed significant community composition deviation from negative controls, with greater deviation at higher doses and longer exposure times. Analysis of T-RFLP profiles showed a negative relationship between nanoparticle dose and species diversity, though concentrations (0.5–2 mg TiO2/g soil and 0.05–0.5 mg ZnO/g soil) used in this study were significantly higher than the PEC in WWTP sludge (Table 1). In a related study, bacterial community composition, cellular respiration, and cellular production (protein synthesis) were monitored in natural bacterioplankton samples for 5 days following Ag nanoparticle (1–10 nm diameter) or AgNO3 exposure using multidimensional scaling plots of denaturing gradient gel electrophoresis (DGGE) profiles, another technique for microbial community profiling.60 This study showed significant bacterial community composition deviation from the negative control upon Ag nanoparticle exposure (calling monoculture experiments, in general, into question), though changes induced by AgNO3 were more variable, grouping with either the negative control or high Ag nanoparticle doses. Cellular respiration and protein production, monitored via flow cytometric counting of monotetrazolium redox dye uptake and incorporation of radio-labeled 3H-leucine, respectively, decreased significantly following Ag nanoparticle exposure at all concentrations. While these studies provide some indication about the microbial structure and growth/respiration, they lack an understanding of bacterial function changes, which are valuable to assess ecological ramifications of nanoparticles. Ideally, toxicological assessments would incorporate fundamental assessment of bacterial function upon exposure to nanoparticles while maintaining ecological complexity. Alternatively, modeling environmental conditions within a monoculture may enable assessment of nanoparticle impacts on bacterial function, but either path needs development of assays sensitive enough to determine molecular markers of toxicity within complex environments.
Das et al. pursued a more complex functional assessment in natural isolate communities. A 2012 study measured natural bacterioplankton extracellular enzyme affinity following 1–10 nm-diameter Ag nanoparticle exposure for up to 48 h.93 Extracellular enzyme activity, critical for bacteria to acquire nutrients from species that cannot pass through the membrane, was measured via detection of radio-labeled leucine incorporation into synthesized proteins and showed complete inhibition after 1 h of exposure at all Ag nanoparticle concentrations. At low concentrations (0.05–10 mg/L), full or increased activity relative to the negative control was regained over 48 h. Natural isolate studies more accurately model the interactions between nanoparticles and bacteria in the environment by considering bacteria in multispecies communities, their most common state in the environment; thus, they provide valuable perspective alongside the more extensive monoculture bacterial nanotoxicity literature. Both perspectives must be pursued to understand both the molecular-level mechanisms of nanoparticle-induced toxicity and the higher level composition and functional changes induced by nanoparticles in natural environmental systems. Analytical chemists can contribute to this effort by pursuing applications of spectroscopic and genomic/proteomic/metabolomic methods in bacterial nanotoxicity evaluation. Advancements in these areas would allow several important questions to be addressed that are beyond the scope of currently employed microbiological assays, including: Can we visualize bacterial cell/nanoparticle interaction in real time? How is bacterial membrane composition affected by nanoparticle exposure? How is global bacterial gene expression altered with nanoparticle exposure? Are genetic changes reflected in protein expression? Is the bacterial metabolite profile affected by nanoparticle exposure?
PLANTS
Plants are particularly relevant in considerations of econanotoxicity based on their interaction with air, soil, and water, all of which may contain engineered nanoparticles. In addition, plants present a significant opportunity to facilitate nanoparticle transfer among various species in the food web because they are consumed by lower trophic level organisms, animals, and people. Though there are a wide variety of plant species within the ecosystem, most nanotoxicity work to date has focused on plants for human consumption, such as maize,94 wheat,95,96 soybean,97 tobacco,98 and many fruit or vegetable plants, such as pumpkin,99 cucumber,96,100,101 and radish.96,101,102
The large surface area leaf and root structures of many plant species mean that plants have ample opportunity to interact with nanoparticles. Unfortunately, evidence of nanoparticle uptake and toxicity, or lack thereof, is scarce because (1) plant nanotoxicology is a relatively new field and (2) most experiments performed to date focus on nanoparticle exposure during germination or to plant cell cultures. Because many plant cell walls have pore sizes of 5 nm or less, the likelihood of nanoparticle uptake and translocation is assumed to be low unless the nanoparticles are quite small or the cells are damaged before nanoparticle exposure. Possible routes of nanoparticle uptake include traversing the cuticle surface of leaves, the cuticle-free portions of the plant (e.g., flowers), suberin-coated roots, or regions of new root formation/injured areas. Uptake and translocation are generally assessed by sectioning the plant and employing traditional microscopy methods. In the cases where plant cell uptake of nanoparticles has been assessed, it is clear that uptake efficiency depends on nanoparticle size, composition, surface functionalization, and aggregation state.103 Once taken up, a small subset of studied nanoparticles have demonstrated translocation through the upward water transport system (including Ni(OH)2 nanoparticles (0.01–0.1 g of nanoparticle added to plant nutrient solution, concentration not specified),104 ZnO nanoparticles (0.05–0.5 g nanoparticle/kg soil),97 Cu nanoparticles (0–1000 mg nanoparticle/L plant agar),105 small Au nanoparticles,98 NaYF4:Yb,Er nanocrystals,106 and fullerols107 (10–110 mg nanoparticle/L plant cell culture solution)), and there is one study indicating the transmission of nanoparticles (C70) among generations of rice plants (20–800 mg nanoparticle/L germination buffer).108 Application of super-resolution microscopy would promote a cellular-level understanding of the interaction between plant cells and nanoparticles, advancing our current macroscale understanding of the plant-nanoparticle interaction.
While plants have some toxicity measures that are similar to bacteria, algae, worms, fish, and mammals (e.g., cell viability, oxidative stress, DNA damage, organism growth, and morphology), there are also unique toxicity considerations (Figure 2). These unique phytonanotoxicity measures include assessment of seed germination rates,99,101,109 root elongation rates,96,100,101 nitrogen fixation,97 and soil enzyme levels.95 All of these measures are done using traditional by eye” assessment or standard assay kits. In the current literature, there has been little analytical methodology innovation in studies of plant nanotoxicology. The authors of this perspective suggest metabolomics as a promising approach for studying plant nanotoxicology, for example, by studying changes in secondary-metabolite production in plants as a function of nanoparticle exposure.110 In addition, many of these studies are performed on hydroponic plants, where nanoparticles are presented in the aqueous phase, rather than the more realistic nanoparticle introduction through irrigated soil or sand. Presentation in water makes nanoparticle uptake more likely, and nanoparticle uptake from sand appears favorable to uptake from soil.99
Figure 2.

Unique phytotoxicity considerations. Reprinted with permission from ref 111. Copyright 2011 Elsevier.
The results of the available phytonanotoxicity studies are most revealing when interpreted based on the route of nanoparticle exposure, considering results for isolated cells versus seeds versus leaves versus hydroponic solution versus soil. Any toxicity trends seen as the system complexity increases will reveal true areas of concern. Starting with the simplest plant system, isolated plant cells, there are two recently published studies, both focused on MWCNT exposure. Serag et al. examined the interaction between Catharanthusroseus cells and fluorescent MWCNTs up to 500 nm in length (0.01–0.08 mg/L medium) to characterize cellular uptake and localization.112 Colocalized fluorescence imaging and TEM showed that the MWCNTs were not likely taken up via endocytosis, instead the MWCNTs appear to penetrate the plant cell membrane as individual, rather than aggregate, nanotubes. Khodakovskaya et al. exposed tobacco cells to 20-nm-diameter MWCNTs (50–200 mg/L medium) and saw an increase in cell growth rate that correlated with increased expression of genetic markers for cell division and water channel expression compared to activated carbon-exposed control cells.113 In addition, the MWCNT uptake was characterized using both Raman spectroscopy and TEM, and the MWCNTs apparently transfer between generations of tobacco cells. While it is unclear if these cell-level studies predict whole plant toxicity response, they are useful for understanding how nanoparticles may enter plant cells and, if they are able to enter, where they may localize.
There are many examples where research groups have exposed plant seeds to various nanoparticle solutions and then monitored germination and root elongation from the seed. Lin et al. examined seed germination and root elongation in six plant species (radish, rape, rye-grass, lettuce, corn, and cucumber) following exposure to 2–2000 mg of ~20-nm-diameter MWCNTs (1–2 um long), 18-nm-diameter Al, 60-nm-diameter Al2O3, 35-nm-diameter Zn, or 20-nm-diameter ZnO nanoparticles per liter.101 Seed germination was influenced in a subset of plant species, only by the highest concentration of Zn or ZnO; based on careful controls, this effect cannot be attributed to Zn2+ release. Root growth was also most heavily impacted by the presence of Zn or ZnO, though other nanoparticles did influence the root elongation of various plant species in dose-dependent manners. Similarly, Ma et al. studied root elongation in seven plant species (radish, rape, tomato, lettuce, wheat, cabbage, and cucumber) following seed exposure to 2–2000 mg/L solutions of either ~7-nm-diameter CeO2, ~22-nm-diameter La2O3, ~23-nm-diameter Gd2O3, or ~12-nm-diameter Yb2O3 nanoparticles.96 Each nanoparticle had distinct effects on the root elongation of the collection of seven edible plants, with CeO2 having a significantly smaller effect than any of the other 3 nanoparticle compositions; the measured effects could not be accounted for by the phytotoxicity of released rare earth ions. Fugestsu and co-workers investigated the effects of 500–2000 mg/L aqueous suspensions of graphene oxide on seedlings of terrestrial food crops, including cabbage, tomato, red spinach, and lettuce, by monitoring germination, growth, viability, and reactive oxygen species levels.109 Plant growth was impeded following nano-particle exposure in all but the lettuce plants. Together, these three survey studies suggest that the nanoparticles themselves (rather than ions produced during nanoparticle dissolution) impact the earliest stage of plant development and that different nanomaterials show varied effects. In another study, Patlolla et al. exposed broad bean plant seedlings to 12.5–100 mg/L 60-nm-diameter Ag nanoparticle agglomerates and tracked both uptake and genotoxicity.114 While the concentration-dependence of nanoparticle uptake was not reported, the frequency of chromosomal aberrations and micronuclei induction increased in an Ag nanoparticle dose-dependent manner. It is unclear in this report if appropriate Ag+ controls were performed for comparison, so the measured toxicity could be due to Ag, Ag+, or a combination of the two. Wang et al. examined the capacity of clay (~90-nm-diameter) and iron oxide (~25-nm-diameter) nanomaterials to remediate Cd phytotoxicity in four plant species: cucumber, tomato, lettuce, and carrot.100 They found that the nanoparticles themselves (present at 100–2000 mg/L and without Cd toxicant present) did not have negative effects on the plants and, in some cases, even promoted root elongation. While many more studies will be required to draw general conclusions, it is clear that the presence of nanoparticles influences the fate of plant seeds.
While there are a fair number of papers that use leaf extracts to synthesize nanoparticles, there are surprisingly few studies of phytonanotoxicity following leaf exposure, even though this exposure route will be particularly relevant if nanoparticles are employed for crop management (e.g., to improve herbicide delivery). In one recent example, Birbaum et al. investigated uptake and translocation of 37-nm-diameter CeO2 nano-particles in maize plants after airborne exposure (deposited at concentrations of about 50–270 μg CeO2/g dry leaf), considering both light (open stomata) and dark (closed stomata) exposure conditions.94 The open/closed state of the stomata did not influence maize uptake of airborne nano-particles; in addition, incorporated nanoparticles did not translocate to new leaves developed during a 3 month postexposure cultivation. In addition, there was no apparent difference in growth or appearance of the maize plants exposed to the CeO2 nanoparticles.
Nanoparticle exposure through the aqueous media of hydroponic plants avoids many of the complications regarding the interaction of nanoparticles with various components of soil, making result interpretation more straightforward and, perhaps, yielding toxicity data that will be relevant for large or repeated nanoparticle exposures. Nelson and co-workers used hydroponic radish and ryegrass seedlings to model unintentional CuO nanoparticle exposure.102 They allowed the seedlings to germinate in solutions of 10–1000 mg/L <100 nm diameter CuO nanoparticles for 6 days and monitored nanoparticle uptake, plant growth, and DNA lesions. Upon comparing nanoparticle-exposed plants to Cu2+ ion and macroscale Cu-exposed plants, they found that the radish displayed a nanoparticle dose-dependent increase in DNA damage that could not be completely accounted for by Cu2+ effects. Also evident was that the CuO nanoparticles crossed the plant cell wall, despite apparent aggregation. Similarly exposed and analyzed ryegrass samples showed smaller, though still significant, indications of CuO nanoparticle toxicity. While nanoparticle-initiated DNA damage clearly has a negative impact on plant growth, its role in plant disease or genomic instability is unclear and should be considered in longer term studies. In another recently published study, Sabo-Attwood et al. exposed hydroponic tobacco seedlings to either 3.5-nm or 18-nm-diameter Au nanoparticles at 48 mg/L or 76 mg/L, respectively.98 The smaller nanoparticles were able to translocate to the leaves while the larger nanoparticles agglomerated on the root exterior. Leaf necrosis was detected only in the case of the smaller nanoparticle. Zhu et al. investigated the effects of 0.5 g/L 20-nm-diameter Fe3O4 nanoparticle exposure on hydroponic pumpkin plants; this model was chosen because pumpkin is known to efficiently take up water (and waterborne contaminants) from soil and thus, would be a likely candidate for phytotoxicity for hydroponic nanoparticle exposure.99 Nanoparticle exposure began after significant progress from germination, and uptake/translocation was detected using vibrating sample magnetometry. These data demonstrate that Fe3O4 nanoparticles and nanoparticle aggregates reside both in the leaf and root tissue. A similar distribution, though smaller amounts, of Fe3O4 was found in pumpkin plants grown in sand while no Fe3O4 nanoparticles were taken up by plants in soil. Like the simpler cell and seed experiments, hydroponic presentation of nanoparticles appears to influence plant growth and health; however, this experimental system ignores many of the nanoparticle transformations, making the nanoparticles both more and less available, that may occur in soil.
The most likely route of plant exposure to nanoparticles is through the soil or sand as nanoparticles enter the ecosystem through a variety of intentional and unintentional release routes and accumulate.115 In the previously referenced study by Birbaum et al., the researchers considered both airborne and irrigation-based exposure of maize plants to 37-nm-diameter CeO2 nanoparticles.94 When nanoparticles were presented at 10 μg/g soil/day via 14-day irrigation, there was neither measurable uptake (using inductively coupled plasma mass spectrometry (ICP-MS) analysis) nor any changes in growth or appearance of the maize plants. Priester et al. added nanoscale 0.05–0.5 g of ZnO (~10-nm-diameter) or 0.1–1 g of CeO2 (~8-nm-diameter) per kilogram soil, and then soybean plants were grown to full maturity before phytotoxicity analysis. The ZnO translocated throughout the plant, into the leaves and even the product beans. CeO2 apparently acted directly at the root/soil level, inhibiting N2 fixation and, thus, plant growth. These are among the most realistic studies performed, and the results are concerning. Dimkpa et al. monitored phytotoxicity of agglomerates of 50-nm-diameter CuO and 100-nm-diameter ZnO on wheat grown in sand.64 There was clear evidence that the nanoparticles were dissolving, though the resulting dissolved ions had similar impacts to ions introduced via bulk CuO and ZnO. One unique result of nanoparticle, as compared to bulk, exposure was increased ROS in both the roots and shoots of the wheat. On a similar experimental scale, Du et al. applied 5 g of 40-nm-diameter ZnO or 10 g of 20-nm-diameter TiO2 to a field to simulate nanoparticle-polluted soil and monitored the subsequent growth of wheat and several soil enzyme levels (urease, protease, catalase, and peroxidase).95 TEM analysis of the wheat roots showed mild uptake of TiO2 and no evidence of ZnO uptake; however, there was Zn (likely in the form of Zn2+) but not Ti in the harvested wheat shoots. Both nanoparticles induced depressed soil enzyme activity and an overall decrease in harvested wheat biomass. Clearly, nanoparticles presented in soil can influence plants that grow in that soil. One complication in understanding the impact of the current data lies in the lack of knowledge about relevant soil nanoparticle dose or how heterogeneous the incorporated nanoparticles will be with changes in soil depth or composition. In addition, many of the studies we have just summarized use vastly different types of nanoparticles, at different exposure times and concentrations, making cross-correlations difficult. Community-set standards would certainly help move this field forward.
MULTICELLULAR AQUATIC AND TERRESTRIAL ORGANISMS
The routes of exposure of nanomaterials to living organisms depend on the habitat of the organism. For plants, as we have just learned, entry through roots is a main concern. For fish in water or worms in soil, nanoparticles that are resident in the aqueous or soil phases provide a means of entry into the animal (gills, mouth, to the gut) that could be drastically altered by the nature of the nanoparticle surface.
Early studies of nanomaterial toxicity in fish (Table 3) focused on limited numbers of larger organisms that humans might eat, such as trout and bass, with critical measurements being made on as few as three fish.116–120 For hydrophobic carbon-based materials, organic solvent impurities and degradation products have been found to be responsible for biological effects and clearly demonstrate the need for proper controls.
Table 3.
Early Fish Nanotoxicity Studies, Including Assayed Toxicity Markers and Results
| model system | nanoparticle | dose range | toxicity markers | results | ref |
|---|---|---|---|---|---|
| largemouth bass | C60 | 0–1 ppm | lipid peroxidation, protein peroxidation, glutathione | lipid peroxidation localized in brain | 116 |
| fathead minnow | C60 | 0–1 ppm | mRNA and protein oxidative stress markers | observed toxicity due to solvent | 117 |
| Japanese medaka | C60 | 0–1 ppm | mRNA and protein oxidative stress markers | no toxicity observed | 117 |
| rainbow trout | SWCNT | 0–0.5 mg/L | ventilation rate, oxidative stress, mucus formation, hemoglobin, osmoregulation, histopathology | increased aggressive behavior, gill irritation, some changes in brain pathology | 118 |
| TiO2 | 0–1.0 mg/L | ventilation rate, oxidative stress, mucus formation, hemoglobin, osmoregulation, histopathology | some irritation and oxidative stress | 119 | |
| zebrafish | C60 | 0–6 mg/L | gene microarrays | toxicity observed the result of solvent | 120 |
The community has zeroed in on several standard fish in order to better compare across studies. Japanese medaka and zebrafish are standard organisms in biology and can be considered the aquatic versions of the famous Drosophila fruit fly. Zebrafish are hardy freshwater fish, reproduce quickly, and were one of the earliest organisms to have its genetics examined in detail.121 Medaka are hardy, reproduce rapidly, and can live in a variety of salinities; also, its genome has been sequenced.122 While it is important to start with accepted biological models, future work should also monitor nanotoxicity effects in a more susceptible fish model to check result generalizability. The literature regarding effects of nanomaterial exposure on zebrafish numbers at least 200 studies so far and mostly are concerned with measuring toxicity levels, although some nanomaterial fate/metabolism work has begun to appear. The first nanomaterials studied in these regards included carbon-based nanoparticles(fullerenes, CNTs) and titanium dioxide (for a review see Handy et al.123). There are numerous practical difficulties with fish measurements in addition to the ones already mentioned: for example, when chemically irritated, fish can produce mucus that can aggregate and precipitate out nanoparticles, rendering effective concentrations far different from initial ones.124 Therefore, analytical methods to separate and quantify all the biologically relevant reservoirs that might harbor nanomaterials in a system are required; the nature of these reservoirs will vary with the organism and environment studied.
The noble metals are becoming objects of study for fish, too, perhaps as a result of an increasing awareness of “antimicrobial nano-silver” products in the marketplace. More recent studies show more sophistication in terms of nanomaterial surface chemistry than earlier, basic studies. For example, Kwok et al. have recently reported that silver nanoparticles exert different toxicological effects on medaka that depend on both the form of the silver and on the nanoparticle coating.125 These authors found that silver nitrate was 3–10× more toxic, as measured by medaka death as a function of concentration, than the same mass of silver in nanoparticle form (for several different diameters). They also found that the coating of the silver nanoparticle (citrate, gum arabic, or polyvinylpyrrolidone) influenced the toxicity, with the gum arabic coating the worst offender. Animal dissection slices were examined by hyper-spectral darkfield imaging to locate silver nanoparticles, and at least in these fish, the gills were the apparent main point of entry. At early times or lower doses, anatomical deformations in the fish were observed. A related study by Kashiwada et al. similarly found that medaka embryos underwent gross morphological changes upon exposure to 4 nm silver nanoparticles (which they estimated to coexist with 25% free silver ion) and that silver nanoparticles were able to navigate biological barriers to enter the embryos (or silver ion entered and was subsequently reduced to make particles in the embryos).126 DNA microarray analysis suggested that the presence of silver nanoparticles was correlated with increased oxidative stress and the down-regulation of genes involved in growth, cell proliferation, and differentiation. While these authors did not examine a suite of surface chemistries, a very recent report by Nel et al. implicates atomic-level crystal defects in silver nanoplates with toxicity to zebrafish embryos.127 The main emphasis of this study was on the effect of nanoparticle shape on toxicity in both fish gill epithelial cell lines and in zebrafish embryos; surprisingly, the authors found that the most toxic (as judged by cell death or lack of embryo hatching) form of silver were nanoplates, as opposed to nanospheres or nanorods. The correlation of toxicity with the amount of free silver ion, as judged by ICP-MS with assumptions about how well free silver ion can be separated from silver nanoparticles, was not great; a much better correlation was found with nanoparticle shape, with “sharp” edged silver nanoplates being good at breaking open cell membranes. The authors were able to passivate these crystal defects with cysteine and mitigate the biological response, suggesting that the physical shape and contact of the nanomaterial with membranes might be an important parameter to decode the mystery of nanobio interactions.
In soil, earthworms comprise a critical component of the ecosystem128 and are model detrivores in ecological studies. A handful of experiments have been conducted on earthworm response to the presence of engineered nanomaterials in soils. One of the earliest ones concerned 14C-labeled carbon nanotubes, and ultimately the authors found that polycyclic aromatic hydrocarbons (PAHs) were far more likely to be taken up by earthworms compared to carbon nanotubes.129 Interestingly, a follow-up study found that carbon nanotubes were good at sequestering PAHs in soil and therefore made PAHs less bioavailable to the worms.130
A perusal of the “earthworm + nanomaterial” literature suggests that approximately half of the papers use metal oxides as the nanomaterial of choice. The typical experiment is to dose standard soils with the nanomaterials, expose the worms, quantify uptake after a certain amount of time, and measure organismal effects in parallel. For example, Hu et al. examined both TiO2 and ZnO (10–20 nm diameter) in this regard and found that molecular-level effects (e.g., DNA damage by the comet assay) occurred at doses greater than 1.0 g per kg soil, Zn and Ti were bioaccumulated in the worms after 7 days, and ZnO gave more toxic responses than TiO2.131 However, this paper has been criticized132 for its lack of clarity in definitions and standards (wet weight? dry weight?) and its lack of background in metallobiochemistry regarding the required levels of Zn, for instance, as a micronutrient. A recent review133 provides a very nice summary of the nanomaterials/soil studies that have been conducted so far. Exposure times vary from 1 to 28 days; doses vary from 0.1 to 1 000 mg nanomaterial per kg soil; and most of the biological outcomes measured for worms are mortality, reproductive ability, and occasionally a molecular biology measurement such as ROS generation or gene expression. The authors of this recent review point out a need for improved analytical detection methods that can measure in situ properties of nanomaterials in soil or, failing that, more standardization in extraction procedures suitable for highly variable ionic strength and turbid samples.133
Heckmann et al. have examined a host of inorganic nanoparticles (copper, silver, gold, titania, zirconia, silica, alumina) and their free metal ions for their effects on earthworms in soil, at concentrations of 1000 mg metal or particles/kg dry soil.134 At this very high dose, 100% reproductive failure was observed for silver nitrate and silver nanoparticles, with copper nanoparticles and TiO2 also exhibiting some degree of reproductive damage (by morphology and anatomical inspection).
Copper, silver, and gold nanoparticles have been systematically examined by Bertsch and Unrine et al. for their effects on earthworms.135 Nanoparticle effects on worm growth, mortality, reproduction, and gene expression are the most commonly performed measurements. For a variety of sizes of copper nanoparticles, the general conclusion was that they were partially oxidized in soils (as judged by X-ray absorption spectroscopy) and were indeed taken up by the worms but that there were no significant biological detrimental impacts until 65 mg Cu/kg soil.135 For silver nanoparticles, silver nitrate was rightly included in controls; results there depended, interestingly, on soil type.136 Silver nitrate alone reduced earthworm growth and reproduction at 7.4 mg/kg soil in a natural sandy soil, but only worm reproduction was affected, starting at 94 mg/kg soil, for artificial “standard”soils.136 For two different PVP-coated silver nanoparticle batches of different diameters, reproductive toxicity was observed, but at nearly an order of magnitude less compared to free silver; finally, earthworm accumulation of silver was significantly higher in the sandy soil compared to the artificial soil.136 X-ray spectroscopy confirmed that ~20% of the silver nanoparticles in these experiments were in the 1+ oxidation state. For gold, ICP-MS of tissues and X-ray fluorescence of tissue slices showed that earthworms can accumulate 22 and 55 nm gold nanoparticles, primarily in the gut but also in the entire body.135 No observable changes in gene expression were measured at doses between 5 and 50 mg Au/kg dry soil, but modest effects on worm reproduction, over several weeks, were measured at the highest doses.135
The overall “effects” experiments for inorganic nanoparticles + soil + earthworms have been supplemented by monitoring animal behavior in nanoparticle-dosed soils. For example, earthworms will avoid soil dosed with silver nitrate essentially immediately, if they can; but if the soil is dosed with silver nanoparticles at the same silver concentration as the silver nitrate experiment, the earthworms take up to 48 h to avoid the area.136 The mechanism of how the earthworms sense the presence of nanoparticles is not clear; it is not correlated with the release of silver ions or with the nature of the microbial communities in the soil.136 Clearly, experiments such as these would benefit from close collaboration between earthworm experts and nanotoxicologists.
CHALLENGES AND PERSPECTIVE
In the past decade, our understanding of the fate, transport, and toxicity of engineered nanoparticles has expanded greatly, in part due to the strategic use of model systems and nanoparticles. However, there is much need to increase the complexity of systems and move from individual species or environmental condition (e.g., with NOM) models described above to more complex mesocosms and as such, assessing the fate, transport, and effects of engineered nanomaterials in aquatic systems (river/ocean, etc.) and in soil (even without plants) presents major challenges to the analytical chemist. These challenges (Figure 3) include (i) making functional-level toxicity assessment in complex ecosystems, (ii) detecting engineered nanomaterials that are similar in chemical composition to natural particulate matter, (iii) characterizing the nanoparticles in a complex, natural environment (including oxidation state and adsorbed species) and/or controlling/accounting for natural conditions that cause a known change to the nanoparticle characteristics, such as a natural-occurring gradients of ionic strength or pH.
Figure 3.

Grand challenges of econanotoxicity where analytical chemists can greatly contribute.
Toward the first challenge, characterizing toxicity in a complex ecosystem, some effort has been made in larger, multitrophic-level systems. Ferry et al. followed the transport and uptake of gold nanorods in an estuarine mesocosm where nanomaterials were introduced into the seawater. Gold concentrations at the end of 12 days were measured for both the living and nonliving parts of the ecosystem using exhaustive ICP-MS.137 The overall results show that about 10% of the gold stays in the water column (in spite of the high ionic strength that might suggest irreversible precipitation and deposition); about a quarter ends up in the sediment; and the microbial biofilms (60%) and clams (6%) are the main points of entry into the food web. In another study using Duke Forest mesocosms, transportation of PVP-coated silver nanoparticles was followed over a very long-term (18 months) period.35 In this case, initial concentrations at the 25 mg/L level were introduced either into the soil or into the water of the system, which included many plants, insects, and fish. Silver concentrations were measured by either atomic absorption analysis, or by ICP-MS, after acid digestion of samples. X-ray absorption spectroscopy was employed to measure silver speciation. One conclusion from the study was that the route of entry into the ecosystem matters: for example, if the nanoparticles were introduced into the soil, at the end of 18 months, 58% of the detected nanoparticles remained in the soil (compared to 3% in the subaquatic sediment). If the nanoparticles were introduced via water, 60% of the found nanoparticles had migrated to the subaquatic sediment (compared to 7% found in the soil). Plants sequestered 3% (via soil) or 0.2% (via water) of the nanoparticles. Concentrations in fish and insects were reported at the 0.5–3.3 μg Ag/g wet weight levels. Unlike gold, silver does react with environmental constituents: over half of the silver, originally introduced as Ag0, had oxidized to silver sulfide (Ag2S), with another quarter being reacted to form other silver-sulfhydryl compounds. These examples of mesocosm uptake and toxicity, however, rely only on viability and/or behavior as an assessment of toxicity, and elucidating more nuanced views of toxicity (on a functional level) has the potential for providing a better mechanistic view of nanoparticle impacts. To accomplish the task of function-level toxicity assessment, there is a need for better communication between ecologists, toxicologists, chemists, and material scientists in order to determine the most relevant and important model systems, the critical functions of interest, and best practices in data interpretation.
In answer to the second challenge, detection of the engineered nanomaterials, the environmental nanotechnology community has provided several solutions. One elegant, although not always practical, solution is to perform isotope tracer studies. In one such study, details of Fe(II) cycling between the aqueous phase and goethite nanorods (an iron oxide mineral) were mapped out by following 57Fe via ICP-MS in the various environmental compartments. Overall, the investigators concluded that a possible new “redox-driven conveyer belt” mechanism was in place that was able to incorporate fresh iron into the goethite nanorods, yet keep the same size and morphology of the particle intact during the reaction.138 Zhang et al. have followed the transport and aggregation of multiwalled carbon nanotubes in aqueous peat suspensions by labeling the tubes with the radioactive 14C isotope.139 Separation of the nanomaterials in each of the environmental compartments was accomplished by standard centrifugation procedures, and detection of the 14C was accomplished with a standard liquid scintillation counter. To detect nanomaterials made out of elements that are rare in the environment, ICP-MS is an excellent technique for many nuclei; detection limits can be in the part-per-trillion range. X-ray absorption and fluorescence spectroscopies provide detailed information on oxidation states of almost all the elements in the periodic table, but the detection limits are orders of magnitude higher than for ICP-MS. Detection of engineered nanoparticles within environmental components will be critical in establishing better experiments or models of release and fate of nanomaterials into the environment.
The third challenge, measurement of nanoparticle characteristics or environmental conditions known to affect characteristics, is not a new challenge to the analytical community, but the combination of the challenges of nanoparticle behavior and toxicity effects bring an additional dimension of difficulty to the problem. For instance, one can imagine that simple fluorescent dyes that show pH-sensitive emission could be used to infer local pH changes in systems that are not turbid and contain no highly colored species that interfere with spectral data acquisition or adsorb the dye and alter its emission properties. Without reliable in situ characterization methods, the ex situ destructive methods of “freezing” the composition and spatial location of the sample, separation of components by density gradient centrifugation or field-flow fractionation, and quantification of components by mass spectrometry/magnetic measurements/absorption/emission/electrochemistry (depending on the type of nanoparticle and environmental components) is laborious but is the present state-of-the-art. A recent review highlights these issues and offers several case studies of finding engineered nanomaterials in soils or in sludge by combinations of these techniques.34 For the sludge experiment, the authors were able to learn that wastewater effluent that had significant silver content (as judged by ICP-atomic emission spectroscopy) contained not silver but silver sulfide nanocrystals (as judged by high-resolution transmission electron microscopy and energy dispersive spectroscopy (EDAX)).140 In this case, there was no competing particulate matter in the sample to interfere with the identification of the nanoparticles as silver sulfide.
While the body of work studying the ecological implication of nanoparticles is growing, gaps in our understanding still exist. To create sustainable nanotechnology, it is important for the expertise of a wide variety of disciplines to contribute to the greater understanding of nanobio interaction. Analytical chemists are expertly poised to address many of the current knowledge gaps and propel the field forward.
Acknowledgments
This material is based upon work supported by the National Science Foundation under the Center for Sustainable Nano-technology, Grant CHE-1240151, and a University of Minnesota NIH Biotechnology Institute Training Grant awarded to I.L.G.
Footnotes
Notes
The authors declare no competing financial interest.
References
- 1.Etheridge ML, Campbell SA, Erdman AG, Haynes CL, Wolf SM, McCullough J. Nanomed: Nanotechnol, Biol Med. 2013;9:1–14. doi: 10.1016/j.nano.2012.05.013. [DOI] [PMC free article] [PubMed] [Google Scholar]
- 2.Gottschalk F, Nowack B. J Environ Monit. 2011;13:1145–1155. doi: 10.1039/c0em00547a. [DOI] [PubMed] [Google Scholar]
- 3.Maurer-Jones MA, Bantz KC, Love SA, Marquis BJ, Haynes CL. Nanomedicine. 2009;4:219–241. doi: 10.2217/17435889.4.2.219. [DOI] [PubMed] [Google Scholar]
- 4.Marquis BJ, Love SA, Braun KL, Haynes CL. Analyst. 2009;134:425–439. doi: 10.1039/b818082b. [DOI] [PubMed] [Google Scholar]
- 5.Love SA, Maurer-Jones MA, Thompson JW, Lin YS, Haynes CL. Annu Rev Anal Chem. 2012;5:181–205. doi: 10.1146/annurev-anchem-062011-143134. [DOI] [PubMed] [Google Scholar]
- 6.Lewinski N, Colvin V, Drezek R. Small. 2008;4:26–49. doi: 10.1002/smll.200700595. [DOI] [PubMed] [Google Scholar]
- 7.Sharifi S, Behzadi S, Laurent S, Laird FM, Stroeve P, Mahmoudi M. Chem Soc Rev. 2012;41:2323–2343. doi: 10.1039/c1cs15188f. [DOI] [PMC free article] [PubMed] [Google Scholar]
- 8.Nanoscience and Nanotechnologies: Opportunities and Uncertainties. Royal Academy of Engineering; London: 2004. [Google Scholar]
- 9.Robichaud CO, Uyar AE, Darby MR, Zucker LG, Wiesner MR. Environ Sci Technol. 2009;43:4227–4233. doi: 10.1021/es8032549. [DOI] [PubMed] [Google Scholar]
- 10.Stensberg MC, Wei Q, McLamore ES, Porterfield DM, Wei A, Sepúlveda MS. Nanomedicine. 2011;6:879–898. doi: 10.2217/nnm.11.78. [DOI] [PMC free article] [PubMed] [Google Scholar]
- 11.Farré M, Gajda-Schrantz K, Kantiani L, Barceló D. Anal Bioanal Chem. 2009;393:81–95. doi: 10.1007/s00216-008-2458-1. [DOI] [PubMed] [Google Scholar]
- 12.Lin D, Tian X, Wu F, Xing B. J Environ Qual. 2010;39:1896–1908. doi: 10.2134/jeq2009.0423. [DOI] [PubMed] [Google Scholar]
- 13.Peralta-Videa JR, Zhao L, Lopez-Moreno ML, de la Rosa G, Hong J, Gardea-Torresdey JL. J Hazard Mater. 2011;186:1–15. doi: 10.1016/j.jhazmat.2010.11.020. [DOI] [PubMed] [Google Scholar]
- 14.Kretzschmar R, Schafer T. Elements. 2005;1:205–210. [Google Scholar]
- 15.Nel A. Science. 2005;308:804–806. doi: 10.1126/science.1108752. [DOI] [PubMed] [Google Scholar]
- 16.Gondikas AP, Jang EK, Hsu-Kim H. J Colloid Interface Sci. 2010;347:167–171. doi: 10.1016/j.jcis.2010.03.051. [DOI] [PubMed] [Google Scholar]
- 17.Sánchez A, Recillas S, Font X, Casals E, González E, Puntes V. TrAC, Trends Anal Chem. 2011;30:507–516. [Google Scholar]
- 18.Navarro E, Baun A, Behra R, Hartmann N, Filser J, Miao AJ, Quigg A, Santschi P, Sigg L. Ecotoxicology. 2008;17:372–386. doi: 10.1007/s10646-008-0214-0. [DOI] [PubMed] [Google Scholar]
- 19.Pérez S, Farré Ml, Barceló D. TrAC, Trends Anal Chem. 2009;28:820–832. [Google Scholar]
- 20.Levard C, Hotze EM, Lowry GV, Brown GE. Environ Sci Technol. 2012;46:6900–6914. doi: 10.1021/es2037405. [DOI] [PubMed] [Google Scholar]
- 21.Batley GE, Kirby JK, McLaughlin MJ. Acc Chem Res. 2012 doi: 10.1021/ar2003368. [DOI] [PubMed] [Google Scholar]
- 22.Project on Emerging Technologies. Woodrow Wilson International Center for Scholars; 2012. [Accessed December 2012]. http://www.nanotechproject.org. [Google Scholar]
- 23.Mueller NC, Nowack B. Environ Sci Technol. 2008;42:4447–4453. doi: 10.1021/es7029637. [DOI] [PubMed] [Google Scholar]
- 24.Gottschalk F, Sonderer T, Scholz RW, Nowack B. Environ Toxicol Chem. 2010;29:1036–1048. doi: 10.1002/etc.135. [DOI] [PubMed] [Google Scholar]
- 25.Klaine SJ, Alvarez PJJ, Batley GE, Fernandes TF, Handy RD, Lyon DY, Mahendra S, McLaughlin MJ, Lead JR. Environ Toxicol Chem. 2008;27:1825–1851. doi: 10.1897/08-090.1. [DOI] [PubMed] [Google Scholar]
- 26.Gottschalk F, Sonderer T, Scholz RW, Nowack B. Environ Sci Technol. 2009;43:9216–9222. doi: 10.1021/es9015553. [DOI] [PubMed] [Google Scholar]
- 27.Gottschalk F, Scholz RW, Nowack B. Environ Modell Software. 2010;25:320–332. [Google Scholar]
- 28.Blaser SA, Scheringer M, MacLeod M, Hungerbuhler K. Sci Total Environ. 2008;390:396–409. doi: 10.1016/j.scitotenv.2007.10.010. [DOI] [PubMed] [Google Scholar]
- 29.Arvidsson R, Molander S, Sandén BA, Hassellöv M. Hum Ecol Risk Assess. 2011;17:245–262. [Google Scholar]
- 30.Praetorius A, Scheringer M, Hungerbühler K. Environ Sci Technol. 2012;46:6705–6713. doi: 10.1021/es204530n. [DOI] [PubMed] [Google Scholar]
- 31.Kiser MA, Westerhoff P, Benn T, Wang Y, Pérez-Rivera J, Hristovski K. Environ Sci Technol. 2009;43:6757–6763. doi: 10.1021/es901102n. [DOI] [PubMed] [Google Scholar]
- 32.Westerhoff P, Song G, Hristovski K, Kiser MA. J Environ Monit. 2011;13:1195–1203. doi: 10.1039/c1em10017c. [DOI] [PubMed] [Google Scholar]
- 33.Hartung R, Dinman D. Environmental Mercury Contamination. Ann Arbor Science Publishers; Ann Arbor, MI: 1972. [Google Scholar]
- 34.von der Kammer F, Ferguson PL, Holden PA, Masion A, Rogers KR, Klaine SJ, Koelmans AA, Horne N, Unrine JM. Environ Toxicol Chem. 2012;31:32–49. doi: 10.1002/etc.723. [DOI] [PubMed] [Google Scholar]
- 35.Lowry GV, Espinasse BP, Badireddy AR, Richardson CJ, Reinsch BC, Bryant LD, Bone AJ, Deonarine A, Chae S, Therezien M, Colman BP, Hsu-Kim H, Bernhardt ES, Matson CW, Wiesner MR. Environ Sci Technol. 2012;46:7027–7036. doi: 10.1021/es204608d. [DOI] [PubMed] [Google Scholar]
- 36.Justino CIL, Rocha-Santos TA, Duarte AC. TrAC, Trends Anal Chem. 2011;30:554–567. [Google Scholar]
- 37.Kim B, Murayama M, Colman BP, Hochella MF. J Environ Monit. 2012;14:1128–1136. doi: 10.1039/c2em10809g. [DOI] [PubMed] [Google Scholar]
- 38.Keller AA, Wang H, Zhou D, Lenihan HS, Cherr G, Cardinale BJ, Miller R, Ji Z. Environ Sci Technol. 2010;44:1962–1967. doi: 10.1021/es902987d. [DOI] [PubMed] [Google Scholar]
- 39.El Badawy AM, Scheckel KG, Suidan M, Tolaymat T. Sci Total Environ. 2012;429:325–331. doi: 10.1016/j.scitotenv.2012.03.041. [DOI] [PubMed] [Google Scholar]
- 40.Chowdhury I, Hong Y, Walker SL. Colloids Surf, A. 2010;368:91–95. [Google Scholar]
- 41.Buffle J, Wilkinson KJ, Stoll S, Filella M, Zhang J. Environ Sci Technol. 1998;32:2887–2899. [Google Scholar]
- 42.Radniecki TS, Stankus DP, Neigh A, Nason JA, Semprini L. Chemosphere. 2011;85:43–49. doi: 10.1016/j.chemosphere.2011.06.039. [DOI] [PubMed] [Google Scholar]
- 43.Mahmoudi M, Lynch I, Ejtehadi MR, Monopoli MP, Bombelli FB, Laurent S. Chem Rev. 2011;111:5610–5637. doi: 10.1021/cr100440g. [DOI] [PubMed] [Google Scholar]
- 44.Liu J, Legros S, Ma G, Veinot JGC, von der Kammer F, Hofmann T. Chemosphere. 2012;87:918–924. doi: 10.1016/j.chemosphere.2012.01.045. [DOI] [PubMed] [Google Scholar]
- 45.Nason JA, McDowell SA, Callahan TW. J Environ Monit. 2012;14:1885–1892. doi: 10.1039/c2em00005a. [DOI] [PubMed] [Google Scholar]
- 46.Zhang S, Jiang Y, Chen CS, Spurgin J, Schwehr KA, Quigg A, Chin WC, Santschi PH. Environ Sci Technol. 2012;46:8764–8772. doi: 10.1021/es301000m. [DOI] [PubMed] [Google Scholar]
- 47.Gondikas AP, Morris A, Reinsch BC, Marinakos SM, Lowry GV, Hsu-Kim H. Environ Sci Technol. 2012;46:7037–7045. doi: 10.1021/es3001757. [DOI] [PubMed] [Google Scholar]
- 48.Yin Y, Liu J, Jiang G. ACS Nano. 2012;6:7910–7919. doi: 10.1021/nn302293r. [DOI] [PubMed] [Google Scholar]
- 49.Rudolph M, Erler J, Peuker UA. Colloids Surf, A. 2012;397:16–23. [Google Scholar]
- 50.He F, Wang W, Moon JW, Howe J, Pierce EM, Liang L. ACS Appl Mater Interfaces. 2012;4:4373–4379. doi: 10.1021/am301031g. [DOI] [PubMed] [Google Scholar]
- 51.Xiu Z-m, Zhang Q-b, Puppala HL, Colvin VL, Alvarez PJJ. Nano Lett. 2012;12:4271–4275. doi: 10.1021/nl301934w. [DOI] [PubMed] [Google Scholar]
- 52.Mudunkotuwa IA, Grassian VH. J Environ Monit. 2011;13:1135–1144. doi: 10.1039/c1em00002k. [DOI] [PubMed] [Google Scholar]
- 53.Brayner R, Ferrari-Iliou R, Brivois N, Djediat S, Benedetti MF, Fiévet F. Nano Lett. 2006;6:866–870. doi: 10.1021/nl052326h. [DOI] [PubMed] [Google Scholar]
- 54.Pelletier DA, Suresh AK, Holton GA, McKeown CK, Wang W, Gu B, Mortensen NP, Allison DP, Joy DC, Allison MR, Brown SD, Phelps TJ, Doktycz MJ. Appl Environ Microbiol. 2010;76:7981–7989. doi: 10.1128/AEM.00650-10. [DOI] [PMC free article] [PubMed] [Google Scholar]
- 55.Yang Y, Mathieu JM, Chattopadhyay S, Miller JT, Wu T, Shibata T, Guo W, Alvarez PJJ. ACS Nano. 2012;6:6091–6098. doi: 10.1021/nn3011619. [DOI] [PubMed] [Google Scholar]
- 56.Arnaout CL, Gunsch CK. Environ Sci Technol. 2012;46:5387–5395. doi: 10.1021/es204540z. [DOI] [PubMed] [Google Scholar]
- 57.Fang X, Yu R, Li B, Somasundaran P, Chandran K. J Colloid Interface Sci. 2010;348:329–334. doi: 10.1016/j.jcis.2010.04.075. [DOI] [PubMed] [Google Scholar]
- 58.Ge Y, Schimel JP, Holden PA. Environ Sci Technol. 2011;45:1659–1664. doi: 10.1021/es103040t. [DOI] [PubMed] [Google Scholar]
- 59.Pradhan A, Seena S, Pascoal C, Cássio F. Microb Ecol. 2011;62:58–68. doi: 10.1007/s00248-011-9861-4. [DOI] [PubMed] [Google Scholar]
- 60.Das P, Williams CJ, Fulthorpe RR, Hoque ME, Metcalfe CD, Xenopoulos MA. Environ Sci Technol. 2012;46:9120–9128. doi: 10.1021/es3019918. [DOI] [PubMed] [Google Scholar]
- 61.Patel IS, Premasiri WR, Moir DT, Ziegler LD. J Raman Spectrosc. 2008;39:1660–1672. doi: 10.1002/jrs.2064. [DOI] [PMC free article] [PubMed] [Google Scholar]
- 62.Kumar A, Pandey AK, Singh SS, Shanker R, Dhawan A. Chemosphere. 2011;83:1124–1132. doi: 10.1016/j.chemosphere.2011.01.025. [DOI] [PubMed] [Google Scholar]
- 63.Dasari TP, Hwang HM. Sci Total Environ. 2010;408:5817–5823. doi: 10.1016/j.scitotenv.2010.08.030. [DOI] [PubMed] [Google Scholar]
- 64.Dimkpa CO, McLean JE, Britt DW, Anderson AJ. Nanotoxicology. 2012;6:635–642. doi: 10.3109/17435390.2011.598246. [DOI] [PubMed] [Google Scholar]
- 65.Sadiq IM, Chandrasekaran N, Mukherjee A. Curr Nanosci. 2010;6:381–387. [Google Scholar]
- 66.Wigginton NS, de TA, Piccapietra F, Dobias J, Nesatyy VJ, Suter MJF, Bernier-Latmani R. Environ Sci Technol. 2010;44:2163–2168. doi: 10.1021/es903187s. [DOI] [PubMed] [Google Scholar]
- 67.Yang Y, Wang J, Zhu H, Colvin VL, Alvarez PJ. Environ Sci Technol. 2012;46:3433–3441. doi: 10.1021/es203485f. [DOI] [PubMed] [Google Scholar]
- 68.Kim SW, Baek YW, An YJ. Appl Microbiol Biotechnol. 2011;92:1045–1052. doi: 10.1007/s00253-011-3611-x. [DOI] [PubMed] [Google Scholar]
- 69.Suresh AK, Pelletier DA, Wang W, Moon JW, Gu B, Mortensen NP, Allison DP, Joy DC, Phelps TJ, Doktycz MJ. Environ Sci Technol. 2010;44:5210–5215. doi: 10.1021/es903684r. [DOI] [PubMed] [Google Scholar]
- 70.Pokhrel LR, Silva T, Dubey B, El Badawy AM, Tolaymat TM, Scheuerman PR. Sci Total Environ. 2012;426:414–422. doi: 10.1016/j.scitotenv.2012.03.049. [DOI] [PubMed] [Google Scholar]
- 71.Li Y, Zhang W, Niu J, Chen Y. ACS Nano. 2012;6:5164–5173. doi: 10.1021/nn300934k. [DOI] [PubMed] [Google Scholar]
- 72.Pagnout C, Jomini S, Dadhwal M, Caillet C, Thomas F, Bauda P. Colloids Surf, B. 2012;92:315–321. doi: 10.1016/j.colsurfb.2011.12.012. [DOI] [PubMed] [Google Scholar]
- 73.Simon-Deckers Al, Loo S, Mayne-Lahermite M, Herlin-Boime N, Menguy N, Reynaud Cc, Gouget B, Carrière M. Environ Sci Technol. 2009;43:8423–8429. doi: 10.1021/es9016975. [DOI] [PubMed] [Google Scholar]
- 74.Li M, Pokhrel S, Jin X, Mädler L, Damoiseaux R, Hoek EMV. Environ Sci Technol. 2011;45:755–761. doi: 10.1021/es102266g. [DOI] [PubMed] [Google Scholar]
- 75.Nair S, Sasidharan A, Rani VVD, Menon D, Nair S, Manzoor K, Raina S. J Mater Sci-Mater Med. 2009;20:235–241. doi: 10.1007/s10856-008-3548-5. [DOI] [PubMed] [Google Scholar]
- 76.Baek YW, An YJ. Sci Total Environ. 2011;409:1603–1608. doi: 10.1016/j.scitotenv.2011.01.014. [DOI] [PubMed] [Google Scholar]
- 77.Lyon DY, Alvarez PJJ. Environ Sci Technol. 2008;42:8127–8132. doi: 10.1021/es801869m. [DOI] [PubMed] [Google Scholar]
- 78.Xia XR, Monteiro-Riviere NA, Riviere JE. Toxicol Lett. 2010;197:128–134. doi: 10.1016/j.toxlet.2010.05.010. [DOI] [PubMed] [Google Scholar]
- 79.Bondarenko O, Ivask A, Kaekinen A, Kahru A. Environ Pollut. 2012;169:81–89. doi: 10.1016/j.envpol.2012.05.009. [DOI] [PubMed] [Google Scholar]
- 80.Zhang W, Rittmann B, Chen Y. Environ Sci Technol. 2011;45:2172–2178. doi: 10.1021/es103376y. [DOI] [PubMed] [Google Scholar]
- 81.Chae SR, Therezien M, Budarz JF, Wessel L, Lin S, Xiao Y, Wiesner MR. J Nanopart Res. 2011;13:5121–5127. [Google Scholar]
- 82.Heinlaan M, Ivask A, Blinova I, Dubourguier HC, Kahru A. Chemosphere. 2008;71:1308–1316. doi: 10.1016/j.chemosphere.2007.11.047. [DOI] [PubMed] [Google Scholar]
- 83.Wu B, Zhuang WQ, Sahu M, Biswas P, Tang YJ. Sci Total Environ. 2011;409:4635–4639. doi: 10.1016/j.scitotenv.2011.07.037. [DOI] [PubMed] [Google Scholar]
- 84.Wu B, Wang Y, Lee YH, Horst A, Wang Z, Chen DR, Sureshkumar R, Tang YJ. Environ Sci Technol. 2010;44:1484–1489. doi: 10.1021/es9030497. [DOI] [PubMed] [Google Scholar]
- 85.Hessler CM, Wu MY, Xue Z, Choi H, Seo Y. Water Res. 2012;46:4687–4696. doi: 10.1016/j.watres.2012.06.009. [DOI] [PubMed] [Google Scholar]
- 86.Choi O, Hu ZQ. Environ Sci Technol. 2008;42:4583–4588. doi: 10.1021/es703238h. [DOI] [PubMed] [Google Scholar]
- 87.Dalai S, Pakrashi S, Kumar RSS, Chandrasekaran N, Mukherjee A. Toxicol Res. 2012;1:116–130. [Google Scholar]
- 88.Marambio-Jones C, Hoek E. J Nanopart Res. 2010;12:1531–1551. [Google Scholar]
- 89.Li D, Lyon DY, Li Q, Alvarez PJJ. Environ Toxicol Chem. 2008;27:1888–1894. doi: 10.1897/07-548.1. [DOI] [PubMed] [Google Scholar]
- 90.Zhang H, Smith JA, Oyanedel-Craver V. Water Res. 2012;46:691–9. doi: 10.1016/j.watres.2011.11.037. [DOI] [PubMed] [Google Scholar]
- 91.Delay M, Dolt T, Woellhaf A, Sembritzki R, Frimmel FH. J Chromatogr, A. 2011;1218:4206–4212. doi: 10.1016/j.chroma.2011.02.074. [DOI] [PubMed] [Google Scholar]
- 92.Zook J, Long S, Cleveland D, Geronimo C, MacCuspie R. Anal Bioanal Chem. 2011;401:1993–2002. doi: 10.1007/s00216-011-5266-y. [DOI] [PubMed] [Google Scholar]
- 93.Das P, Xenopoulos MA, Williams CJ, Hoque ME, Metcalfe CD. Environ Toxicol Chem. 2012;31:122–130. doi: 10.1002/etc.716. [DOI] [PubMed] [Google Scholar]
- 94.Birbaum K, Brogioli R, Schellenberg M, Martinoia E, Stark WJ, Günther D, Limbach LK. Environ Sci Technol. 2010;44:8718–8723. doi: 10.1021/es101685f. [DOI] [PubMed] [Google Scholar]
- 95.Du W, Sun Y, Ji R, Zhu J, Wu J, Guo H. J Environ Monit. 2011;13:822–828. doi: 10.1039/c0em00611d. [DOI] [PubMed] [Google Scholar]
- 96.Ma Y, Kuang L, He X, Bai W, Ding Y, Zhang Z, Zhao Y, Chai Z. Chemosphere. 2010;78:273–279. doi: 10.1016/j.chemosphere.2009.10.050. [DOI] [PubMed] [Google Scholar]
- 97.Priester JH, Ge Y, Mielke RE, Horst AM, Moritz SC, Espinosa K, Gelb J, Walker SL, Nisbet RM, An YJ, Schimel JP, Palmer RG, Hernandez-Viezcas JA, Zhao L, Gardea-Torresdey JL, Holden PA. Proc Natl Acad Sci USA. 2012;109:E2451–E2456. doi: 10.1073/pnas.1205431109. [DOI] [PMC free article] [PubMed] [Google Scholar]
- 98.Sabo-Attwood T, Unrine JM, Stone JW, Murphy CJ, Ghoshroy S, Blom D, Bertsch PM, Newman LA. Nanotoxicology. 2012;6:353–360. doi: 10.3109/17435390.2011.579631. [DOI] [PubMed] [Google Scholar]
- 99.Zhu H, Han J, Xiao JQ, Jin Y. J Environ Monit. 2008;10:713–717. doi: 10.1039/b805998e. [DOI] [PubMed] [Google Scholar]
- 100.Wang M, Chen L, Chen S, Ma Y. Ecotoxicol Environ Saf. 2012;79:48–54. doi: 10.1016/j.ecoenv.2011.11.044. [DOI] [PubMed] [Google Scholar]
- 101.Lin D, Xing B. Environ Pollut. 2007;150:243–250. doi: 10.1016/j.envpol.2007.01.016. [DOI] [PubMed] [Google Scholar]
- 102.Atha DH, Wang H, Petersen EJ, Cleveland D, Holbrook RD, Jaruga P, Dizdaroglu M, Xing B, Nelson BC. Environ Sci Technol. 2012;46:1819–1827. doi: 10.1021/es202660k. [DOI] [PubMed] [Google Scholar]
- 103.Burello E, Worth AP. Nanotoxicology. 2011;5:228–235. doi: 10.3109/17435390.2010.502980. [DOI] [PubMed] [Google Scholar]
- 104.Parsons JG, Lopez ML, Gonzalez CM, Peralta-Videa JR, Gardea-Torresdey JL. Environ Toxicol Chem. 2010;29:1146–1154. doi: 10.1002/etc.146. [DOI] [PubMed] [Google Scholar]
- 105.Lee WM, An YJ, Yoon H, Kweon HS. Environ Toxicol Chem. 2008;27:1915–1921. doi: 10.1897/07-481.1. [DOI] [PubMed] [Google Scholar]
- 106.Hischemoeller A, Nordmann J, Ptacek P, Mummenhoff K, Haase M. J Biomed Nanotechnol. 2009;5:278–284. doi: 10.1166/jbn.2009.1032. [DOI] [PubMed] [Google Scholar]
- 107.Chen R, Ratnikova TA, Stone MB, Lin S, Lard M, Huang G, Hudson JS, Ke PC. Small. 2010;6:612–617. doi: 10.1002/smll.200901911. [DOI] [PubMed] [Google Scholar]
- 108.Lin S, Reppert J, Hu Q, Hudson JS, Reid ML, Ratnikova TA, Rao AM, Luo H, Ke PC. Small. 2009;5:1128–1132. doi: 10.1002/smll.200801556. [DOI] [PubMed] [Google Scholar]
- 109.Begum P, Ikhtiari R, Fugetsu B. Carbon. 2011;49:3907–3919. [Google Scholar]
- 110.Hegeman AD. Briefings Funct Genomics. 2010;9:139–148. doi: 10.1093/bfgp/elp053. [DOI] [PubMed] [Google Scholar]
- 111.Dietz KJ, Herth S. Trends Plant Sci. 2011;16:582–589. doi: 10.1016/j.tplants.2011.08.003. [DOI] [PubMed] [Google Scholar]
- 112.Serag MF, Kaji N, Gaillard C, Okamoto Y, Terasaka K, Jabasini M, Tokeshi M, Mizukami H, Bianco A, Baba Y. ACS Nano. 2011;5:493–499. doi: 10.1021/nn102344t. [DOI] [PubMed] [Google Scholar]
- 113.Khodakovskaya MV, de Silva K, Nedosekin DA, Dervishi E, Biris AS, Shashkov EV, Galanzha EI, Zharov VP. Proc Natl Acad Sci USA. 2011;108:1028–1033. doi: 10.1073/pnas.1008856108. [DOI] [PMC free article] [PubMed] [Google Scholar]
- 114.Patlolla AK, Berry A, May L, Tchounwou PB. Int J Environ Res Public Health. 2012;9:1649–1662. doi: 10.3390/ijerph9051649. [DOI] [PMC free article] [PubMed] [Google Scholar]
- 115.Pan B, Xing B. Eur J Soil Sci. 2012;63:437–456. [Google Scholar]
- 116.Oberdorster E. Environ Health Perspect. 2004;112:1058–1062. doi: 10.1289/ehp.7021. [DOI] [PMC free article] [PubMed] [Google Scholar]
- 117.Oberdorster E, Zhu SQ, Blickley TM, McClellan-Green P, Haasch ML. Carbon. 2006;44:1112–1120. [Google Scholar]
- 118.Smith CJ, Shaw BJ, Handy RD. Aquat Toxicol. 2007;82:94–109. doi: 10.1016/j.aquatox.2007.02.003. [DOI] [PubMed] [Google Scholar]
- 119.Federici G, Shaw BJ, Handy RD. Aquat Toxicol. 2007;84:415–430. doi: 10.1016/j.aquatox.2007.07.009. [DOI] [PubMed] [Google Scholar]
- 120.Henry TB, Menn FM, Fleming JT, Wilgus J, Compton RN, Sayler GS. Environ Health Perspect. 2007;115:1059–1065. doi: 10.1289/ehp.9757. [DOI] [PMC free article] [PubMed] [Google Scholar]
- 121.Postlethwait JH, Johnson SL, Midson CN, Talbot WS, Gates M, Ballinger EW, Africa D, Andrews R, Carl T, Eisen JS, Horne S, Kimmel CB, Hutchinson M, Johnson M, Rodriguez A. Science. 1994;264:699–703. doi: 10.1126/science.8171321. [DOI] [PubMed] [Google Scholar]
- 122.Kasahara M, Naruse K, Sasaki S, Nakatani Y, Qu W, Ahsan B, Yamada T, Nagayasu Y, Doi K, Kasai Y, Jindo T, Kobayashi D, Shimada A, Toyoda A, Kuroki Y, Fujiyama A, Sasaki T, Shimizu A, Asakawa S, Shimizu N, Hashimoto S-i, Yang J, Lee Y, Matsushima K, Sugano S, Sakaizumi M, Narita T, Ohishi K, Haga S, Ohta F, Nomoto H, Nogata K, Morishita T, Endo T, Shin TI, Takeda H, Morishita S, Kohara Y. Nature. 2007;447:714–719. doi: 10.1038/nature05846. [DOI] [PubMed] [Google Scholar]
- 123.Handy RD, Henry TB, Scown TM, Johnston BD, Tyler CR. Ecotoxicology. 2008;17:396–409. doi: 10.1007/s10646-008-0205-1. [DOI] [PubMed] [Google Scholar]
- 124.Handy RD, van den Brink N, Chappell M, Muehling M, Behra R, Dusinska M, Simpson P, Ahtiainen J, Jha AN, Seiter J, Bednar A, Kennedy A, Fernandes TF, Riediker M. Ecotoxicology. 2012;21:933–972. doi: 10.1007/s10646-012-0862-y. [DOI] [PMC free article] [PubMed] [Google Scholar]
- 125.Kwok KWH, Auffan M, Badireddy AR, Nelson CM, Wiesner MR, Chilkoti A, Liu J, Marinakos SM, Hinton DE. Aquat Toxicol. 2012;120–121:59–66. doi: 10.1016/j.aquatox.2012.04.012. [DOI] [PubMed] [Google Scholar]
- 126.Kashiwada S, Ariza ME, Kawaguchi T, Nakagame Y, Jayasinghe BS, Gartner K, Nakamura H, Kagami Y, Sabo-Attwood T, Ferguson PL, Chandler GT. Environ Sci Technol. 2012;46:6278–6287. doi: 10.1021/es2045647. [DOI] [PubMed] [Google Scholar]
- 127.George S, Lin S, Ji Z, Thomas CR, Li L, Mecklenburg M, Meng H, Wang X, Zhang H, Xia T, Hohman JN, Lin S, Zink JI, Weiss PS, Nel AE. ACS Nano. 2012;6:3745–3759. doi: 10.1021/nn204671v. [DOI] [PMC free article] [PubMed] [Google Scholar]
- 128.Oades JM. Geoderma. 1993;56:377–400. [Google Scholar]
- 129.Petersen EJ, Huang Q, Weber WJ., Jr Environ Sci Technol. 2008;42:3090–3095. doi: 10.1021/es071366f. [DOI] [PubMed] [Google Scholar]
- 130.Petersen EJ, Pinto RA, Landrum PF, Weber WJ., Jr Environ Sci Technol. 2009;43:4181–4187. doi: 10.1021/es803023a. [DOI] [PubMed] [Google Scholar]
- 131.Hu CW, Li M, Cui YB, Li DS, Chen J, Yang LY. Soil Biol Biochem. 2010;42:586–591. [Google Scholar]
- 132.van Gestel CAM, Kool PL, Ortiz MD. Soil Biol Biochem. 2010;42:1892–1893. [Google Scholar]
- 133.Tourinho PS, van Gestel CAM, Lofts S, Svendsen C, Soares AMVM, Loureiro S. Environ Toxicol Chem. 2012;31:1679–1692. doi: 10.1002/etc.1880. [DOI] [PubMed] [Google Scholar]
- 134.Heckmann LH, Hovgaard MB, Sutherland DS, Autrup H, Besenbacher F, Scott-Fordsmand JJ. Ecotoxicology. 2011;20:226–233. doi: 10.1007/s10646-010-0574-0. [DOI] [PubMed] [Google Scholar]
- 135.Unrine JM, Tsyusko OV, Hunyadi SE, Judy JD, Bertsch PM. J Environ Qual. 2010;39:1942–1953. doi: 10.2134/jeq2009.0387. [DOI] [PubMed] [Google Scholar]
- 136.Shoults-Wilson WA, Reinsch BC, Tsyusko OV, Bertsch PM, Lowry GV, Unrine JM. Soil Sci Soc Am J. 2011;75:365–377. [Google Scholar]
- 137.Ferry JL, Craig P, Hexel C, Sisco P, Frey R, Pennington PL, Fulton MH, Scott IG, Decho AW, Kashiwada S, Murphy CJ, Shaw TJ. Nat Nanotechnol. 2009;4:441–444. doi: 10.1038/nnano.2009.157. [DOI] [PubMed] [Google Scholar]
- 138.Handler RM, Beard BL, Johnson CM, Scherer MM. Environ Sci Technol. 2009;43:1102–1107. doi: 10.1021/es802402m. [DOI] [PubMed] [Google Scholar]
- 139.Zhang L, Petersen EJ, Huang Q. Environ Sci Technol. 2011;45:1356–1362. doi: 10.1021/es1026097. [DOI] [PubMed] [Google Scholar]
- 140.Kim B, Park CS, Murayama M, Hochella MF. Environ Sci Technol. 2010;44:7509–7514. doi: 10.1021/es101565j. [DOI] [PubMed] [Google Scholar]