Abstract
Cryo-electron microscopy is an experimental technique that is able to produce 3D gray-scale images of protein molecules. In contrast to other experimental techniques, cryo-electron microscopy is capable of visualizing large molecular complexes such as viruses and ribosomes. At medium resolution, the positions of the atoms are not visible and the process cannot proceed. The medium-resolution images produced by cryo-electron microscopy are used to derive the atomic structure of the proteins in de novo modeling. The skeletons of the 3D gray-scale images are used to interpret important information that is helpful in de novo modeling. Unfortunately, not all features of the image can be captured using a single segmentation. In this paper, we present a segmentation-free approach to extract the gray-scale curve-like skeletons. The approach relies on a novel representation of the 3D image, where the image is modeled as a graph and a set of volume trees. A test containing 36 synthesized maps and one authentic map shows that our approach can improve the performance of the two tested tools used in de novo modeling. The improvements were 62 and 13 percent for Gorgon and DP-TOSS, respectively.
Index Terms: Image processing, graphs, modeling techniques, volumetric image representation
1 Introduction
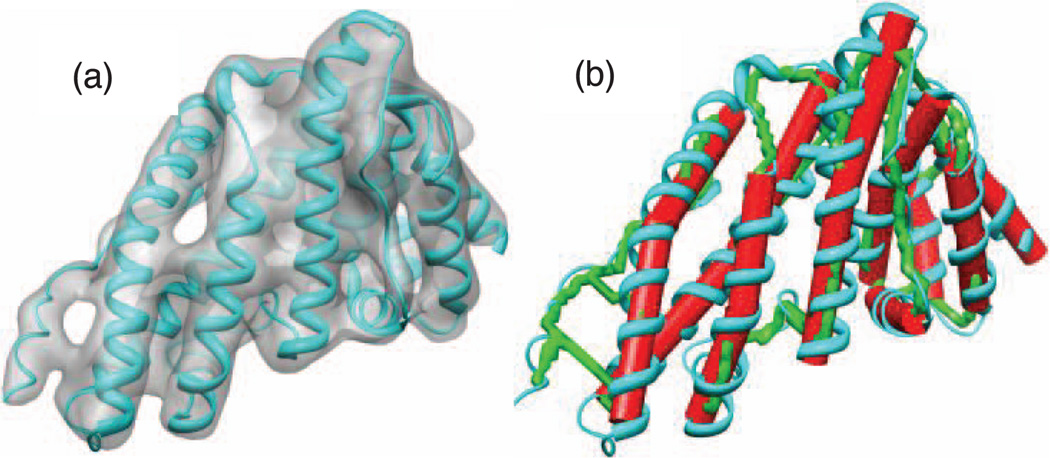
Many biomedical fields produce 3D volume images, such as computed tomography imaging (CTI), magnetic resonance imaging (MRI), and cryo-electron microscopy (CryoEM). Two types of images are produced, binary and gray-scale images. In binary images, the voxels are divided into foreground and background. In gray-scale images, the foreground voxels are characterized by different magnitude of intensity. More intense voxels are more likely to reside around the center of the shape represented by the object. For example, a 3D gray-scale image of an n-terminal domain of clathrin assembly lymphoid myeloid leukemia protein (PDB ID: 1HG5) is shown in Fig. 1a. The image is synthesized using molmap command in Chimera package [1].
Fig. 1.
An example of a 3D gray-scale image. A 3D gray-scale image of a protein molecule Calm N-terminal domain of clathrin assembly lymphoid myeloid leukemia protein (PDB ID: 1HG5) is shown in (a). The skeleton (in green) is shown in (b). The red cylinders-like represent helical SSEs-V. The skeleton provides a great help to identify the connections between SSEs-V. The connections provided are used to prune the huge search space and to derive the atomic structure of the loops.
Currently, more attention has been given to automatic understanding or simplification of the 3D objects. One approach is to obtain a simple and representative shape. The size of useful data is small proportional to the large amount of data saved in the volume images. Thus, the most of structural features and geometrical properties of the object such as the backbone structure of the protein and its connectivity, blood vessels morphology, and cell lengths can be carried by a small set of voxels called skeleton. The skeleton is a compact, usually one-voxel width, set of connected centerlines that are topologically comparable to the object. In other words, the skeleton is a simplified and thin version of the object that highlights the geometrical and structural features. In addition to its applications in medical analysis, skeleton is widely useful in various fields such as image processing and pattern recognition, computer vision, and de novo protein modeling.
Numerous methods have been developed to extract the skeletons from 3D images [2], [3], [4], [5], [6], [7]. Skeletonization of 3D binary images has been widely investigated. The methods for computing the skeletons can be algorithmically classified into four groups [8], [9]: thinning [10], [11], [12], [13], Voronoi-based methods [14], [15], [16], distance field methods [17], [18], [19], [20], and mathematical morphology [21], [22]. Thinning algorithms peel away layers of the object. The basic idea is to delete the boundary voxels of the object in iterative manner. The voxel to be deleted is simple and its deletion does not alter the topology of the object. Thinning algorithms can be classified into sequential [23] or parallel [10]. The main disadvantage of thinning algorithms is the redundant and spurious branches [9]. Voronoi-based methods search for a subset of points of which each point represents the maximal disk contained in the given component. Further pruning may be applied to remove complicated skeleton branches [9]. Distance maps-based algorithms detect ridges in a distance map of the boundary points. The completeness and the connectivity are not guaranteed in these approaches [9], [17], [19]. Mathematical morphology methods classify the voxels of the image to either medial or nonmedial. Usually, thin and accurate skeletons are produced. However, the connectivity of the skeleton is not guaranteed [9].
In contrast to the 3D binary images, 3D gray-scale images have received less attention [24], [25], [26], [27]. Approaches on unsegmented gray-scale images are rare [26], [27]. Most of the methods apply an initial segmentation to remove the less representative foreground voxels [13]. The resulting image is used for a binary skeletonization. Skeletons extracted using these methods suffer from the under-representation of weak regions. Some approaches extract skeleton parts at a limited number of segmentations. The parts of the skeleton are then filtered and merged into a single skeleton [25]. In a similar manner, Dokládal et al. [28] extract the skeleton of the object without any segmentation. The resulting skeleton is not free of errors due to the presence of noise. A filtering step is then applied to remove the insignificant skeleton parts that are seeded by the noise. Another approach combines distance information with gray-scale information [24]. An initial surface skeleton is first extracted and a simplification is carried out by removing some of its peripherals using the intensity and distance information. Some other methods use the structural tensor [29], [30]. Such methods classify the voxel into some predefined classes and need some domain knowledge [29].
An important application of skeletonization is in de novo modeling. Recent work shows the importance of using the skeleton of CryoEM 3D gray-scale images in de novo modeling [31], [32], [33], [34]. Unfortunately, many 3D skeletonization algorithms still have limitations when the noise is present. Generally, there is no accepted skeletonization criterion that yields to a noise resistant and fully connected 3D skeletons [8]. De novo modeling is sensitive to the errors that exist in the skeleton (will be shown in the results section). Moreover, some weak regions in CryoEM images are as important as strong regions. If these regions are not carefully considered, the resulting skeleton may have discontinued regions that may mislead the whole process of the modeling.
1.1 Cryo-Electron Microscopy and De Novo Modeling
CryoEM is an advanced imaging technique that aims at visualizing and interpreting unstained biological nanostructures complexes such as viruses [35], [36], [37], [38]. In contrast to traditional experimental techniques used to determine protein structures, CryoEM is able to produce volumetric images of protein molecules that are poorly soluble, large, and hard to crystallize. Using the current advances of CryoEM, it is possible to produce the 3D gray-scale images (henceforth affectionately referred to density maps) of a protein molecule in the high resolution range, such as 3–5-Å resolution [39], [40]. At this resolution, the connection between the secondary structures is mostly distinguishable and the backbone of the structure can be derived [41], [42]. Due to various experimental difficulties, many proteins have been resolved to the medium resolution range (5–10-Å resolutions). Since the first density map reported for hepatitis B virus in 1997 [43], [44], many density maps of large protein complexes have been generated [37], [39], [44], [45], [46], [47]. The electron microscopy data bank (EMDB) currently contains more than 1,600 density map entries in addition to more than 490 PDB entries of fitted coordinates. The deposition rate of density maps and fitted PDB models in 2008 and 2009 were around 150 and 40 per year [48].
In contrast to the ab initio and comparative modeling, de novo modeling aims to derive the atomic structure of the protein using the information obtained from the 3D density map and the 1D structure of the protein. At medium resolution range, the atomic structure of the protein cannot be derived directly from the density map. In contrast, the location and the orientation of major secondary structure elements on the density map (SSEs-V) such as helices and β-sheets are detectable [49], [50], [51]. On the other hand, the locations of the secondary structures (SSEs-S) are predictable from the sequence of the protein with accuracy around 80 percent [52], [53]. The early step in de novo modeling is to find the correct registration between SSEs-V and SSEs-S. The order and the direction of assigning the SSEs-S to SSEs-V is called protein topology. Topology determination is challenging and is proven to be NP-hard [32]. The total number of possible topologies is , where M is the number of SSEs-S and N is the number of SSEs-V. To derive the backbone of the protein, the only correct topology of the SSEs has to be determined first and then the backbone of the protein can be derived for further optimization [31], [33], [54], [55], [56].
Many de novo modeling approaches have been proposed [34], [55], [56], [57], [58], [59]. Some of the approaches use another piece of information from the density map to reduce the search space of the topology problem or to derive the final atomic structure of the protein. This piece of information is the skeleton of the density map. CryoEM skeleton adds another dimension of useful information that highlights the connections between SSEs-V. A high-quality skeleton can drastically reduce the huge topological space and efficiently help to find the true topology. For example, in Fig. 1b, the skeleton provides very important information that shows the connections between SSEs-V. These connections are helpful in the process of protein topology determination as well as the final derivation of the protein structure.
1.2 CryoEM Skeleton
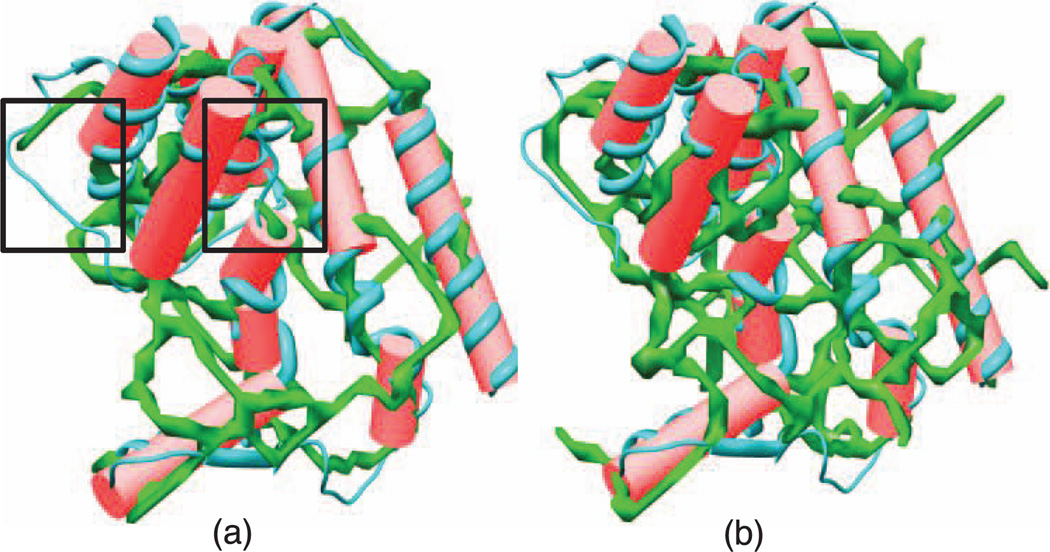
Three tools have been developed to extract the skeleton of the density maps, binary skeletonizer [13], gray-scale skeletonizer [25], and interactive skeletonizer [60]. The interactive skeletonizer is a semiautomatic tool that depends on user intervention and is out of our interest. The method used to generate the binary skeleton is composed of two algorithms: iterative thinning and skeleton pruning [13]. On the other hand, the gray-scale skeleton is generated by applying the binary skeletonization on a range of segmentations at different threshold levels [25]. The algorithm mainly employs the idea of structure tensor in addition to feature extraction. In contrast to the binary skeleton, the gray-scale skeleton does not suffer from threshold dependency and does not need a segmentation process. However, the method depends on an initial threshold value and iteratively decreases the threshold and captures a set of curves and surfaces of the density map at each threshold level. The produced skeleton is less biased to human intervention. In consequence, the quality of the gray-scale skeletons is enhanced compared to the binary skeletons. Unfortunately, the problem of skeleton incompleteness still exists on both skeletons. The threshold used to extract the skeleton (in binary skeletonizer) and the initial threshold (in gray-scale skeletonizer) plays a major role in the final quality of the skeletons in both methods. Based on our experience, no single threshold can be used to capture all features of the density map. When a less selective density threshold is used, more misleading connections appear in the skeleton. In contrast, using a more selective threshold will result in discontinuities. For example, Fig. 2 shows two skeletons of a density map extracted using the binary method overlaid with the detected SSEs-V. The two skeletons extracted at 1.2 (Fig. 2a) and 1.1 (Fig. 2b) threshold, respectively. When the skeleton (green) is superimposed with SSEs-V (red sticks), the connection relationship among the sticks is revealed. Two factors impact the final quality of the skeleton: the quality of the original density map and the threshold used to extract the skeleton. When the resolution of the density map is high, the skeleton is well resolved. However, at a medium resolution, the skeleton can be misleading and incomplete. For example, there can be multiple outgoing spurs from the end of helical sticks (Fig. 2b) leading to different sticks. The misleading connection is common when the skeleton is obtained with a less selective density threshold (Fig. 2b). However, using a more selective threshold will result in gaps (the boxed regions in Fig. 2a) in the skeleton, where it is supposed to be connected. Although the two skeletons in Fig. 2 are extracted at relatively close threshold levels, the visual difference between them does not give this impression. Therefore, the skeleton provides important connection information between most of the secondary structure elements, but it is not completely reliable.
Fig. 2.
An example of a skeleton (in green) produced by Gorgon for the authentic density map at 6.8-Å resolution (EMDB ID 5100) and the corresponding protein “Scorpion Hemocyanin resting state” (PDB ID 3IXV). The red cylinders represent helical SSEs-V. (a) The skeleton is extracted at 1.2 threshold and two gaps are shown in the black boxes. (b) The skeleton is extracted at 1.1 threshold. No gaps are present but more outgoing spurs connections can be visually seen clearly.
In this paper, we propose a novel noniterative method to extract the curve skeleton of the object (i.e., protein molecule) in the given 3D density map. Our approach only considers the interior gray intensity values of the density map. In brief, the algorithm locates the critical voxels based on their intensities and efficiently calculates the paths through the object by connecting these voxels. The new approach detects local peak voxels at all gray levels, which lead to a complete skeleton that is less sensitive to the noise. The resulting skeleton is more robust and informative than the skeletons extracted by current methods (the comparison is shown in results section).
2 Materials and Methods
2.1 Basic Notions
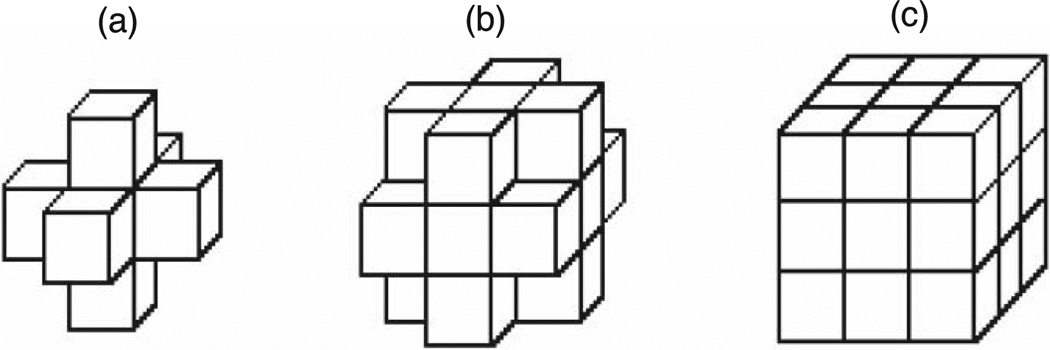
The 3D skeleton is a set of points describes the shape of the density map in a simplified and compact way. The density map and the skeleton are examples of volumetric images. The volume image is defined on an orthogonal grid, ℤ3. Each point in the image corresponding to a cubic volume is called a voxel. In the grid cell model, the cells of a cube in a 3D volume are 3D voxel locations with integer coordinates. The voxel p can be referred to by its orthogonal location (x, y, z). The neighborhood of voxel p can be divided into three levels (Fig. 3). N6(p) = {(x′, y′, z′) : |x − x′| + |y − y′| + |z − z′| ≤ 1} includes the center of voxel p and its 6-adjacent voxels that differ from p in at most one coordinate unit.
N18(p) = {(x′, y′, z′) : |x − x′| + |y − y′| + |z − z′| ≤ 2, max(|x − x′|, |y − y′|, |z − z′|) = 1}
includes the voxels that differ from p in at most two coordinate units, and N26(p) = {(x′, y′, z′) : |x − x′| + |y − y′| + |z − z′| ≤ 3, max(|x − x′|, |y − y′|, |z − z′|) = 1} includes voxels whose coordinate values differ by at most one unit from p. The neighborhood relation is symmetric, if voxel p ∈ Nx(q), then q ∈ Nx(p). The value saved in the cell corresponding to voxel p represents the associated magnitude of the electron gray intensity of the protein at that location and is denoted by I(p). The voxel p is a foreground voxel if I(p) > 0 otherwise voxel p is considered a background voxel. The voxel p is called end voxel if only one foreground voxel can be found in N6(p)/p.
Fig. 3.
The grid cell model of the volume image. (a)N6(p), the 6-adjacent neighbor relation of voxel p. (b) N18(p), the 18-adjacent neighbor relation of voxel p. (c) N26(p), the 26-adjacent neighbor relation of voxel p.
Let MAP be the grid cell model of the original density map and let MAPG = (Vm, Em) denote the corresponding undirected graph for the foreground voxels in MAP, where Vm = {υ : υ = p and I(p) > 0} is the set of nodes. Each node represents a foreground voxel and Em = {(υ1, υ2) : υ1 ∈ N6(υ2), υ1 ≠ υ2} is the set of edges that connect the nodes which are parts of the 6-adjacent neighborhood to each other. In this paper, the terms node and voxels are used interchangeably to refer to the nodes of the graph. In the graph model, voxel p is called end voxel if it is connected to only one other voxel. Due to the existence of some end voxels, MAPG is actually a forest of trees that are not necessarily connected.
2.2 Method
Our approach relies on the observation that a single segmentation cannot capture all features of the density map. The threshold used to extract the skeleton is more likely to miss some features of the density map at some places. The relatively weak regions are prospective gaps in the skeleton. At a particular threshold, some local regions will have weak or no density while others may have excessive density. For example, at less selective thresholds, the density around two parallel helices may be wrongly recognized as a sheet. In contrast, at more selective thresholds, a gap may occur in some weak places (Fig. 2a). A possible approach is to develop a skeletonizer that samples the density map at different segmentation levels [25]. The skeleton extracted using this approach may not exhibit the desired topology of the object and spurious loops may present in the final skeleton. Moreover, the iterative thinning at different segmentations is time consuming. Therefore, we present a fast true segmentation-free method to overcome the incompleteness problem of the skeletons extracted from the density maps.
The first step in our approach is to preprocess MAP to keep only voxels with high intensity in a small neighborhood. We observe that such voxels are good representatives for local regions. We apply the concept of a screening filter called the local-peak-counter (LPC) proposed in sheettracer [61]. The LPC aims at identifying voxels that are most likely around the trace of the backbone of the protein. The LPC rewards voxels with high local density values and thereby tolerates the variations in the magnitude of gray intensities throughout the density map. The LPC prevents ignoring backbone voxels in regions of relatively weak intensity. In LPC, for each voxel p, the average intensity of a cube centered at p and with edge length of 7 Å is calculated. The parameter 7 is chosen to guarantee that the cube covers the width of all substructures of the protein (i.e., helices, sheets, and turns). Those voxels in the cube with gray intensity value greater than the calculated average have their counter incremented. At the end of counting, each voxel, that is intense more than 90 percent of the average intensities calculated for the 343 cubes formed around it, is saved in a new grid model called PEAKS. The cutoff value 90 percent is chosen based on our observation. When a higher cutoff value is used (i.e., >90 percent), some important voxels on the backbone of the protein maybe missed. On the other hands, when a lower cutoff value is used, more spurs voxels maybe added to the local peaks. The running time to calculate the local peaks of the density map is O(c3XY Z). Where c is the edge length of the cube, X is the length of the density map along x-axis, Y is the length of the density map along the y-axis, and Z is the length of the density map along the z-axis. If the image is assumed to be cubic (i.e., X = Y = Z = n), the running time becomes O(c3n3).
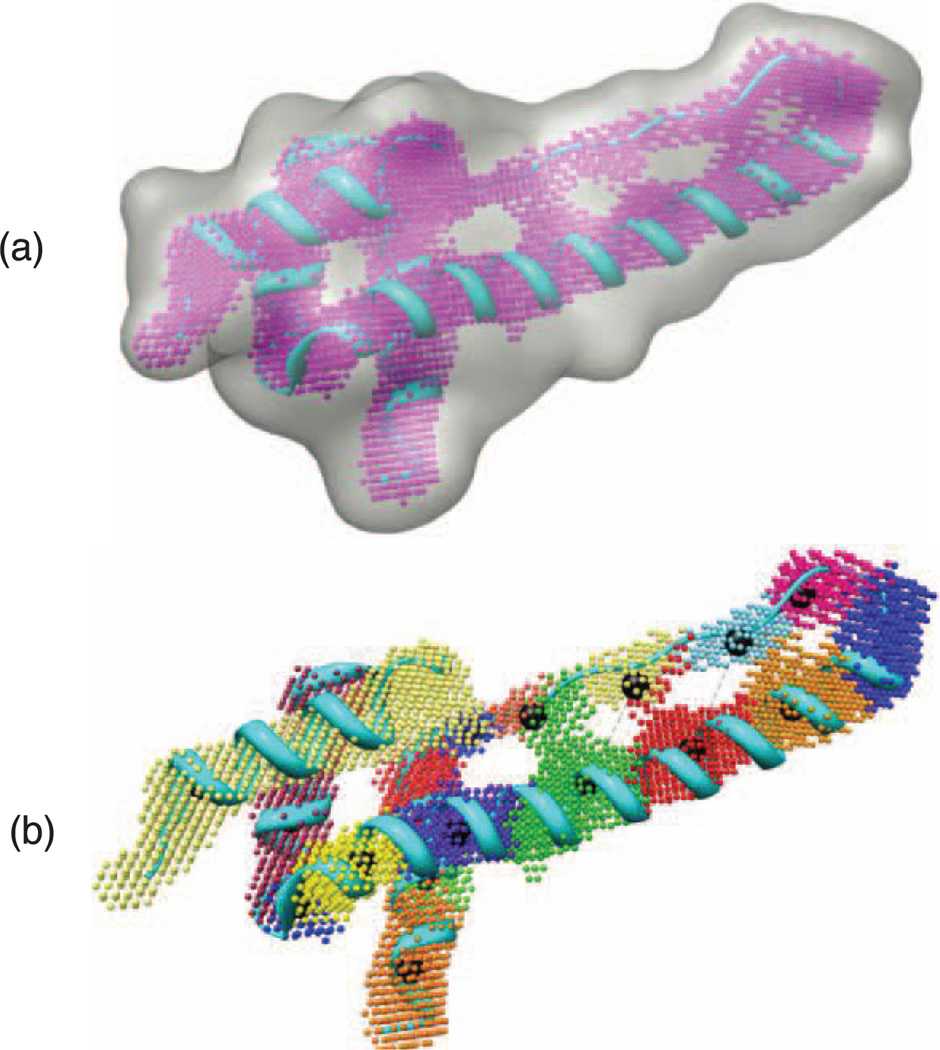
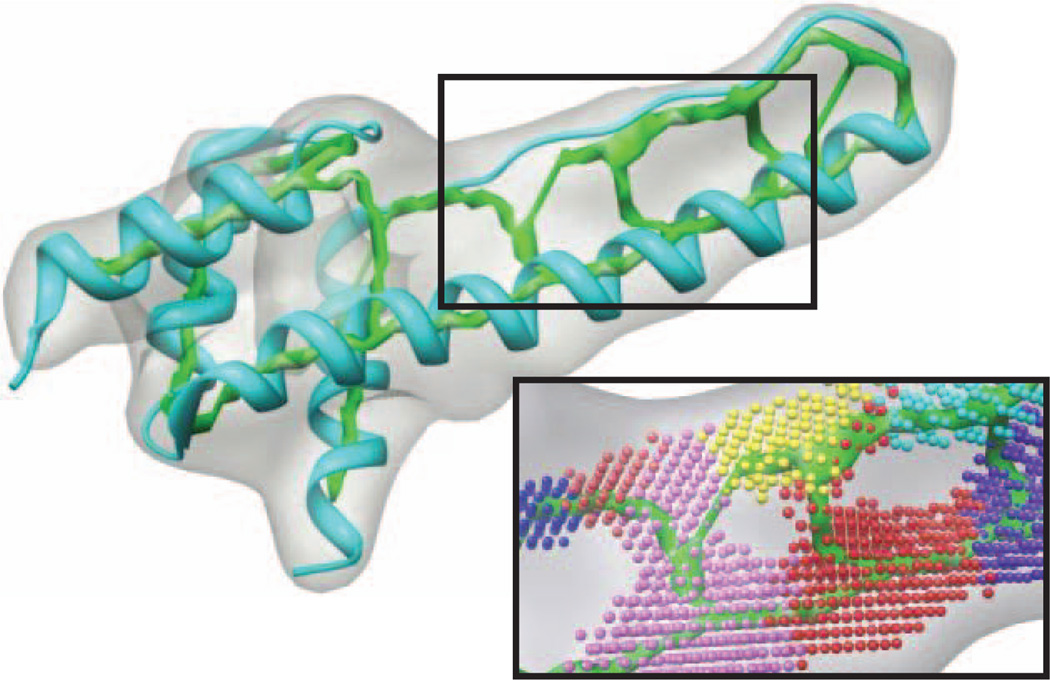
The essential idea used in this approach is to locate the local volume peaks in the density map. The local volume peaks are more likely to indicate the existence of backbone atoms of the protein molecule. Our approach divides the map into a number of volumes that satisfy certain properties. Volume-based separation was used by helix tracer [51]. The insight of the separation process is to recognize the clusters of voxels that are of high local density. The separation of the PEAKS can be accomplished by building the corresponding directed graph PEAKSG = (Vp, Ep), where Vp is the set of nodes representing the voxels in PEAKS and Ep = {(υ1, υ2) : υ2 ∈ N6(υ1), I(υ2) = maxυ∈N6(υ1)[I(υ)]} is a set of directed edges from the voxel to the highest-intensity voxel in its 6-adjacent neighborhood. PEAKSG is a directed acyclic graph and it is, if a linear asymptotic running time function is used to invert the direction of edges, actually a forest of trees because it is not necessarily connected. The volume trees implicitly built in this graph construction provide a separation of the density map into distinct volumes. The root of each tree is the voxel with the highest density in the volume. For the voxel p, let the volume tree containing p be denoted by VOLTREE(p). Given PEAKSG and any voxel p ∈ Vp, the construction of VOLTREE(p) is simple and direct. Fig. 4a depicts an example of PEAKSG (in pink). The local peaks are calculated for the synthesis density map of the creosote rubisco activase C-domain (PDB ID: 3THG). Volume trees built for the same protein are shown in Fig. 4b. The trees are shown in different colors.
Fig. 4.
Local peak voxels for the creosote rubisco activase C-domain (PDB ID: 3THG). (a) Local peaks voxels are shown in pink after applying our method. (b) Volume trees formed and shown in different colors. The root for each tree is augmented and colored in black.
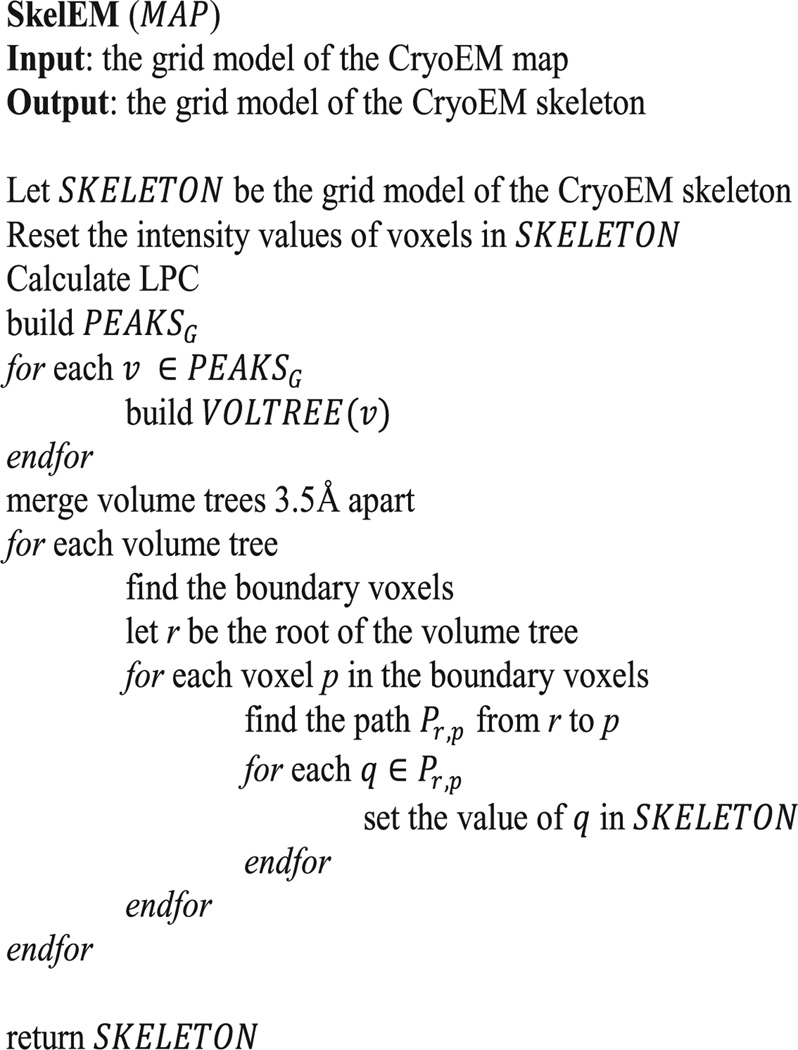
The resulting volume trees built for the map provide a robust clustering of the local peaks. At some regions, and due to the noise, small volume trees may exist. To overcome this problem, small and spatially close volume trees are merged. Any two volume trees 3.5 Å apart are merged into one tree and the root of the largest volume tree becomes the root of the new volume tree. A directed edge from the boundary voxel of the large volume tree to the boundary voxel of the small volume tree is added. To find the voxels in contact, where the two trees should be merged, the algorithm finds two voxels, one from each tree. These voxels are 6-adjacent neighbors to each other and have the maximum summation of the intensities. The final process of our approach is to connect the volume trees in an efficient way. The boundary voxels of each tree are marked. The voxel is a boundary voxel if it is a leaf node in the volume tree and it has at least one 6-adjacent neighbor from another volume tree. If more than two boundary voxels found between the two volume trees, only the boundary voxels with the maximum summation of their intensities are marked. The voxels included in the final skeleton are marked after the method finds the boundary voxels in each volume tree. A simple process takes place to find the paths from the root of each volume tree to the boundary voxels in the same volume tree. The direction of the edges in the volume trees is omitted in this step. Each voxel in the calculated paths is part of the new skeleton. To find the paths, Dijkstra’s algorithm [62] is used. The running time of the algorithm to find the paths for each volume tree is O(E + VlogV), where E and V are the number of edges and the number of voxels in the volume tree, respectively. Fig. 5 shows the final skeleton of the 3THG (PDB ID) protein. The voxel is added to the skeleton and its associated intensity is saved. The skeleton with associated intensity for each voxel is helpful when it is used in de novo modeling. The pseudocode of the algorithm used to extract the gray skeleton is shown in Fig. 6.
Fig. 5.
The gray-scale skeleton of the protein 3THG (PDB ID). The paths found between some volume trees are shown in the box at the right.
Fig. 6.
The pseudocode of the algorithm used to extract the gray-skeleton.
The proposed method to extract the skeleton is simple and fast. The path between the root voxel to any of the boundary voxels is the strongest gray level between the two voxels. At the end of this process, the voxels with the highest local intensities are marked and become part of the new skeleton. From our experience, the backbone of the protein molecule tends to be on the regions with highest intensities. The advantages of our method are its speed, robustness, and easiness comparative to other methods.
3 Results
A set of 37 density maps and their associated skeletons were used to evaluate the performance of our approach. Thirty six of the density maps are synthesized to 10 Å resolution using the structure of the protein and molmap command in Chimera package [1]. One density map (EMDB ID: 5030 with 6.4-Å resolution) is the authentic data downloaded from the EMDB. The backbone structure (PDB ID: 3FIN_R) of the authentic density map is available in the PDB and is aligned with the density map in EMDB. The 36 proteins selected for the synthesized maps are helical due to the fact that helices are often detected more accurately than the β-sheets in the medium resolution density maps. It is still a challenging problem to detect the SSEs-V from the medium resolution data when β-sheets are involved. Therefore, sheet-type SSEs-V are not considered in this test and the strands in the authentic data will be treated as loops or turns. For each density map, we used SSETracer [49] to detect the helical SSEs-V sticks. The true location of the helical SSEs-S is generated from the PDB file of the protein structures.
We compared the skeleton generated by our method with the skeleton generated by Gorgon [34]. The skeleton is obtained using Gorgon 2.1 [34]. A binary skeleton [13], also generated by gorgon, is used as the base to extract the grayscale skeleton [25]. In general, the criterion used to extract the skeleton from the density map is to extract the skeleton at a threshold level that visually minimizes the sheet planes in the skeleton and shows the connections between helical sticks. Gorgon 2.1 and DP-TOSS [31], [32] are used to evaluate the impact of the two skeletons on the accuracy of final ranking of the true topology for each protein. The correctness evaluation of the two methods is carried out by comparing the produced topologies with the correct topology of each protein obtained from the PDB. The rank of the true topology is then reported in Table 1. A failure is reported (N/A in Table 1) if the tool cannot find the true topology within the top 35 topologies. We used the same helical SSEs-S and SSEs-V detected by SSETracer for both tools. A Max Euclidian Loop Distance parameter (ε) is set to be 15 Å. In order not to miss the true links between the two sticks, a link is created in Gorgon to compensate for the missing representation of the link in the skeleton. ε is the threshold parameter for the link creation. All other parameters used are the default parameters in Gorgon. The gap tolerance threshold used in DP-TOSS is set to 10 Å. DP-TOSS can overcome the problem of the gaps in skeletons for a specific length. The gap tolerance is the length of the gaps that DP-TOSS can deal with.
TABLE 1.
The Accuracy of Topology Determination Using Two of Skeletonization
| Num | Proteina | SkelEM's Skeleton | Gorgon's Skeleton | |||||
|---|---|---|---|---|---|---|---|---|
| DP-TOSS rankb |
Gorgon rankc |
Timed | THREsholde | DP-TOSS rank |
Gorgon rank |
Timef | ||
| 1 | 1ENK | 34 | 7 | 4.0 | 0.32/0.30 | 16 | 6 | 53.6 |
| 2 | 3FIN | 2 | 1 | 0.5 | 3.70/2.50 | 3 | 3 | 14.5 |
| 3 | 3THG | 1 | 1 | 3.4 | 0.32/0.28 | 1 | 1 | 56.2 |
| 4 | 1GV2 | 6 | 3 | 3.1 | 0.37/0.33 | 5 | N/A | 52.3 |
| 5 | 1FLP | 1 | 1 | 2.7 | 0.33/0.28 | 1 | 1 | 48.0 |
| 6 | 3IEE | 1 | 16 | 4.8 | 0.38/0.35 | 3 | N/A | 76.0 |
| 7 | 1HG5 | 1 | 1 | 4.9 | 0.36/0.32 | 1 | 1 | 70.2 |
| 8 | 2OVJ | 2 | 2 | 3.7 | 0.39/0.35 | 2 | N/A | 70.9 |
| 9 | 2XB5 | 2 | 1 | 4.5 | 0.35/0.29 | 3 | 1 | 72.0 |
| 10 | 1P5X | 6 | 22 | 4.1 | 0.49/0.37 | 2 | N/A | 68.8 |
| 11 | 1QAZ | 2 | 1 | 5.2 | 0.37/0.32 | N/A | N/A | 80.2 |
| 12 | 1HV6 | 35 | 1 | 4.8 | 0.36/0.29 | N/A | N/A | 69.3 |
| 13 | 1WER | 1 | 1 | 5.6 | 0.36/0.31 | 1 | N/A | 78.3 |
| 14 | 3HJL | 1 | 1 | 9.8 | 0.31/0.25 | 7 | N/A | 135.9 |
| 15 | 1BZ4 | 1 | 1 | 3.6 | 0.32/0.28 | 1 | 1 | 56.6 |
| 16 | 1CTJ | 35 | 1 | 2.1 | 0.37/0.35 | 4 | 2 | 40.0 |
| 17 | 1HZ4 | 17 | 1 | 6.1 | 0.37/0.33 | 17 | 1 | 82.7 |
| 18 | 1I8O | 30 | N/A | 2.7 | 0.35/0.31 | 3 | N/A | 44.5 |
| 19 | 1J77 | 2 | 1 | 4.3 | 0.35/0.30 | 4 | 1 | 66.6 |
| 20 | 1JMW | 1 | 1 | 3.4 | 0.36/0.28 | 1 | 1 | 52.7 |
| 21 | 1LWB | 2 | 1 | 3.2 | 0.44/0.42 | 1 | 1 | 51.9 |
| 22 | 1NG6 | 1 | 3 | 4.3 | 0.35/0.28 | 2 | 3 | 67.0 |
| 23 | 1XQO | 14 | N/A | 4.3 | 0.39/0.35 | 12 | N/A | 65.6 |
| 24 | 2IU1 | 4 | 2 | 3.7 | 0.36/0.30 | N/A | N/A | 56.0 |
| 25 | 2PSR | 5 | 10 | 2.7 | 0.34/0.30 | 9 | 12 | 45.2 |
| 26 | 2PVB | 15 | 28 | 2.8 | 0.39/0.35 | N/A | 22 | 44.8 |
| 27 | 2VZC | 1 | 24 | 2.7 | 0.39/0.32 | 2 | N/A | 45.8 |
| 28 | 2X0C | 6 | 1 | 5.8 | 0.36/0.33 | 7 | 1 | 87.4 |
| 29 | 2X3M | 2 | 1 | 3.5 | 0.40/0.33 | 1 | 1 | 58.3 |
| 30 | 3ACW | 3 | 2 | 4.8 | 0.37/0.30 | 28 | N/A | 75.3 |
| 31 | 3HBE | 2 | 7 | 3.4 | 0.39/0.34 | 27 | 6 | 56.6 |
| 32 | 3LTJ | 1 | 1 | 3.5 | 0.37/0.37 | 1 | 2 | 57.2 |
| 33 | 3NPH | 1 | 1 | 3.1 | 0.38/0.33 | 1 | N/A | 51.6 |
| 34 | 3ODS | 31 | 32 | 4.9 | 0.36/0.33 | 31 | N/A | 75.1 |
| 35 | 3PIW | 2 | 1 | 3.4 | 0.38/0.35 | 1 | 1 | 56.2 |
| 36 | 3PYW | N/A | N/A | 3.7 | 0.35/0.30 | N/A | N/A | 59.9 |
| 37 | 3SO8 | 8 | 4 | 3.7 | 0.37/0.34 | 24 | 21 | 57.7 |
| Average | 4.0 | 62.2 | ||||||
: the PDB ID of the protein.
: the rank of the true topology using our skeleton.
: the rank of the true topology using Gorgon’s skeleton.
: the time taken to extract the skeleton using our method.
: the threshold of the binary skeleton/grayscale skeleton used to extract the Gorgon’s skeleton.
: the time taken to extract the grayscale skeleton using Gorgon.
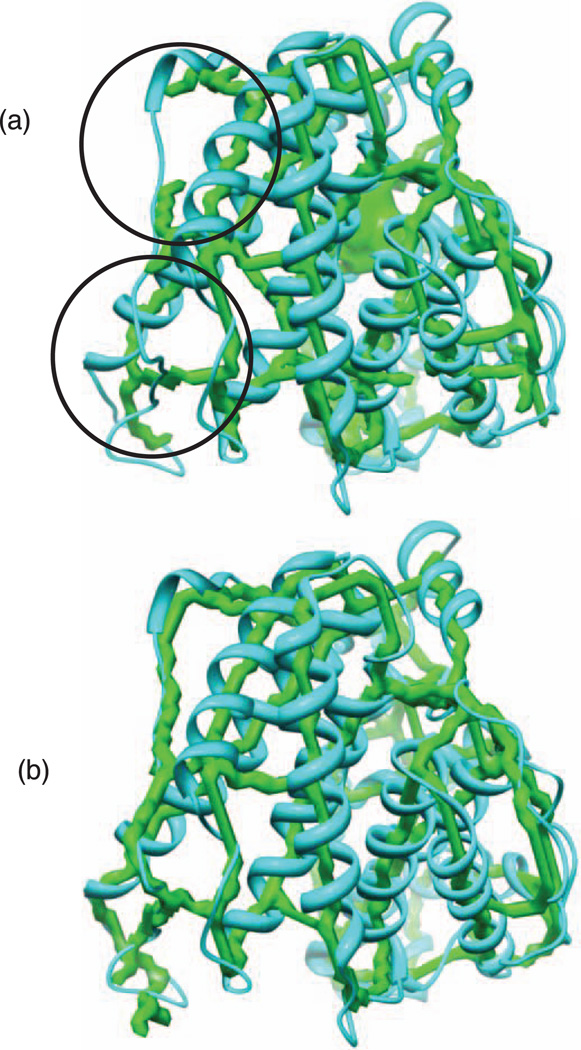
The quality of the skeleton plays a major role in the process of the prediction for both tools. However, the negative impact of the skeleton on DP-TOSS is less. The way DP-TOSS deals with the gaps and the best match process implemented in DP-TOSS makes it robust to medium quality skeletons. More details about DP-TOSS can be found in [54]. The top 35 ranked topologies are calculated for each protein using Gorgon and DP-TOSS on both skeletons. The two skeletons used for alginate lyase A1-III (PDB ID: 1QAZ) (row 11, Table 1) is shown in Fig. 7. For Gorgon’s skeleton, the binary skeleton extracted at 0.37 is used as a base skeleton to generate the gray-scale skeleton. The initial threshold used to extract the gray-scale skeleton is 0.32. The skeleton consists of misleading points and gaps (circled in Fig. 7a) as commonly seen in a typical skeleton. The skeleton extracted using our method is shown in Fig. 7b.
Fig. 7.
The skeletons extracted for alginate lyase A1-III (PDB ID: 1QAZ). (a) The skeleton extracted using Gorgon. Certain gaps (circles) in the skeleton are shown. (b) The skeleton extracted using our method.
We tested the two tools using 37 cases using two different skeletons obtained by Gorgon and the proposed method. All data used to rank the true topology in the two experiments are the same except for the skeletons. The gray-scale skeleton obtained by Gorgon performs slightly better when DP-TOSS is used (Column 7, Table 1). The difference is clear when Gorgon is used (Column 8). Gorgon is not able to find the true topology within the top 35 topologies for 16 proteins (Column 8). On the contrary, DP-TOSS is not able to find the true topology within the top 35 ranked topologies for five proteins from the test cases when a Gorgon’s skeleton is used. DP-TOSS performs better than Gorgon when Gorgon’s skeleton is used because it takes the gaps of the skeleton into consideration. DP-TOSS successfully deals with gaps of length 10 Å or less. If the gap is longer than 10 Å or there are multiple small gaps on the skeleton between the SSEs-V, DP-TOSS fails to find the true topology. For instance, DP-TOSS fails to find the true topology for 1QAZ because of two small consecutive gaps on the skeleton between the third and fourth helices (see Fig. 7a).
Table 1 shows the performance of the tools after using our method to extract the skeletons. Similar to the behavior with skeletons obtained by Gorgon, DP-TOSS performs better for new skeletons (Columns 3 and 4). Gorgon can find the true topologies of 34 out of the 37 proteins. The percentage of the true topologies that are recognized is 91.8 percent of the set when our skeletons are used. The percentage of improvement of the number of true topologies recognized correctly for the new skeletons is 62 percent (Columns 4 and 8). The percentage of improvement is calculated for the correctly recognized topologies of the proteins. Recall that N/A is considered a failure. For example, the true topology of the c-terminal of eukaryotic translation initiation factor 5 (PDB ID: 2IU1) is correctly recognized by Gorgon when our skeleton is used (Row 24, Table 1). Likewise, the performance of DP-TOSS is improved by 13 percent when the new skeletons are used (Columns 3 and 7). Recall that the improvement is not significant due to incompleteness tolerance in DP-TOSS. The rank of the true topology of 16 proteins is improved (Columns 3 and 7). For example, the rank of the true topology for 3ACW (Row 30, Table 1) is improved from the 28th (Column 7, Row 30) to the third (Column 3, Row 30) position. On the other hand, the true topology is moved backward in nine cases. The improvement of the rank may not be as important as the correct prediction of the true topology within the top 35 topologies. In de novo modeling, further evaluation will be carried out on the top 35 topologies to distinguish the native like topology.
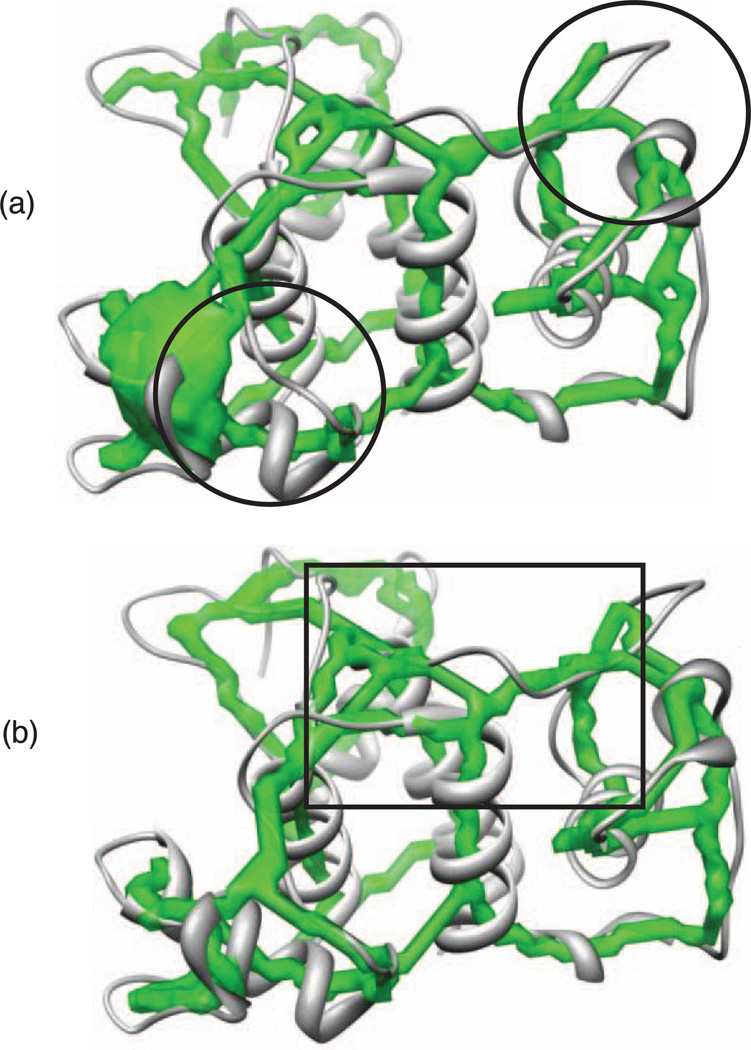
DP-TOSS and Gorgon fail to rank the true topology of the structure of surface layer homology domain from Bacillus anthracis surface array protein (PDB ID: 3PYW) (Row 36) within the top 35 topologies. The failure occurs when both skeletons are used. Investigations are carried out to find the reason. When Gorgon’s skeleton is used, some gaps (circled in Fig. 8) on the skeleton negatively impact the rank of the true topology. When the new skeleton is used, the skeleton looks fine and no gap exists. Further investigation finds that a skeleton curve is very close to an end of one of the SSEs-V. The curve branches at the end of this SSE-V. The curve is not supposed to branch at that end. The automatic detection of the end of SSEs-V on the skeleton cuts the curve in the middle. DP-TOSS, as well as Gorgon, does not consider that curve as continuous. Both methods consider the curve to end at that SSE-V. Thus, the true topology is missed. Fig. 8 shows the case. The region where the curve is close to the SSE-V is boxed.
Fig. 8.
Failure in topology determination for the structure of surface layer homology domain from Bacillus anthracis surface array protein (PDB ID: 3PYW). (a) Gorgon’s skeleton—some gaps (circled) on the skeleton negatively impact the rank of the true topology (b) SkelEM’s Skeleton—the skeleton curve is very close to an end of one of the SSEs-V (boxed). The curve branches at the end of this SSE-V.
The local peaks indicate relatively strong intensities on the map. Experimental results show that local peaks can be good tools to extract the skeleton of the density maps. Moreover, experimental results show that our method is 15 times faster than Gorgon (Columns 5 and 9, Table 1). The experiments were carried out on a lenovo ×300 laptop with 1.2-GHZ CPU speed and 2.0 GB of memory. Gorgon is able to find the surface-like and curve-like skeletons. On contrast, the proposed method extracts only curve-like skeletons. The surface-like skeleton is not important when the skeleton is used to determine the topology of the protein. However, it is important when it is used to determine the location of β-Sheet SSEs-V on the density map.
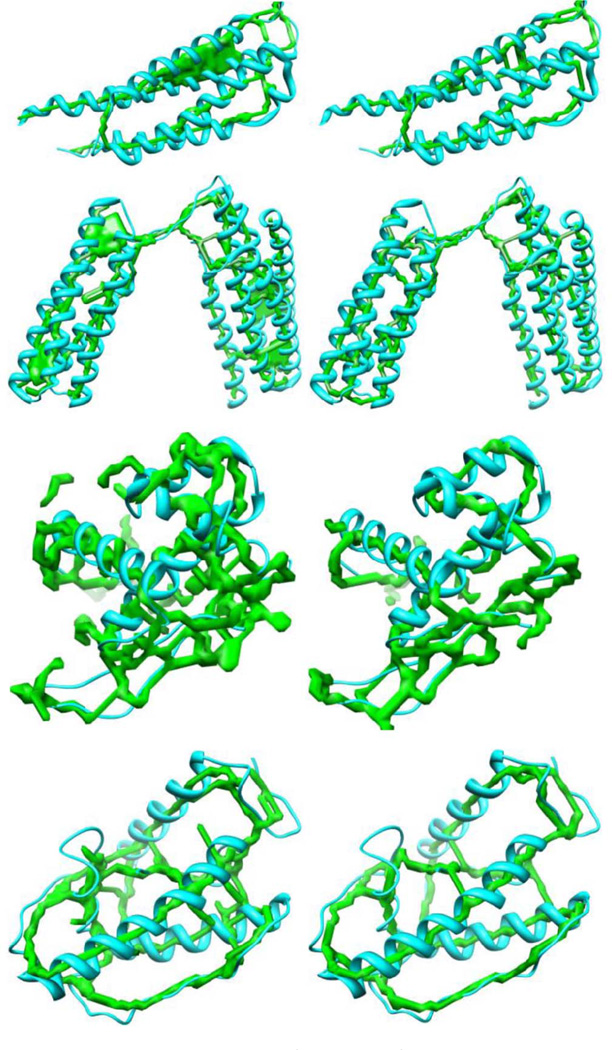
The current skeletonizers are implemented using general thinning and pruning techniques. They may be acceptable for other domains, where the quality of the descriptive skeleton is not important. In contrast, the connections between the SSEs-V are very important to the topology determination problem in de novo modeling. Thus, the quality of the skeleton becomes essential. Missing one connection may mislead the entire process. On the other hand, a vast tolerance of such errors may lead to miss the true topology in the top ranked list. Fig. 9 shows some examples of skeletons extracted using the two methods compared in this study.
Fig. 9.
The skeletons extracted for some of the density maps. The skeletons on the left are those extracted using Gorgon. The skeletons on the right are those extracted using our method. Proteins (PDB ID) from top are 1JMW, 2X0C, 3FIN, and 1ENK.
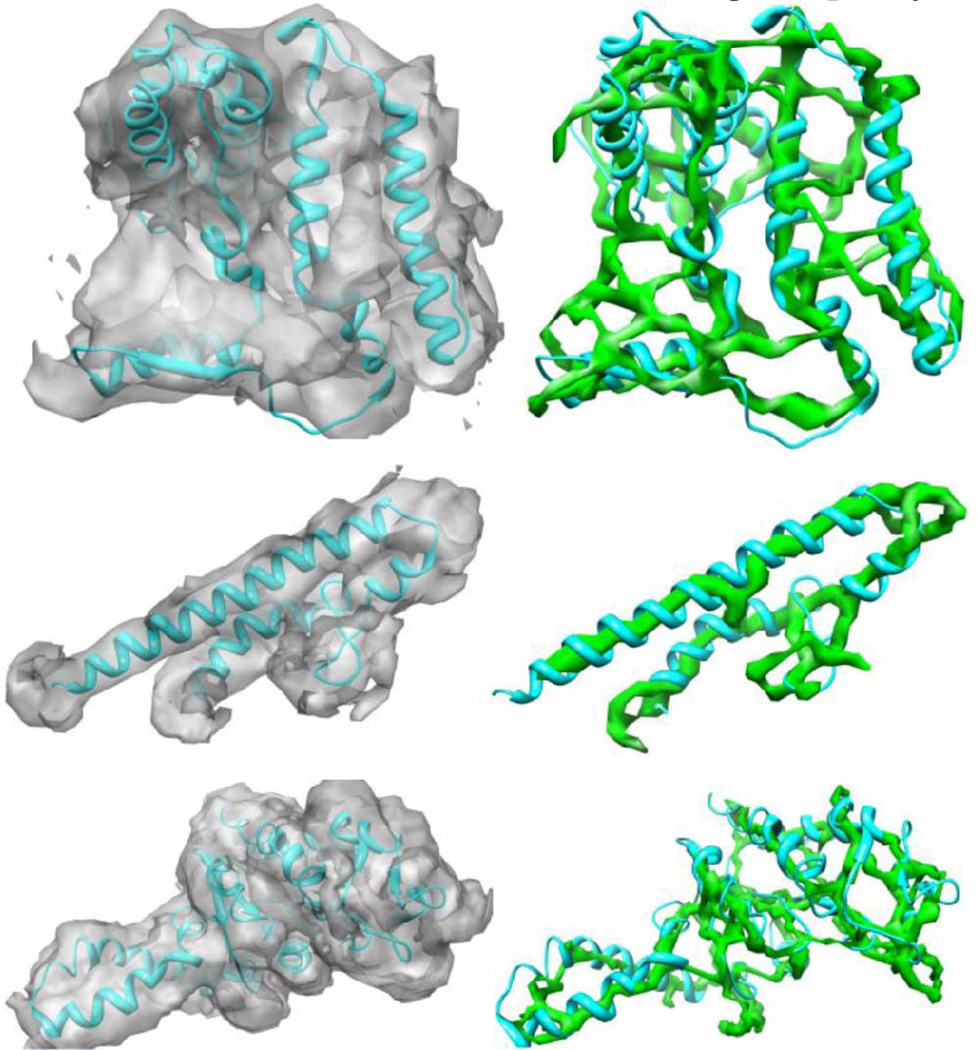
The noise in the authentic data is inevitable. Consequently, more gaps and spurs are expected. To test the ability of our method to work on a noisy data, we have evaluated it on three examples of authentic density maps for the molecules: the N-terminal of the first 222 residues of resting state of Hc Monomer (EMDB ID: 5100) [63] at 6.8-Å resolution, Model of a type III secretion system needle (EMDB ID: 5352) [64] at 7.7-Å resolution, and the E.Coli 70S Ribosome (EMDB ID: 1829) [65] at 5.6 Å. The corresponding structures are 3IXV_A, 3J0R_A, and 2WWL_B (PDB IDs), respectively. Fig. 10 shows the three extracted skeletons. Skeletons extracted minimally suffer from the problem of gaps and show the traces of the backbone of the molecules in a good quality.
Fig. 10.
The skeletons extracted for some of the authentic density maps. The skeletons extracted from the authentic density maps: 5100 (first row), 5352 (second row), and 1829 (third row). The three skeletons on the right represent the backbone of the molecules with minimum spurs.
4 Conclusion
CryoEM has become an important structure determination technique. More density maps are being produced by the CryoEM, experiments and many of them arrive at the medium resolution range. The topology of the secondary structure elements detected from the density map is a critical piece of information for deriving the atomic structures from such density maps. Several tools for de novo prediction use the skeleton of the density map to reduce the search space of the topology problem or to derive the final atomic structure of the protein. The skeleton sometimes suffers from the problem of incompleteness that misleads the process of prediction. In this paper, we presented a novel and fast segmentation-free approach to extract the gray-scale skeleton of the density maps. The approach relies on a novel representation of the density map, where the map is modeled as a graph of local peaks and a set of volume trees.
We tested the approach using 37 protein density maps. Two skeletons were extracted and used in testing: the skeleton generated by Gorgon and our skeleton. Gorgon 2.1 and DP-TOSS are used to evaluate the impact of the two skeletons on the accuracy of final ranking of the true topology for each protein. In general, the performance of the tools is better for our skeletons. The test shows that our skeletons can improve the performance of the tools used in de novo modeling. The percentages of the improvements are 62 and 13 percent for Gorgon and DP-TOSS, respectively. Therefore, the performance of the two tools proves that the quality of our skeletons is better than the quality of the skeletons extracted by Gorgon. The extracted skeleton in the proposed method is also gray scaled. The values of intensities at the skeleton are expected to be helpful in the de novo modeling. The current skeleton is curve like. In the future, we will use some image processing techniques to expand this algorithm to extract surface-like skeletons.
Acknowledgments
This work was supported by the US National Science Foundation (NSF) CAREER Award (CCF-0845888), the NSF Science & Technology Center grant (CCF-0939370), and the 2 G12 RR003048 grant from the RCMI Program, Division of Research Infrastructure, National Center for Research Resources, National Institutes of Health. Kamal Al Nasr was the corresponding author.
Biographies

Kamal Al Nasr received the bachelor’s and master’s degrees in computer science from Yarmouk University, Jordan, in 2003 and 2005, respectively. He received a second Master’s degree in computer science from New Mexico State University, Las Cruces, in 2009. He awarded the PhD degree in computer science from Old Dominion University, Norfolk, VA, in 2012. After graduation, he joined the Department of Systems and Computer Science, Howard University, Washington, DC, as a postdoctoral research scientist in 2012. He became an Assistant professor in the Department of Computer Science, Tennessee State University, Nashville, TN in 2013. His research interest is centered on developing efficient computational methods for protein structure prediction in de novo modeling. Specifically, he focuses on using electron cryomicroscopy, high-performance computing, and graph theory to design algorithms that efficiently predict the structure of proteins in three-dimensional space.
Chunmei Liu received the bachelor’s and master’s degrees in computer software from Anhui University in 1999 and 2002, respectively, and the PhD degree in computer science from the University of Georgia in 2006. She became an assistant professor in the Department of Systems and Computer Science, Howard University in the same year. Since 2010, she has been working as an associate professor in the same department. Her research interests include computational biology, graph algorithms, and theory of computation. Her recent research involves designing computationally efficient algorithms for protein identification, protein structure prediction, and protein-protein interactions. She is a member of the IEEE and ACM.

Mugizi Rwebangira received the bachelor’s degree in systems and computer science from Howard University in 2002 and the PhD degree in computer science in 2008. He has been an assistant professor at Howard University since 2010. He has received grant funding from the Army Research Lab and the US National Science Foundation, and he has published in the areas of semi-supervised learning algorithms, computational biology, and voting theory. His current research interests are in transfer learning and computational sociolinguistics.

Legand Burge received the bachelor’s degree in computer and information science from Langston University in 1992 and the PhD degree in computer science from Oklahoma State University in 1998. He has been a full professor at Howard University since 2009. His current research interests focus on the field of distributed computing. The primary thrust of his current research is in global resource management in large-scale distributed systems. In particular, he is interested in middleware technology to support scalable infrastructures for pervasive environments capable of servicing a very large number of small (possibly mobile) distributed and embedded devices efficiently. He is also interested in the application of distributed high-performance computing to solve computational science problems in biology, physics, and chemistry.

Jing He received the BS degree in applied mathematics from Jilin University, China, the MS degree in mathematics from New Mexico State University, and the PhD degree in structural and computational biology and molecular biophysics at Baylor College of Medicine. She is an associate professor in the Department of Computer Science, Old Dominion University. Her expertise is in image processing of three-dimensional images obtained from the electron cryomicroscopy technique and protein structural modeling from such data.
Contributor Information
Kamal Al Nasr, Email: kalnasr@tnstate.edu, Department of Computer Science, Tennessee State University, 3500 John Merritt Blvd, McCord Hall, Nashville, TN 37209.
Chunmei Liu, Email: chunmei@scs.howard.edu, Department of Systems and Computer Science, Howard University, 2300 Sixth Street, NW, Washington, DC 20059.
Mugizi Rwebangira, Email: rweba@scs.howard.edu, Department of Systems and Computer Science, Howard University, 2300 Sixth Street, NW, Washington, DC 20059.
Legand Burge, Email: blegand@scs.howard.edu, Department of Systems and Computer Science, Howard University, 2300 Sixth Street, NW, Washington, DC 20059.
Jing He, Email: jhe@cs.odu.edu, Department of Computer Science, Old Dominion University, Engineering & Computer Sciences Bldg., 4700 Elkhorn Ave, Suite 3300, Norfolk, VA 23529.
References
- 1.Pettersen EF, Goddard TD, Huang CC, Couch GS, Greenblatt DM, Meng EC, Ferrin TE. UCSF Chimera—A Visualization System for Exploratory Research and Analysis. J. Computational Chemistry. 2004;25(no. 13):1605–1612. doi: 10.1002/jcc.20084. [DOI] [PubMed] [Google Scholar]
- 2.Khromov D, Mestetskiy L. 3D Skeletonization as an Optimization Problem; Proc. Canadian Conf. Computational Geometry; 2012. pp. 259–264. [Google Scholar]
- 3.Dey TK, Zhao W. Approximate Medial Axis as a Voronoi Subcomplex; Proc. Seventh ACM Symp. Solid Modeling and Applications; 2002. pp. 356–366. [Google Scholar]
- 4.Foskey M, Lin MC, Manocha D. Efficient Computation of a Simplified Medial Axis. J. Computing and Information Science in Eng. 2003;3(no. 4):274–284. [Google Scholar]
- 5.Tam R, Heidrich W. Shape Simplification Based on the Medial Axis Transform. Proc. IEEE Visualization. 2003:481–488. [Google Scholar]
- 6.Tran S, Shih L. Efficient 3D Binary Image Skeletonization; Proc. IEEE Computational Systems Bioinformatics Conf. Workshops and Poster Abstracts; 2005. pp. 364–372. [DOI] [PMC free article] [PubMed] [Google Scholar]
- 7.She FH, Chen RH, Gao WM, Hodgson PH, Kong LX, Hong HY. Improved 3D Thinning Algorithms for Skeleton Extraction. Proc. Digital Image Computing: Techniques and Applications. 2009:14–18. [Google Scholar]
- 8.Dortmont M.A.M.M.v, Wetering HMMvd, Telea AC. Skeletonization and Distance Transforms of 3D Volumes Using Graphics Hardware; Proc. 13th Int’l Conf. Discrete Geometry for Computer Imagery; 2006. pp. 617–629. [Google Scholar]
- 9.Xiang B, Latecki LJ, Wen-Yu L. Skeleton Pruning by Contour Partitioning with Discrete Curve Evolution. IEEE Trans. Pattern Analysis and Machine Intelligence. 2007 Mar.29(no. 3):449–462. doi: 10.1109/TPAMI.2007.59. [DOI] [PubMed] [Google Scholar]
- 10.Xie W, Thompson RP, Perucchio R. A Topology-Preserving Parallel 3D Thinning Algorithm for Extracting the Curve Skeleton. Pattern Recognition. 2003 Jul;36(no. 7):1529–1544. [Google Scholar]
- 11.Leymarie F, Levine MD. Simulating the Grassfire Transform Using an Active Contour Model. IEEE Trans. Pattern Analysis and Machine Intelligence. 1992 Jan.14(no. 1):56–75. [Google Scholar]
- 12.Palagyi K, Kuba A. Directional 3D Thinning Using 8 Subiterations; Proc. Eighth Int’l Conf. Discrete Geometry for Computer Imagery; 1999. pp. 325–336. [Google Scholar]
- 13.Ju T, Baker ML, Chiu W. Computing a Family of Skeletons of Volumetric Models for Shape Description. Computer-Aided Design. 2007 May;39(no. 5):352–360. doi: 10.1016/j.cad.2007.02.006. [DOI] [PMC free article] [PubMed] [Google Scholar]
- 14.Mayya N, Rajan VT. Voronoi Diagrams of Polygons: A Framework for Shape Representation. J. Math. Imaging and Vision. 1996 Dec.6(no. 4):355–378. [Google Scholar]
- 15.Brandt JW, Algazi VR. Continuous Skeleton Computation by Voronoi Diagram. CVGIP: Image Understanding. 1992 May;55(no. 3):329–338. [Google Scholar]
- 16.Dey TK, Zhao W. Approximate Medial Axis as a Voronoi Subcomplex. Computer-Aided Design. 2004 Feb.36(no. 2):195–202. [Google Scholar]
- 17.Choi W-P, Lam K-M, Siu W-C. Extraction of the Euclidean Skeleton Based on a Connectivity Criterion. Pattern Recognition. 2003 Mar.36(no. 3):721–729. [Google Scholar]
- 18.Golland P, Eric W, Grimson L. Fixed Topology Skeletons. Proc. IEEE Conf. Computer Vision and Pattern Recognition. 2000;1:10–17. [Google Scholar]
- 19.Yaorong G, Fitzpatrick JM. On the Generation of Skeletons from Discrete Euclidean Distance Maps. IEEE Trans. Pattern Analysis and Machine Intelligence. 1996 Nov.18(no. 11):1055–1066. [Google Scholar]
- 20.Borgefors G. Distance Transformations in Digital Images. Computer Vision, Graphics, and Image Processing. 1986 Jun;34(no. 3):344–371. [Google Scholar]
- 21.Dimitrov P, Damon JN, Siddiqi K. Flux Invariants for Shape; Proc. IEEE CS Conf. Computer Vision and Pattern Recognition; 2003. pp. I-835–I-841. [Google Scholar]
- 22.Siddiqi K, Bouix S, Tannenbaum A, Zucker SW. Hamilton- Jacobi Skeletons. Int’l J. Computer Vision. 2002;48(no. 3):215–231. [Google Scholar]
- 23.Palágyi K, Balogh E, Kuba A, Halmai C, Erdőhelyi B, Sorantin E, Hausegger K. A Sequential 3D Thinning Algorithm and Its Medical Applications; Proc. 17th Int’l Conf. Information Processing in Medical Imaging; 2001. pp. 409–415. [Google Scholar]
- 24.Svensson S, Nystrom I, Arcelli C, Sanniti di Baja G. Using Grey-Level and Distance Information for Medial Surface Representation of Volume Images. Proc. 16th Int’l Conf. Pattern Recognition. 2002;2:324–327. [Google Scholar]
- 25.Abeysinghe SS, Baker M, Wah C, Tao J. Segmentation-Free Skeletonization of Grayscale Volumes for Shape Understanding; Proc. IEEE Int’l Conf. Shape Modeling and Applications; 2008. pp. 63–71. [Google Scholar]
- 26.Antunez E, Guibas L. Robust Extraction of 1D Skeletons from Grayscale 3D Images; Proc. 19th Int’l Conf. Pattern Recognition; 2008. pp. 1–4. [Google Scholar]
- 27.Couprie M, Bezerra F, Bertrand G. Topological Operators for Grayscale Image Processing. J. Electronic Imaging. 2001;10(no. 4):1003–1015. [Google Scholar]
- 28.Dokládal P, Lohou C, Perroton L, Bertrand G. A New Thinning Algorithm and Its Application to Extraction of Blood Vessels; Proc. First Conf. on Modelling and Simulation in Biology, Medicine and Biomedical Engineering (BioMedSim ’99); 2009. pp. 32–37. [Google Scholar]
- 29.Song Z, Demiralp C, Laidlaw DH. Visualizing Diffusion Tensor MR Images Using Streamtubes and Streamsurfaces. IEEE Trans. Visualization and Computer Graphics. 2003 Oct-Dec;9(no. 4):454–462. [Google Scholar]
- 30.Zeyun Y, Bajaj C. A Structure Tensor Approach for 3D Image Skeletonization: Applications in Protein Secondary Structure Analysis; Proc. IEEE Int’l Conf. Image Processing; 2006. pp. 2513–2516. [Google Scholar]
- 31.Al Nasr K, Chen L, Si D, Ranjan D, Zubair M, He J. Building the Initial Chain of the Proteins through De Novo Modeling of the Cryo-Electron Microscopy Volume Data at the Medium Resolutions; Proc. ACM Conf. Bioinformatics Computational Biology and Biomedicine; 2012. pp. 490–497. [Google Scholar]
- 32.Al Nasr K, Ranjan D, Zubair M, He J. Ranking Valid Topologies of the Secondary Structure Elements Using a Constraint Graph. J. Bioinformatics and Computational Biology. 2011;9(no. 3):415–430. doi: 10.1142/s0219720011005604. [DOI] [PubMed] [Google Scholar]
- 33.Al Nasr K, Sun W, He J. Structure Prediction for the Helical Skeletons Detected from the Low Resolution Protein Density Map. BMC Bioinformatics. 2010 Jan.11(no.) Suppl. 1 doi: 10.1186/1471-2105-11-S1-S44. article S44. [DOI] [PMC free article] [PubMed] [Google Scholar]
- 34.Baker ML, Abeysinghe SS, Schuh S, Coleman RA, Abrams A, Marsh MP, Hryc CF, Ruths T, Chiu W, Ju T. Modeling Protein Structure at Near Atomic Resolutions with Gorgon. J. Structural Biology. 2011;174(no. 2):360–373. doi: 10.1016/j.jsb.2011.01.015. [DOI] [PMC free article] [PubMed] [Google Scholar]
- 35.Chiu W, Schmid MF. Pushing Back the Limits of Electron Cryomicroscopy. Nature Structural Biology. 1997;4:331–333. doi: 10.1038/nsb0597-331. [DOI] [PubMed] [Google Scholar]
- 36.Zhou ZH, Dougherty M, Jakana J, He J, Rixon FJ, Chiu W. Seeing the Herpesvirus Capsid at 8.5 A. Science. 2000 May;288(no. 5467):877–880. doi: 10.1126/science.288.5467.877. [DOI] [PubMed] [Google Scholar]
- 37.Chen DH, Ludtke SJ, Song JL, Chuang DT, Chiu W. Seeing GroEL at 6 A Resolution by Single Particle Electron Cryomicroscopy. Structure. 2004 Jul;12(no. 7):1129–1136. doi: 10.1016/j.str.2004.05.006. [DOI] [PubMed] [Google Scholar]
- 38.Chiu W, Baker ML, Jiang W, Zhou ZH. Deriving Folds of Macromolecular Complexes through Electron Cryomicroscopy and Bioinformatics Approaches. Current Opinion in Structural Biology. 2002 Apr.12(no. 2):263–269. doi: 10.1016/s0959-440x(02)00319-6. [DOI] [PubMed] [Google Scholar]
- 39.Zhang X, Jin L, Fang Q, Hui WH, Zhou ZH. 3.3 Å Cryo-EM Structure of a Nonenveloped Virus Reveals a Priming Mechanism for Cell Entry. Cell. 2010 Apr.141(no. 3):472–482. doi: 10.1016/j.cell.2010.03.041. [DOI] [PMC free article] [PubMed] [Google Scholar]
- 40.Cheng L, Sun J, Zhang K, Mou Z, Huang X, Ji G, Sun F, Zhang J, Zhu P. Atomic Model of a Cypovirus Built from Cryo-EM Structure Provides Insight into the Mechanism of mRNA Capping. Proc. Nat’l Academy of Sciences USA. 2011 Jan.108(no. 4):1373–1378. doi: 10.1073/pnas.1014995108. [DOI] [PMC free article] [PubMed] [Google Scholar]
- 41.Maki-Yonekura S, Yonekura K, Namba K. Conformational Change of Flagellin for Polymorphic Supercoiling of the Flagellar Filament. Nature Structural & Molecular Biology. 2010 Apr.17(no. 4):417–422. doi: 10.1038/nsmb.1774. [DOI] [PubMed] [Google Scholar]
- 42.Yu X, Ge P, Jiang J, Atanasov I, Zhou ZH. Atomic Model of CPV Reveals the Mechanism Used by This Single-Shelled Virus to Economically Carry Out Functions Conserved in Multishelled Reoviruses. Structure. 2011;19(no. 5):652–661. doi: 10.1016/j.str.2011.03.003. [DOI] [PMC free article] [PubMed] [Google Scholar]
- 43.Böttcher B, Wynne SA, Crowther RA. Determination of the Fold of the Core Protein of Hepatitis B Virus by Electron Cryomicroscopy. Nature. 1997;386(no. 6620):88–91. doi: 10.1038/386088a0. [DOI] [PubMed] [Google Scholar]
- 44.Conway JF, Cheng N, Zlotnick A, Wingfield PT, Stahl SJ, Steven AC. Visualization of a 4-Helix Bundle in the Hepatitis B Virus Capsid by Cryo-Electron Microscopy. Nature. 1997;386(no. 6620):91–94. doi: 10.1038/386091a0. [DOI] [PubMed] [Google Scholar]
- 45.Baker ML, Jiang W, Wedemeyer WJ, Rixon FJ, Baker D, Chiu W. Ab Initio Modeling of the Herpesvirus VP26 Core Domain Assessed by CryoEM Density. PLoS Computational Biology. 2006 Oct.2(no. 10) doi: 10.1371/journal.pcbi.0020146. article e146. [DOI] [PMC free article] [PubMed] [Google Scholar]
- 46.Martin AG, Depoix F, Stohr M, Meissner U, Hagner-Holler S, Hammouti K, Burmester T, Heyd J, Wriggers W, Markl J. Limulus Polyphemus Hemocyanin: 10 A Cryo-EM Structure, Sequence Analysis, Molecular Modelling and Rigid-Body Fitting Reveal the Interfaces between the Eight Hexamers. J. Molecular Biology. 2007 Mar.366(no. 4):1332–1350. doi: 10.1016/j.jmb.2006.11.075. [DOI] [PubMed] [Google Scholar]
- 47.Villa E, Sengupta J, Trabuco LG, LeBarron J, Baxter WT, Shaikh TR, Grassucci RA, Nissen P, Ehrenberg M, Schulten K, Frank J. Ribosome-Induced Changes in Elongation Factor Tu Conformation Control GTP Hydrolysis. Proc. Nat’l Academy of Sciences USA. 2009 Jan.106(no. 4):1063–1068. doi: 10.1073/pnas.0811370106. [DOI] [PMC free article] [PubMed] [Google Scholar]
- 48.Lawson CL, Baker ML, Best C, Bi C, Dougherty M, Feng P, van Ginkel G, Devkota B, Lagerstedt I, Ludtke SJ, Newman RH, Oldfield TJ, Rees I, Sahni G, Sala R, Velankar S, Warren J, Westbrook JD, Henrick K, Kleywegt GJ, Berman HM, Chiu W. EMDataBank.org: Unified Data Resource for CryoEM. Nucleic Acids Research. 2011 Jan.39(no.) suppl. 1:D456–D464. doi: 10.1093/nar/gkq880. [DOI] [PMC free article] [PubMed] [Google Scholar]
- 49.Si D, Ji S, Al Nasr K, He J. A Machine Learning Approach for the Identification of Protein Secondary Structure Elements from Cryoem Density Maps. Biopolymers. 2012;97:698–708. doi: 10.1002/bip.22063. [DOI] [PubMed] [Google Scholar]
- 50.Lasker K, Dror O, Shatsky M, Nussinov R, Wolfson HJ. EMatch: Discovery of High Resolution Structural Homologues of Protein Domains in Intermediate Resolution Cryo-EM Maps. IEEE/ACM Trans. Computational Biology and Bioinformatics. 2007 Jan.4(no. 1):28–39. doi: 10.1109/TCBB.2007.1003. [DOI] [PubMed] [Google Scholar]
- 51.Del Palu A, He J, Pontelli E, Lu Y. Identification of Alpha- Helices from Low Resolution Protein Density Maps; Proc. Computational Systems Bioinformatics Conf. (CSB ’06); 2006. pp. 89–98. [PubMed] [Google Scholar]
- 52.Pollastri G, McLysaght A. Porter: A New, Accurate Server for Protein Secondary Structure Prediction. Bioinformatics. 2005 Apr.21(no. 8):1719–1720. doi: 10.1093/bioinformatics/bti203. [DOI] [PubMed] [Google Scholar]
- 53.Jones DT. Protein Secondary Structure Prediction Based on Position-Specific Scoring Matrices. J. Molecular Biology. 1999 Sept.292(no. 2):195–202. doi: 10.1006/jmbi.1999.3091. [DOI] [PubMed] [Google Scholar]
- 54.Al Nasr K. Dissertation, Dept. of Computer Science. Old Dominion Univ.; 2012. De Novo Protein Structure Modeling from Cryoem Data through a Dynamic Programming Algorithm in the Secondary Structure Topology Graph. [Google Scholar]
- 55.Lindert S, Alexander N, Wötzel N, Karaka M, Stewart PL, Meiler J. EM-Fold: De Novo Atomic-Detail Protein Structure Determination from Medium-Resolution Density Maps. Structure. 2012;20(no. 3):464–478. doi: 10.1016/j.str.2012.01.023. [DOI] [PMC free article] [PubMed] [Google Scholar]
- 56.Lindert S, Staritzbichler R, Wötzel N, Karakaş M, Stewart PL, Meiler J. EM-Fold: De Novo Folding of α-Helical Proteins Guided by Intermediate-Resolution Electron Microscopy Density Maps. Structure. 2009 Jul;17(no. 7):990–1003. doi: 10.1016/j.str.2009.06.001. [DOI] [PMC free article] [PubMed] [Google Scholar]
- 57.He J, Lu Y, Pontelli E. A Parallel Algorithm for Helix Mapping between 3D and 1D Protein Structure Using the Length Constraints; Proc. Second Int’l Conf. Parallel and Distributed Processing and Applications; 2004. pp. 746–756. [Google Scholar]
- 58.Dal Palu A, Pontelli E, He J, Lu Y. A Constraint Logic Programming Approach to 3D Structure Determination of Large Protein Complexes; Proc. ACM Symp. Applied Computing; 2006. pp. 131–136. [Google Scholar]
- 59.Wu Y, Chen M, Lu M, Wang Q, Ma J. Determining Protein Topology from Skeletons of Secondary Structures. J. Molecular Biology. 2005 Jul;350(no. 3):571–586. doi: 10.1016/j.jmb.2005.04.064. [DOI] [PubMed] [Google Scholar]
- 60.Abeysinghe SS, Ju T. Interactive Skeletonization of Intensity Volumes. Visual Computer. 2009;25(nos. 5–7):627–635. [Google Scholar]
- 61.Kong Y, Zhang X, Baker TS, Ma J. A Structural- Informatics Approach for Tracing Beta-Sheets: Building Pseudo-C(Alpha) Traces for Beta-Strands in Intermediate-Resolution Density Maps. J. Molecular Biology. 2004 May;339(no. 1):117–130. doi: 10.1016/j.jmb.2004.03.038. [DOI] [PMC free article] [PubMed] [Google Scholar]
- 62.Dijkstra EW. A Note on Two Problems in Connexion with Graphs. Numerische Mathematik. 1959;1(no. 1):269–271. [Google Scholar]
- 63.Cong Y, Zhang Q, Woolford D, Schweikardt T, Khant H, Dougherty M, Ludtke SJ, Chiu W, Decker H. Structural Mechanism of SDS-Induced Enzyme Activity of Scorpion Hemocyanin Revealed by Electron Cryomicroscopy. Structure. 2009;17(no. 5):749–758. doi: 10.1016/j.str.2009.03.005. [DOI] [PMC free article] [PubMed] [Google Scholar]
- 64.Fujii T, Cheung M, Blanco A, Kato T, Blocker AJ, Namba K. Structure of a Type III Secretion Needle at 7-Å Resolution Provides Insights into Its Assembly and Signaling Mechanisms. Proc. Nat’l Academy of Sciences USA. 2012 Mar.109(no. 12):4461–4466. doi: 10.1073/pnas.1116126109. [DOI] [PMC free article] [PubMed] [Google Scholar]
- 65.Bhushan S, Hoffmann T, Seidelt B, Frauenfeld J, Mielke T, Berninghausen O, Wilson DN, Beckmann R. SecM-Stalled Ribosomes Adopt an Altered Geometry at the Peptidyl Transferase Center. PLoS Biology. 2011;9(no. 1) doi: 10.1371/journal.pbio.1000581. article e1000581. [DOI] [PMC free article] [PubMed] [Google Scholar]


