

Abstract
Purpose
To prospectively determine the reproducibility of quantitative magnetic resonance (MR) imaging biomarkers of the morphology and composition (spin lattice relaxation time in rotating frame [T1-ρ], T2) of knee cartilage in a multicenter multivendor trial involving patients with osteoarthritis (OA) and asymptomatic control subjects.
Materials and Methods
This study was HIPAA compliant and approved by the institutional review committees of the participating sites, with written informed consent obtained from all participants. Fifty subjects from five sites who were deemed to have normal knee joints (n = 18), mild OA (n = 16), or moderate OA (n = 16) on the basis of Kellgren-Lawrence scores were enrolled. Each participant underwent four sequential 3-T knee MR imaging examinations with use of the same imager and with 2–63 days (median, 18 days) separating the first and last examinations. Water-excited three-dimensional T1-weighted gradient-echo imaging, T1-ρ imaging, and T2 mapping of cartilage in the axial and coronal planes were performed. Biomarker reproducibility was determined by using intraclass correlation coefficients (ICCs) and root-mean-square coefficients of variation (RMS CVs, expressed as percentages).
Results
Morphometric biomarkers had high reproducibility, with ICCs of 0.989 or greater and RMS CVs lower than 4%. The largest differences between the healthy subjects and the patients with radiographically detected knee OA were those in T1-ρ values, but precision errors were relatively large. Reproducibility of T1-ρ values was higher in the thicker patellar cartilage (ICC range, 0.86–0.93; RMS CV range, 14%–18%) than in the femorotibial joints (ICC range, 0.20–0.84; RMS CV range, 7%–19%). Good to high reproducibility of T2 was observed, with ICCs ranging from 0.61 to 0.98 and RMS CVs ranging from 4% to 14%.
Conclusion
MR imaging measurements of cartilage morphology, T2, and patellar T1-ρ demonstrated moderate to excellent reproducibility in a clinical trial network.
© RSNA, 2011
Introduction
In osteoarthritis (OA) research, several quantitative magnetic resonance (MR) imaging measures have been proposed as imaging biomarkers of articular cartilage change (1). These potential biomarkers include quantitative cartilage morphometric and compositional parameters based on the changes in MR imaging relaxation times that occur with degradation of the extracellular matrix. Because these biomarkers enable noninvasive assessment of an important indicator of joint health, they are frequently used in natural history studies of OA, such as the National Institutes of Health–funded Osteoarthritis Initiative (2,3), and in clinical trials to evaluate responses to treatment with disease-modifying OA drugs (4,5). Frequently reported morphometric measures of cartilage include volume, thickness, and surface area (6,7).
The tissue changes measured with morphometry are preceded by biochemical and structural changes that alter the MR imaging relaxation times of cartilage water (8,9). The spin lattice relaxation time in the rotating frame (T1-ρ) has been shown to be sensitive to cartilage proteoglycan content (10). The spin-spin relaxation time (T2) is sensitive to the water content and the concentration and anisotropic organization of type II collagen in cartilage (11). Use of these relaxometry parameters facilitates the potential to detect early cartilage damage—either to identify subjects at risk for OA or to monitor the response to treatment at a stage when cartilage preservation is potentially more effective (8).
Reproducibility is an essential property of any biomarker (12). Accurate measures of precision error are necessary for planning clinical trials and developing methods to improve reliability (13). With regard to measures of cartilage morphology, precision errors have been studied primarily at single sites with 1.5-T MR imaging in a test-retest protocol (14). More recently, the precision of 3.0-T cartilage morphometry has been reported in a multicenter clinical trial (5). In contrast, the reliability of cartilage T1-ρ and T2 measurements has been limited to single-vendor studies and the assessment of patellar cartilage (15–17). Given the variability in the implementation of these techniques among different vendors and across different clinical sites, single-site measurements of reproducibility may yield overestimations of the reliability of these biomarkers in a multivendor multicenter clinical trial. Furthermore, inherent regional and zonal variations in the composition and structure of the extracellular cartilage matrix cause regional differences in T1-ρ and T2 within the joint and with respect to the depth from the articular surface (18–20). This zonal variation is greater for cartilage T2 than for T1-ρ, primarily because of the lower sensitivity of T1-ρ to the orientation of the anisotropic type II collagen matrix (20). Because of this variability, it is common to measure compositional biomarkers as functions of the depth from the articular surface (7,11). The use of smaller regions of analysis may also contribute to the lower reproducibility. Thus, in addition to regional assessment within the knee, evaluation of the reproducibility of T1-ρ and T2 measurements as functions of the depth from the articular surface should be performed. The purpose of this study was to prospectively determine the reproducibility of quantitative MR imaging biomarkers of knee cartilage composition (T1-ρ, T2) and morphology in a multicenter multivendor trial involving patients with OA and asymptomatic control subjects.
Materials and Methods
Study Participants
The protocol for this prospective cross-sectional study, sponsored by the Pennsylvania arm of the American College of Radiology Imaging Network (ACRIN) for the ACRIN-PA 4001 trial, was reviewed, and the study was approved by the ACRIN institutional review committees and the local participating sites and conducted in compliance with the Health Insurance Portability and Accountability Act. All subjects were recruited from the community by way of the print media and provided written informed consent for participation in the study. Inclusion criteria included age older than 18 years, a Kellgren-Lawrence (KL) score of 0–3, no change in treatment for OA within the past 6 months, and no plans to change to a different treatment within the next 3 months. Exclusion criteria included any contraindication to MR imaging, prior knee surgery or trauma, and a KL score of 4. At the initial visit, the subjects completed the knee osteoarthritis outcome score questionnaire (KOOS LK1.0), and bilateral knee, fixed-flexion radiographs were obtained if they had not been acquired within 60 days of enrollment in the study. The participants were assigned to one of three cohorts—the normal knee joint (KL score, 0), minimal OA (KL score, 1–2), or moderate OA (KL score, 3) group—on the basis of their KL score. To minimize the likelihood of including individuals with preradiographic cartilage damage, the normal knee joint cohort was limited to participants aged 18–35 years.
Fifty-three participants were recruited from five clinical sites between November 1, 2006, and March 20, 2008. Three of these subjects withdrew from the study before completing the protocol (Fig 1): One subject was unable to tolerate the MR imaging examination owing to a preexisting back condition, one subject’s leg was too large for the phased-array knee coil, and a third subject withdrew from the study owing to scheduling conflicts.
Figure 1:

ACRIN-PA 4001 flowchart: Only those subjects in whom four complete artifact-free protocol-compliant data sets were obtained were included in ICC determinations. Causes of data set exclusion were as follows: For morphometric measurements, 11 cases in the patella were excluded owing to incomplete data sets (†) (n = 3), wrong parameters (n = 2), and incomplete coverage (n = 6); and 12 cases in the femorotibial joint were excluded owing to incomplete data sets (n = 3), wrong parameters (n = 2), and incomplete coverage (n = 7). For T1-ρ measurements, in the patella 12 cases were excluded owing to parameter programming error at one site and three cases were excluded owing to artifact, two cases in the femorotibial joint were excluded owing to artifact, and one case in the lateral tibia was excluded owing to local susceptibility artifact. For T2 measurements, one case in the patella was excluded owing to a missing data point, six cases in the lateral compartment were excluded owing to missing data points (n = 2) and artifact (n = 4), and five cases in the medial compartment were excluded owing to missing data points (n = 2) and artifact (n = 3). cLF = central lateral femoral condyle, cMF = central (weight-bearing) medial femoral condyle, KOOS = knee osteoarthritis outcome score, LT = lateral tibia, MT = medial tibia, P = patella.
Demographic data on the subjects are presented in Table 1. There were 18 participants in the normal knee joint cohort, 16 in the mild OA cohort, and 16 in the moderate OA cohort. To minimize the likelihood of including individuals with preradiographic knee OA, participants in the healthy cohort were younger (median age, 27 years; age range, 22–34 years). Compared with the subjects who had mild radiographically detected knee OA, the moderate OA cohort included a greater percentage of women (75% of subjects in moderate OA group, 44% of subjects in mild OA group) and was more symptomatic, with lower mean values for all knee osteoarthritis outcome score questionnaire subscores.
Table 1.
Comparisons of Subject Demographic Data and Symptoms
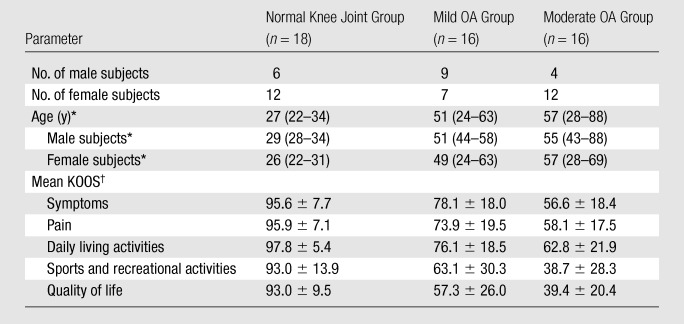
Median ages, with age range in parentheses.
Data are mean knee osteoarthritis outcome scores (KOOS) ± standard deviations.
As shown in the study protocol schema (Fig 1), each subject underwent four sequential MR imaging examinations of the target knee, with 2–63 days (median, 18 days) separating the first and last examinations. For the mild OA and moderate OA cohorts, the target knee was chosen on the basis of the Kellgren-Lawrence score used for cohort assignment, whereas the target knee was randomly selected for the healthy cohort.
MR Imaging Technique
Subjects were positioned supine in the magnet bore with use of an MR imaging–compatible device to stabilize the patient’s feet and reproducibly align the target knee in the MR imaging coil. This device was fixed to the patient’s bed and enabled adjustment of the knee position in three orthogonal planes as well as in an axial rotation. Knee flexion was adjusted to 5°–10° and maintained throughout the study by placing a pad under the knee. No attempts were made to control for activity level or joint loading before the MR imaging examinations.
The MR images were obtained by using 3-T instrumentation with phased-array coil technology. At three of the five sites, 3-T Magnetom Trio magnets (Siemens, Erlangen, Germany) were used, and at two sites, 3-T Achieva magnets (Philips Healthcare, Best, the Netherlands) were used. A phased-array knee coil with a minimum of four elements was used at all of the sites. Cartilage morphometric, T1-ρ, and T2 mapping source images were obtained in the axial plane for assessment of patellar cartilage and in the coronal plane for assessment of femorotibial joint cartilage. The acquisition parameters used are listed in Table 2. Cartilage morphometry was performed with use of axial and coronal images that were obtained by using a water-excited three-dimensional T1-weighted spoiled gradient-echo sequence. T1-ρ measurements were obtained by using a previously validated fat-suppressed three-dimensional T1-ρ–prepared balanced gradient-echo technique (21). T1-ρ magnetization was prepared by using a three-pulse cluster consisting of two 90° hard pulses and a low-power spin-lock pulse with a radiofrequency magnetic induction field of 500 Hz and was imaged with coronal and axial three-dimensional balanced fast field-echo sequences. Cartilage T2 was measured by using two-dimensional multisection multiecho sequences.
Table 2.
MR Imaging Parameters
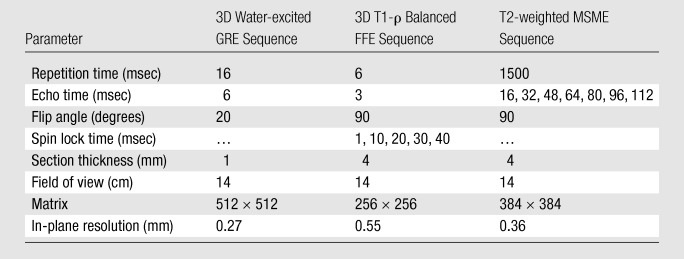
Note.—FFE = fast field-echo, GRE = gradient-echo, MSME = multisection multiecho, 3D = three-dimensional.
Six quality control phantoms were constructed, calibrated, and distributed across the five sites in the trial network. The phantom contained two internal reservoirs of gadolinium-doped water with different relation parameters and geometric features. Monthly imaging examinations were performed at each site and after major hardware or software upgrades, and the resultant images were sent to the ACRIN for quality control.
Image Analysis
Data from the MR imaging examinations were analyzed as a set for direct comparison of the regions of interest (ROIs) based on the visualization of local anatomic features. Cartilage morphometric analysis was performed by Chondrometrics (Ainring, Germany) personnel by using customized software, as previously described (22,23). After quality control review of the data sets, manual segmentation of the patella and femorotibial cartilage plates was performed by technicians with prior training and experience in cartilage segmentation. Segmentation involved manual segmentation of the cartilaginous joint surface area of five sites in the knee: the patella, medial tibia, lateral tibia, central (weight-bearing) medial femoral condyle, and central lateral femoral condyle. The segmented regions were used to calculate the area of the cartilage surface (in square centimeters), the cartilage volume (in cubic millimeters), and the mean cartilage thickness over the area of the subchondral bone (in millimeters) (7).
To account for zonal variation as a function of depth from the articular surface, the reproducibility of T1-ρ and T2 was described as a deep, middle, or superficial zone for each of the five sites in the joint. Reproducibility was also estimated by using a pooled ROI in which the depth-dependent zones were collapsed into a single ROI that encompassed the full thickness of the cartilage.
T1-ρ source images were analyzed at the University of Pennsylvania by using proprietary image analysis software (24). At the time of analysis, it was discovered that the 1-msec spin lock time for the axial T1-ρ source images was programmed with the wrong spin lock time duration at one site. As a result, the patellar T1-ρ values from the 12 subjects examined at this site were excluded from the study. The image data were processed offline at an SGI workstation (Silicon Graphics International, Freemont, Calif) with custom-built routines written in Matlab (Mathworks, Natick, Mass) script. A series of T1-ρ–weighted images were used to calculate T1-ρ maps by fitting every voxel to an appropriate signal expression to calculate the T1-ρ by using the linear least-squares method, as described previously (24). Cartilage ROIs were selected by using a semiautomated segmentation algorithm. Zonal ROIs were then automatically generated on the basis of the depth from the articular surface by using an automated subroutine in which the superficial layer was eroded by using an iterative process to determine the cartilage thickness in each region and partitioning the thickness into three equal ROIs.
Cartilage T2 mapping analysis was performed at Penn State University and ACRIN headquarters by using proprietary software written in Interactive Data Language (ITT Visual Information Solutions, Boulder, Colo) (25). The T2 analysis was performed by two technicians who underwent training with a computer-based tutorial. The reproducibility of cartilage T2 measurements was limited to that in an ROI on one section through the central uncovered cartilage of the femorotibial joint (Fig 2). Because less regional variation is observed in patellar cartilage, T2 analysis of this site involved the use of a larger ROI that included the medial and lateral patellar facets of the axial image obtained through the center of the patella (16).
Figure 2a:

Representative ROIs for (a) lateral and (b) medial compartments of femorotibial joint used in analysis of cartilage T2. ROI was limited to center section of coronal multisection multiecho source images. Orange indicates tibial ROIs, and blue indicates femoral ROIs. cLF = central lateral femoral condyle, cMF = central (weight-bearing) medial femoral condyle, LT = lateral tibia, MT = medial tibia.
Figure 2b:

Representative ROIs for (a) lateral and (b) medial compartments of femorotibial joint used in analysis of cartilage T2. ROI was limited to center section of coronal multisection multiecho source images. Orange indicates tibial ROIs, and blue indicates femoral ROIs. cLF = central lateral femoral condyle, cMF = central (weight-bearing) medial femoral condyle, LT = lateral tibia, MT = medial tibia.
Cartilage T2 maps were calculated, on a voxel-by-voxel basis, from seven multisection multiecho images by means of linear least-squares curve fitting. The first of the seven echoes was excluded from the fit to reduce error that results from the signal produced by stimulated echoes (26). The cartilage ROI was segmented from the multisection multiecho source images by using a semiautomated technique. After the segmentation, the software determined the center of each voxel in the ROI as a function of the normalized distance from the bone cartilage interface. The T2 values with a normalized distance of 0–0.33 were pooled to determine the T2 of the deep cartilage zone, values with a normalized distance of 0.34–0.65 were pooled to determine the T2 of the middle zone, and values with a normalized distance of 0.66–1.00 formed the superficial zone.
Statistical Analysis
MR imaging–derived cartilage biomarkers were compared between the subject cohorts by using a linear mixed model that included all three cohorts and proper contrasts to avoid the problems associated with multiple comparisons. The reproducibility of the biomarkers was assessed by using intraclass correlation coefficients (ICCs) derived from the variance estimates of a one-way repeated-measures analysis of variance model, with session as the class term, and by pooling the data of all participants in each cohort from all sites (27). The 95% confidence interval was calculated as the exact confidence interval based on the F distribution (28). Only compliant data sets from participants who completed all four MR imaging examinations were included in the ICC analysis (Fig 1). In addition, the root-mean-square coefficient of variation (RMS CV, expressed as a percentage) was determined from all available data according to the method of Glüer et al (29), with which the coefficient of variation for each subject with repeated measurements is the ratio of the standard deviation to the mean and is expressed as a percentage. With use of a previously described scale (30), the reproducibility of the cartilage biomarkers was subjectively rated as poor (ICC ≤ 0.69), fair (ICC, 0.70–0.79), good (ICC, 0.80–0.89), or high (ICC ≥ 0.90) according to the estimated ICC.
Results
Comparison of MR Imaging Biomarkers between Cohorts
To assess face validity, the MR imaging biomarkers were compared between the cohorts (Table 3). The greatest difference in cartilage morphology measurements was observed between the mild OA and moderate OA cohorts, in which differences in cartilage volume and cartilage thickness were significant in all regions of the knee. Compared with the younger, normal knee joint cohort, the mild OA cohort had greater articular surface area, cartilage thickness, and volume values (P < .05 for four of nine comparisons) and the moderate OA cohort had smaller values (P < .05 for seven of nine comparisons). The T1-ρ measured in the moderate OA cohort was significantly longer than that measured in the normal knee joint and mild OA cohorts at all sites. The difference in cartilage T2 between cohorts varied according to location in the joint, with significant differences between the moderate OA cohort and both the normal knee joint and mild OA cohorts in the patella and femur, but not in the tibia.
Table 3.
Comparisons of Cartilage Biomarker Values between Cohorts
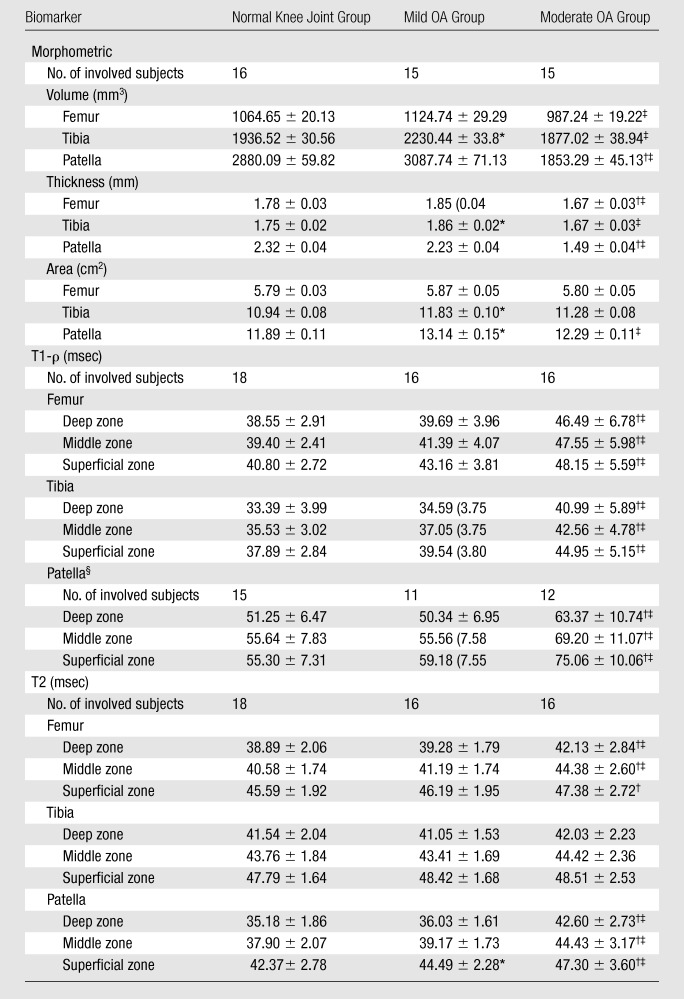
Note.—With exception of numbers of involved subjects, data are mean values ± standard deviations.
Significant difference (P < .05) in mean values between normal knee joint and mild OA groups.
Significant difference (P < .05) in mean values between normal knee joint and moderate OA groups.
Significant difference (P < .05) in mean values between mild OA and moderate OA groups.
Patella T1-ρ values in 12 cases were excluded owing to parameter programming error at one site.
Reproducibility of Cartilage MR Imaging Biomarkers
The reproducibility of the cartilage morphology measurements (Table 4), regardless of the cohort, parameter, or location, was rated as high. The ICC exceeded 0.99 in all except one case (ICC = 0.989 for mean thickness of central medial femoral condyle in normal knee joint cohort). The lower bounds of 95% confident intervals were at least 0.975. Similar results were observed for the RMS CV calculations, which were lower than 4% for all measurements.
Table 4.
Reproducibility of Morphometric Biomarkers according to Location and Cohort
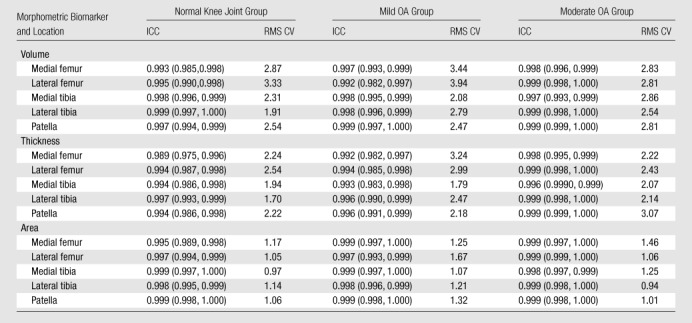
Note.—At subjective reliability rating, an ICC of less than or equal to 0.69 indicated poor reproducibility; an ICC of 0.70–0.79, fair reproducibility; an ICC of 0.80–0.89, good reproducibility; and an ICC of 0.90 or greater, high reproducibility. Regardless of the cohort, parameter, or location, reproducibility of the cartilage morphology measurements was rated as high. RMS CV values are percentages. Numbers in parentheses are the 95% confidence limits that define the 95% confidence intervals.
As shown in Table 5, the reproducibility of cartilage T1-ρ values was moderate and varied according to location. The reproducibility of measurements in the patella was higher than that of measurements in other locations and rated as good or high for all cohorts and all zones. ICCs for patellar T1-ρ measurements ranged from 0.86 to 0.93, with the lower-bound 95% confidence interval as low as 0.67. In the femorotibial joint, ICCs for T1-ρ measurements ranged from 0.20 to 0.84, with 27 (60%) of 45 measurements rated as having poor reliability and six (13%) measurements rated as having fair reliability. As shown in Table 6, pooling the depth-dependent zones did not improve the reproducibility of measurements in the femorotibial joint, where the reliability of all T1-ρ measurements was rated as fair or poor. ICCs for the pooled patellar T1-ρ measurements ranged from 0.89 to 0.92, indicating good to high reliability.
Table 5.
Reproducibility of Compositional Biomarkers according to Location, Zone, and Cohort
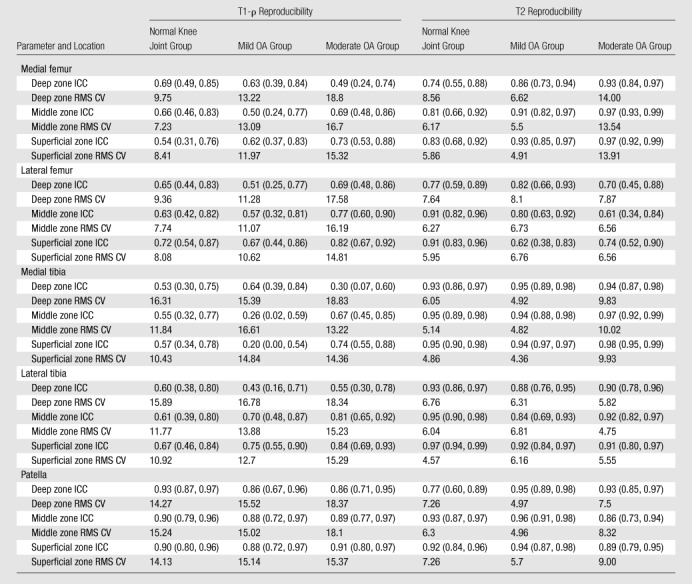
Note.—At subjective reliability rating, an ICC of less than or equal to 0.69 indicated poor reproducibility; an ICC of 0.70–0.79, fair reproducibility; an ICC of 0.80–0.89, good reproducibility; and an ICC of 0.90 or greater, high reproducibility. RMS CV values are percentages. Numbers in parentheses are the 95% confidence limits that define the 95% confidence intervals.
Table 6.
Reproducibility of Compositional Biomarkers when Depth-Dependent Zones Are Pooled
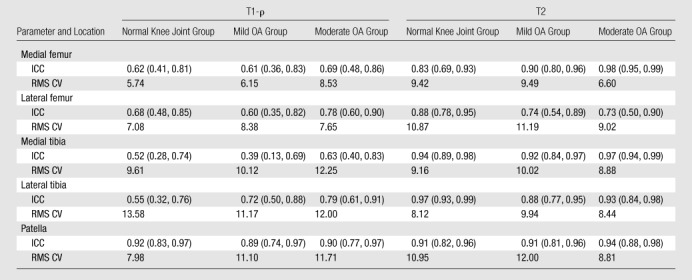
Note.—At subjective reliability rating, an ICC of less than or equal to 0.69 indicated poor reproducibility; an ICC of 0.70–0.79, fair reproducibility; an ICC of 0.80–0.89, good reproducibility; and an ICC of 0.90 or greater, high reproducibility. RMS CV values are percentages. Numbers in parentheses are the 95% confidence limits that define the 95% confidence intervals.
Cartilage thickness influenced the reliability of T1-ρ measurements. The ICCs for T1-ρ measurements in subjects with thinner cartilage, defined as cartilage in the thinner half of the joint at cartilage morphology thickness assessment, were consistently lower than the ICCs for T1-ρ measurements in subjects with thicker cartilage (results not shown); however, the only significant difference occurred at the central medial femoral condyle. The differences in ICC between thin and thick cartilage were greater at the thinner femorotibial sites than in the patella.
As shown in Table 5, the reproducibility of cartilage T2 measurements was higher than the reproducibility of counterpart T1-ρ measurements. ICCs for individual cohorts and regions ranged from 0.61 to 0.98, with 38 (84%) of 45 sites demonstrating good or high reproducibility. As with T1-ρ measurements, pooling the depth-dependent zones did not substantially influence the reproducibility of T2 measurements. Pooled ICCs ranged from 0.73 to 0.98, with all but the lateral femur demonstrating good or high reproducibility. In contrast to the ICCs for T1-ρ values, the ICCs for cartilage T2 values measured in the thinner cartilage were consistently higher than those for T2 values measured in the thicker cartilage, but no differences were significant.
Discussion
Key steps in using quantitative imaging biomarkers in clinical trials are the documentation and systematic assessment of reproducibility in a representative population and trial network. In this study, we prospectively evaluated the reproducibility of a portfolio of morphologic and compositional MR imaging biomarkers that have been proposed for use in OA studies involving a multisite multivendor network.
In this study, the reproducibility of cartilage morphology measurements was extremely high, regardless of the degree of radiographically detected knee OA, parameter, or location. The results of this study are similar to those of a previous multicenter multivendor trial to evaluate the test-retest reliability achieved with use of 3-T MR imaging units (5). In that study, reported RMS CVs for cartilage volume and thickness ranged from 2.1% to 3.9%, and those for cartilage surface area ranged from 1.0% to 2.0%. In comparison, in our study, the RMS CVs for cartilage volume and thickness ranged from 1.9% to 3.9%, and those for cartilage surface area ranged from 0.9% to 1.7%. In terms of RMS CV, the measured reproducibility of cartilage volume and cartilage thickness measurements was approximately 0.05% lower than that of measurements obtained with 3-T imaging in a single-site trial (31) and compares favorably with the results of reproducibility studies performed with 1.5-T imaging at single sites (14).
Cartilage T1-ρ has been proposed as a potential biomarker of cartilage proteoglycan content. Although this parameter has been assessed in several validation studies (10,32,33), it has had limited application in clinical trials. To our knowledge, the reproducibility of this potential biomarker has not been previously reported on in a multicenter trial. Of the MR imaging biomarkers evaluated in our current investigation, T1-ρ had the lowest reproducibility, with the majority of ROI measurements rated as having fair or poor reliability. The reliability of T1-ρ measurements was substantially better in the patella than in the femorotibial joint for all cohorts.
Several factors probably contribute to the lower reproducibility of T1-ρ measurements. First, there is an inherent trade-off of reproducibility for sensitivity. Of all the biomarkers evaluated, T1-ρ measurements demonstrated the greatest responsiveness to differences between cohorts based on the severity of radiographically detected knee OA. In subjects with radiographically detected knee OA, the dynamic range of T1-ρ values was greater than the dynamic range of cartilage T2 measurements, consistent with the results previously reported by Regatte et al (24) and Li et al (34). Cartilage degradation in subjects with radiographically detected knee OA demonstrates substantial spatial heterogeneity (34,35). The high sensitivity of T1-ρ to these heterogeneous differences results in greater variation in the measurement with relatively small differences in subject positioning and ROI segmentation.
Second, the higher reliability of T1-ρ measurements in the patella suggests that cartilage thickness may be a factor in measurement precision. In our study, this effect was probably accentuated by the lower in-plane resolution of the T1-ρ source images (0.55 mm) compared with the 0.27-mm in-plane resolution of the cartilage morphometry source images and the 0.36-mm in-plane resolution of the T2-weighted multisection multiecho source images. In terms of the number of voxels in the articular cartilage, femoral and tibial sites with an average thickness of 1.8 mm contain approximately 3.2 pixels across the average cartilage plate. The median patellar cartilage thickness was 2.1 mm, yielding about 3.9 pixels across the average cartilage plate. There was a trend toward lower reproducibility of T1-ρ measurements in subjects with thin cartilage, which was more pronounced in the thinner cartilage of the femorotibial joint. These findings suggest that there is a floor effect below which cartilage thickness is a factor in determining the reliability of the measurement. Our results suggest that in planning protocols for T1-ρ measurements, the in-plane spatial resolution should be sufficient to yield at least 4 pixels across the targeted cartilage plate.
Previous evaluations of cartilage T2 reproducibility have been limited to single-site single-vendor studies of the patella (16,36,37). In our study, cartilage T2 measurements generally had good to high reproducibility. The calculated ICCs for cartilage T2, in contrast to those for T1-ρ, were similar for the patellar cartilage and femorotibial cartilage, with slightly lower reproducibility observed in the lateral femur, as compared with other sites. Also, the influence of cartilage thickness on reproducibility was smaller for T2 measurements than for T1-ρ measurements, with slightly better reproducibility observed in subjects with thinner cartilage. Pooling cartilage ROIs did not substantially improve reproducibility. In terms of the five sites, the reproducibility of global cartilage T2 measurements was rated as good or high in all but the lateral femoral cartilage.
Similar results are observed when the reproducibility is determined by using RMS CVs. In the current study, RMS CVs in the patella ranged from 5% to 9%, which is approximately 2%–3% higher than the values reported by Glaser et al (16) in a single-site study of cartilage T2 reproducibility in a cohort of 10 healthy volunteers. In the prior study of Glaser et al, lower reproducibility in the superficial layer of the cartilage, probably due to volume averaging with adjacent tissues, was reported (16). Our results indicated slightly better reproducibility in the middle zone than in the deep and superficial layers; however, the difference was small and not significant. If segmentation variability and volume averaging with adjacent tissue had been major sources of variation in our study, we would have expected to see lower measurement reproducibility in thinner cartilage, where the relative contribution of volume averaging would be greater. Instead, we observed a trend toward better reproducibility in the thinner cartilage. This observation is consistent with the results of Koff et al (37), indicating that segmentation errors are a small source of variability in the precision of cartilage T2 measurements.
In the femorotibial joint, the T2 was longer than the T1-ρ—probably owing to several factors. First, the T2 analysis was restricted to the central femorotibial joint, where the radial zone of cartilage, which has lower T2 values (38), comprises the majority of the cartilage structure (18). In comparison, the T1-ρ analysis included cartilage from the entire femorotibial articular surface. Second, the T2 was measured by using a multisection multiecho readout sequence in contrast to the gradient-echo technique used to measure the T1-ρ.
There were several limitations of the study. First, it involved a global assessment of reproducibility within a multicenter multivendor clinical trial network. The study was not sufficiently powered for a comparison of reproducibility between sites or between vendors. Second, we did not perform a subanalysis to determine the relative contribution of image acquisition and image analysis precision errors on the overall reproducibility of the measurements. The reported reproducibility values represent aggregate estimates. Third, because the T2 and the T1-ρ were measured by using different image readout techniques and were analyzed by using different ROIs, the data did not allow a direct comparison of T2 and T1-ρ values within individual subjects.
This study facilitated a global assessment of the reproducibility and discriminatory power of a portfolio of cartilage morphometric and compositional biomarkers in a multicenter multivendor clinical trial network. Our results indicate the reproducibility of MR imaging biomarkers of knee cartilage morphology, T2, and patellar T1-ρ and that these are sufficient for use as quantitative outcome measures in clinical studies. The MR imaging measurements of cartilage morphometry were highly reproducible in a multicenter multivendor trial. T1-ρ measurements were the most responsive to differences in cartilage among subjects with different grades of radiographically detected knee OA. The reproducibility of this measurement in the femorotibial joint was poor, whereas it was substantially better in the patellar cartilage—probably owing in part to the greater thickness of the cartilage in this compartment. Cartilage T2 mapping demonstrated moderate responsiveness to differences in cartilage among subjects with different grades of radiographically detected knee OA and yielded results that were sufficiently reproducible for subregional analysis based on the depth from the articular surface.
Advances in Knowledge.
-
•.
Quantitative biomarkers of cartilage morphology are highly reproducible.
-
•.
Compared with young asymptomatic control subjects, subjects with radiographically detected knee osteoarthritis have larger cartilage T1-ρ values; however, T1-ρ measurements in the femorotibial joint are subject to relatively large precision errors.
-
•.
Quantitative cartilage T2 mapping yields good to high reproducibility and enables layered analysis based on the depth from the articular surface.
Implication for Patient Care.
-
•.
Quantitative morphologic and compositional MR imaging biomarkers of cartilage may be reproducible outcome measures in clinical trials.
Acknowledgments
The authors gratefully acknowledge the contribution of Cynthia Olson, MBA, MHS, of ACRIN, for her organization and administrative support for this project.
Received June 11, 2010; revision requested July 12; revision received September 17; accepted September 23; final version accepted October 20.
Supported by the Commonwealth of Pennsylvania through the Commonwealth Universal Research Enhancement program (grant SAP #4100026182).
Disclosures of Potential Conflicts of Interest: T.J.M. Financial activities related to the present article: received grant from ACRIN-PA; received payment for travel expenses to attend ACRIN meeting. Financial activities not related to the present article: was a paid consultant for Kensey Nash. Other relationships: none to disclose. Z.Z. Financial activities related to the present article: received consulting fee or honorarium from ACRIN-PA. Financial activities not related to the present article: none to disclose. Other relationships: none to disclose. R.R. Financial activities related to the present article: received grant from ACRIN. Financial activities not related to the present article: received grant from Wyeth Research; holds patent with University of Pennsylvania for T1-ρ technology. Other relationships: none to disclose. S.B. No potential conflicts of interest to disclose. B.N.M. Financial activities related to the present article: received funding support from ACRIN. Financial activities not related to the present article: was employee of Morphotek, Novartis, and Siemens. Other relationships: none to disclose. W.B.M. Financial activities related to the present article: received grant from ACRIN-PA. Financial activities not related to the present article: was a consultant for GE Medical Systems; was scientific advisory board member of GE Medical Systems; was a consultant for Apriomed; received payment for lectures from GE Medical Systems; received royalties from miscellaneous publishers. Other relationships: none to disclose. C.K.K. Financial activities related to the present article: received grant from ACRIN. Financial activities not related to the present article: received grant from Astra Zeneca. Other relationships: none to disclose. F.E. Financial activities related to the present article: received grant from ACRIN. Financial activities not related to the present article: was a consultant for Merck Serono; was a consultant for Novartis; was a consultant for Sanofi Aventis; was employee of Chondrometrics; held stock or stock options in Chondrometrics; received grant from National Institutes of Health; received payment for lectures from Genzyme; received payment for lectures from Merck. Other relationships: none to disclose. W.R.T.W. No potential conflicts of interest to disclose. A.B. Financial activities related to the present article: none to disclose. Financial activities not related to the present article: received grant from National Institutes of Health, National Center for Research Resources; received payment for lectures from AO Spine International; holds a patent with MicroMRI; receives royalties from MicroMRI. Other relationships: none to disclose.
Abbreviations:
- ICC
- intraclass correlation coefficient
- OA
- osteoarthritis
- RMS CV
- root-mean-square coefficient of variation
- ROI
- region of interest
- T1-ρ
- spin lattice relaxation time in the rotating frame
References
- 1.Eckstein F, Mosher T, Hunter D. Imaging of knee osteoarthritis: data beyond the beauty. Curr Opin Rheumatol 2007;19(5):435–443. [DOI] [PubMed] [Google Scholar]
- 2.Peterfy CG, Schneider E, Nevitt M. The osteoarthritis initiative: report on the design rationale for the magnetic resonance imaging protocol for the knee. Osteoarthritis Cartilage 2008;16(12):1433–1441. [DOI] [PMC free article] [PubMed] [Google Scholar]
- 3.Le Graverand MP, Buck RJ, Wyman BT, et al. . Change in regional cartilage morphology and joint space width in osteoarthritis participants versus healthy controls: a multicentre study using 3.0 Tesla MRI and Lyon-Schuss radiography. Ann Rheum Dis 2010;69(1):155–162. [DOI] [PubMed] [Google Scholar]
- 4.Abadie E, Ethgen D, Avouac B, et al. . Recommendations for the use of new methods to assess the efficacy of disease-modifying drugs in the treatment of osteoarthritis. Osteoarthritis Cartilage 2004;12(4):263–268. [DOI] [PubMed] [Google Scholar]
- 5.Eckstein F, Buck RJ, Burstein D, et al. . Precision of 3.0 Tesla quantitative magnetic resonance imaging of cartilage morphology in a multicentre clinical trial. Ann Rheum Dis 2008;67(12):1683–1688. [DOI] [PubMed] [Google Scholar]
- 6.Eckstein F, Guermazi A, Roemer FW. Quantitative MR imaging of cartilage and trabecular bone in osteoarthritis. Radiol Clin North Am 2009;47(4):655–673. [DOI] [PubMed] [Google Scholar]
- 7.Eckstein F, Ateshian G, Burgkart R, et al. . Proposal for a nomenclature for magnetic resonance imaging based measures of articular cartilage in osteoarthritis. Osteoarthritis Cartilage 2006;14(10):974–983. [DOI] [PubMed] [Google Scholar]
- 8.Burstein D, Gray M, Mosher T, Dardzinski B. Measures of molecular composition and structure in osteoarthritis. Radiol Clin North Am 2009;47(4):675–686. [DOI] [PubMed] [Google Scholar]
- 9.Bruno MA, Mosher TJ, Gold GE. Arthritis in color: advanced imaging of arthritis. Philadelphia, Pa: Saunders/Elsevier, 2009. [Google Scholar]
- 10.Duvvuri U, Reddy R, Patel SD, Kaufman JH, Kneeland JB, Leigh JS. T1rho-relaxation in articular cartilage: effects of enzymatic degradation. Magn Reson Med 1997;38(6):863–867. [DOI] [PubMed] [Google Scholar]
- 11.Mosher TJ, Dardzinski BJ. Cartilage MRI T2 relaxation time mapping: overview and applications. Semin Musculoskelet Radiol 2004;8(4):355–368. [DOI] [PubMed] [Google Scholar]
- 12.Biomarkers Definitions Working Group Biomarkers and surrogate endpoints: preferred definitions and conceptual framework. Clin Pharmacol Ther 2001;69(3):89–95. [DOI] [PubMed] [Google Scholar]
- 13.Eckstein F, Kunz M, Schutzer M, et al. . Two year longitudinal change and test-retest-precision of knee cartilage morphology in a pilot study for the osteoarthritis initiative. Osteoarthritis Cartilage 2007;15(11):1326–1332. [DOI] [PMC free article] [PubMed] [Google Scholar]
- 14.Eckstein F, Cicuttini F, Raynauld JP, Waterton JC, Peterfy C. Magnetic resonance imaging (MRI) of articular cartilage in knee osteoarthritis (OA): morphological assessment. Osteoarthritis Cartilage 2006;14(suppl A):A46–A75. [DOI] [PubMed] [Google Scholar]
- 15.Pakin SK, Xu J, Schweitzer ME, Regatte RR. Rapid 3D-T1rho mapping of the knee joint at 3.0T with parallel imaging. Magn Reson Med 2006;56(3):563–571. [DOI] [PubMed] [Google Scholar]
- 16.Glaser C, Mendlik T, Dinges J, et al. . Global and regional reproducibility of T2 relaxation time measurements in human patellar cartilage. Magn Reson Med 2006;56(3):527–534. [DOI] [PubMed] [Google Scholar]
- 17.Raya JG, Dietrich O, Horng A, Weber J, Reiser MF, Glaser C. T2 measurement in articular cartilage: impact of the fitting method on accuracy and precision at low SNR. Magn Reson Med 2010;63(1):181–193. [DOI] [PubMed] [Google Scholar]
- 18.Goodwin DW, Wadghiri YZ, Zhu H, Vinton CJ, Smith ED, Dunn JF. Macroscopic structure of articular cartilage of the tibial plateau: influence of a characteristic matrix architecture on MRI appearance. AJR Am J Roentgenol 2004;182(2):311–318. [DOI] [PubMed] [Google Scholar]
- 19.Xia Y, Moody JB, Alhadlaq H, Burton-Wurster N, Lust G. Characteristics of topographical heterogeneity of articular cartilage over the joint surface of a humeral head. Osteoarthritis Cartilage 2002;10(5):370–380. [DOI] [PubMed] [Google Scholar]
- 20.Borthakur A, Mellon E, Niyogi S, Witschey W, Kneeland JB, Reddy R. Sodium and T1rho MRI for molecular and diagnostic imaging of articular cartilage. NMR Biomed 2006;19(7):781–821. [DOI] [PMC free article] [PubMed] [Google Scholar]
- 21.Witschey WR, Borthakur A, Elliott MA, et al. . T1rho-prepared balanced gradient echo for rapid 3D T1rho MRI. J Magn Reson Imaging 2008;28(3):744–754. [DOI] [PMC free article] [PubMed] [Google Scholar]
- 22.Eckstein F, Hudelmaier M, Wirth W, et al. . Double echo steady state magnetic resonance imaging of knee articular cartilage at 3 Tesla: a pilot study for the Osteoarthritis Initiative. Ann Rheum Dis 2006;65(4):433–441. [DOI] [PMC free article] [PubMed] [Google Scholar]
- 23.Wirth W, Eckstein F. A technique for regional analysis of femorotibial cartilage thickness based on quantitative magnetic resonance imaging. IEEE Trans Med Imaging 2008;27(6):737–744. [DOI] [PubMed] [Google Scholar]
- 24.Regatte RR, Akella SV, Lonner JH, Kneeland JB, Reddy R. T1rho relaxation mapping in human osteoarthritis (OA) cartilage: comparison of T1rho with T2. J Magn Reson Imaging 2006;23(4):547–553. [DOI] [PubMed] [Google Scholar]
- 25.Mosher TJ, Liu Y, Torok CM. Functional cartilage MRI T2 mapping: evaluating the effect of age and training on knee cartilage response to running. Osteoarthritis Cartilage 2010;18(3):358–364. [DOI] [PMC free article] [PubMed] [Google Scholar]
- 26.Maier CF, Tan SG, Hariharan H, Potter HG. T2 quantitation of articular cartilage at 1.5 T. J Magn Reson Imaging 2003;17(3):358–364. [DOI] [PubMed] [Google Scholar]
- 27.McGraw KO, Wong SP. Forming inferences about some intraclass correlation coefficients. Psychol Methods 1996;1(1):30–46. [Google Scholar]
- 28.Ramasundarahettige CF, Donner A, Zou GY. Confidence interval construction for a difference between two dependent intraclass correlation coefficients. Stat Med 2009;28(7):1041–1053. [DOI] [PubMed] [Google Scholar]
- 29.Glüer CC, Blake G, Lu Y, Blunt BA, Jergas M, Genant HK. Accurate assessment of precision errors: how to measure the reproducibility of bone densitometry techniques. Osteoporos Int 1995;5(4):262–270. [DOI] [PubMed] [Google Scholar]
- 30.Meyers CR. Measurement in physical education. New York, NY: Ronald, 1974. [Google Scholar]
- 31.Eckstein F, Charles HC, Buck RJ, et al. . Accuracy and precision of quantitative assessment of cartilage morphology by magnetic resonance imaging at 3.0T. Arthritis Rheum 2005;52(10):3132–3136. [DOI] [PubMed] [Google Scholar]
- 32.Wheaton AJ, Casey FL, Gougoutas AJ, et al. . Correlation of T1rho with fixed charge density in cartilage. J Magn Reson Imaging 2004;20(3):519–525. [DOI] [PubMed] [Google Scholar]
- 33.Mlynárik V, Trattnig S, Huber M, Zembsch A, Imhof H. The role of relaxation times in monitoring proteoglycan depletion in articular cartilage. J Magn Reson Imaging 1999;10(4):497–502. [DOI] [PubMed] [Google Scholar]
- 34.Li X, Benjamin Ma C, Link TM, et al. . In vivo T(1rho) and T(2) mapping of articular cartilage in osteoarthritis of the knee using 3 T MRI. Osteoarthritis Cartilage 2007;15(7):789–797. [DOI] [PMC free article] [PubMed] [Google Scholar]
- 35.Hellio Le Graverand MP, Buck RJ, Wyman BT, et al. . Subregional femorotibial cartilage morphology in women: comparison between healthy controls and participants with different grades of radiographic knee osteoarthritis. Osteoarthritis Cartilage 2009;17(9):1177–1185. [DOI] [PubMed] [Google Scholar]
- 36.Raya JG, Horng A, Dietrich O, et al. . Voxel-based reproducibility of T2 relaxation time in patellar cartilage at 1.5 T with a new validated 3D rigid registration algorithm. MAGMA 2009;22(4):229–239. [DOI] [PubMed] [Google Scholar]
- 37.Koff MF, Parratte S, Amrami KK, Kaufman KR. Examiner repeatability of patellar cartilage T2 values. Magn Reson Imaging 2009;27(1):131–136. [DOI] [PMC free article] [PubMed] [Google Scholar]
- 38.Dardzinski BJ, Mosher TJ, Li S, Van Slyke MA, Smith MB. Spatial variation of T2 in human articular cartilage. Radiology 1997;205(2):546–550. [DOI] [PubMed] [Google Scholar]