Abstract
Infrared spectroscopic imaging provides micron-scale spatial resolution with molecular contrast. While recent work demonstrates that sample morphology affects the recorded spectrum, considerably less attention has been focused on the effects of the optics, including the condenser and objective. This analysis is extremely important, since it will be possible to understand effects on recorded data and provides insight for reducing optical effects through rigorous microscope design. Here, we present a theoretical description and experimental results that demonstrate the effects of commonly-employed cassegranian optics on recorded spectra. We first combine an explicit model of image formation and a method for quantifying and visualizing the deviations in recorded spectra as a function of microscope optics. We then verify these simulations with measurements obtained from spatially heterogeneous samples. The deviation of the computed spectrum from the ideal case is quantified via a map which we call a deviation map. The deviation map is obtained as a function of optical elements by systematic simulations. Examination of deviation maps demonstrates that the optimal optical configuration for minimal deviation is contrary to prevailing practice in which throughput is maximized for an instrument without a sample. This report should be helpful for understanding recorded spectra as a function of the optics, the analytical limits of recorded data determined by the optical design, and potential routes for optimization of imaging systems.
Mid-infrared (IR) microscopy and spectroscopic imaging1 provide both quantitative molecular contrast and spatial resolution. These imaging methods are useful in a variety of fields, including biomedical,2,3 polymeric4 and forensic analysis.5,6 In the most common instrumental configuration, a Fourier Transform Infrared (FT-IR) imaging spectrometer uses an interferometer to record light intensity at each pixel of a focal plane array detector. Intensity transmitted through a sample (Is) is compared to that without the sample (I0) to determine the absorbance A:
where ν̄ denotes wavenumber (in cm−1) and r is a spatial coordinate. The recorded spectrum is ideally related to the imaginary part of the refractive index κ(ν̄) and the sample path length d through Beers law:
| (1) |
The expression above, which can be termed the ideal case for the absorbance, ignores all boundary phenomena at the sample, such as diffraction and scattering, and is only valid for an incident plane wave. In practice, the measured spectrum from a heterogeneous sample will also depend on the real part of the refractive index and will differ from that predicted in Equation 1. The changes have been recognized and rigorous theoretical models are now available to predict differences between recorded and expected spectra.7,8 Differences between recorded spectra and those predicted from the simple Beers law expression of Equation 1 are due both to the morphology (e.g., sample boundaries, shapes of domains) as well as the microscope optics (e.g. spectral range, angular diversity of the focused light and collected light).
A comprehensive theory has recently been provided that allows for an understanding of recorded spectra if the parameters of the optical system and sample are known, as noted above. The same framework has been extended to predict and validate recorded spectra from simple geometries, such as cylinders9 and spheres.10 In these comprehensive approaches, both morphology and refractive index (real and imaginary parts) are sought to be rigorously obtained. These are typically termed “physically-based” methods. Other approaches have also been proposed to extract spectral information from a range of samples by considering a model for the morphology to be spherical scattering. centers11 These methods essentially seek to separate the effects of scattering from the recorded data to obtain the ideal absorbance. They are typically termed “model-based” methods. The study of scattering in mid-infrared spectroscopic imaging is an active are of research, particularly in biology where heterogeneous tissue samples involve a tight coupling between the sample's structure and the recorded absorption spectrum at every pixel.12 Previous work suggests that scattering through cellular structures can be approximated using Mie theory13 and efforts have been made to understand this behavior.14 Hence, spheres are an excellent model to study the effect of the sample geometry in a microscope, whether one is pursuing physics-based or model-based approaches.
While significant attention has been paid to understanding recorded spectra as a function of sample morphology, less attention has been paid to the optical design of the microscope itself and to its effects on the recorded data. The use of optical systems analysis to design IR microscopy systems was previously demonstrated,15 where a comprehensive analysis of a high-resolution imaging spectrometer provided design guidance to obtain the highest quality images as a function of the optical setup. That study, however, did not examine the coupled nature of spectral recording from a sample and the optical setup of the microscope. Other recent work characterizes the effects of dispersion due to the substrate16 or surrounding windows,17 demonstrating that additional optical components can be added to compensate for these effects. However, we demonstrate that deviations from the ideal case seen in current FT-IR imaging systems are due to the loss of angular components due to the numerical aperature and inner obscuration of both the objective and condenser. Introducing intermediate lenses cannot easily retrieve these components.
In this paper, we focus on the dependence of recorded spectra on the optical configuration of the microscope. Since the most important optics used in image formation are the objective and the condenser, we focus on these two elements. We first demonstrate that recorded spectra from a sample are highly dependent on the optics used. By simulating a scattering sample of known optical properties and shape, we show that the recorded spectrum can be explicitly calculated and employed to study the effect of the microscope optics. We first identify the effects of the imaging system on deviations from the ideal case in the absorption spectrum using a forward model based on Mie theory.18 We measure the difference between the recorded spectrum and one that would result from an equivalent sample without any morphological or optical coupling using the mean-centered Mean Squared Error (MSE). We then propose a visualization method for these deviations using a new approached we term. deviation maps Deviation maps are used to quantify the effects of optical-system components and deduce which of them significantly influence recorded data. Finally, we validate the developed methodology using a commercially-available instrument and suggest methods for improving current imaging systems to minimize the effect of morphology on the recorded data.
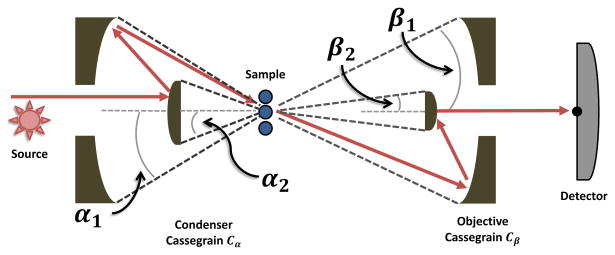
An FT-IR spectroscopic imaging system consists of a broad-band source passed through an interferometer and into an infrared microscope. A sample is placed between a condenser Cα and objective Cβ. These two optical elements are almost universally implemented using Schwarzschild objectives (specialized Cassegrains) at the present time, which are characterized by a numerical aperture (NA) and the angle subtended by the central obscuration (Figure 1). The NA specifies the light entering each Cassegrain in terms of the solid angles α1 = sin−1 (NAα) and β1 = sin−1 (NAβ). The solid angles α2 and β2 specify the light that is blocked by the central mirrors. Anecdotally, it is considered optimal to match the condenser and objective in order to maximize light throughput and obtain optimal magnification. This assumption, to our knowledge, has not been tested using a sample in a microscope and rigorous theory. Further, the dogma likely propagates from single point mapping microscopes19 in which throughput was low due to aperatures and the primary goal was to obtain a high signal-to-noise ratio. Here we first sought to examine whether, in the presence of a sample characterized by Mie scattering, a matched condenser and objective provide the optimal arrangement in terms of spectral quality. The first step in this process is to describe light propagation through the system.
Fig. 1.
The optics in an IR imaging system consist of a mid-infrared source (modulated by an interferometer here), two Cassegrain reflectors for condensing (Cα) and collecting light (Cβ) and a detector. Each Cassegrain is characterized by the collecting angles (α1 and β1) specified by the numerical aperture (NA), and the angle subtended by the secondary (internal) mirror (α2 and β2). Note that scattering from a sample may change the angle of the propagating wave, as shown schematically here.
The signal at the detector is computed by integrating the intensity of the field at the objective,
Here, the incident field Ui is approximated using Debye focusing, 20 where a superposition of plane waves are summed over all directions that lie within the solid angle α of the focusing optics:
where v is the normalized direction vector from the sphere to a point at the objective in the far zone.
The scattered field Us is given by
where is the order-l spherical Hankel function, Pl is the order-l associated Legendre polynomial, and Cl is the integral across the focusing optics:
which has the following closed-form solution:
The scattering coefficients Bl are determined by enforcing the appropriate boundary conditions at the sphere surface:
where a is the radius of the sphere, jl is an order-l spherical Bessel function of the first kind, the material properties are given by the complex index of refraction m(ν̄) = n(ν̄) + iκ(ν̄), and the prime indicates differentiation with respect to the argument.
The absorption spectrum is computed by dividing the intensity of the scattered field I(ν̄) by the intensity of the incident field . Using asymptotic expressions for the spherical Hankel functions and incident plane waves, the expressions for the incident and scattered field are given by:
The proposed Mie-scattering simulation is implemented using a graphics processor, where the intensity at the detector is computed in parallel for each wavenumber. The integral is computed numerically for n = 1000 samples along the range [β1…β2]. For a given set of parameters (α1, α2, β1, β2), we simulate a non-absorbing sphere and measure the resulting distortion in the absorbance spectrum due to Mie scattering. Given a fixed objective Cβ and a set of material properties, we then characterize the effect of the condenser parameters on distortion as a function of α1 and α2.
Several options exist for quantifying the degree of spectral deviation from the desired absorbance. Here, we evaluate the effects by determining the mean-centered mean squared error (MSE) of a simulated spectrum with the ideal case of an equivalent volume whose morphology does not affect the spectrum. The ideal case is simply a calculation of the spectrum for a given volume of material interacting with a propagating plane wave. It must be noted that we use this terminology only to adhere to the notion of chemometric methods in which a prediction is compared to the expected value. We emphasize that the term error here must not be used to mean that the recorded data are somehow inaccurate. Hence, we use the term deviation to imply the difference between recorded and expected from a sample in which morphology plays no role. Since spectral deviations are modeled to arise from the scattering from a sphere and can be calculated using the real part of the index of refraction n(ν̄), their contribution can be conveniently studied independently of absorbance, by assuming κ(ν̄) = 0, when needed. For a given sphere with index of refraction n(ν̄) with radius r, the extinction spectrum is simulated and compared to the ideal spectrum A(ν̄) = κ(ν̄) = 0. The comparison is computed by finding the mean squared error of the mean-centered absorption spectrum given by , in which Aμ is the mean given by . Note that our definition is over the entire spectrum to not prejudice specific spectral regions. It is well known, however, that specific spectral regions may be more important for specific applications and our methodology can be used to optimize for specific cases without loss of generality. The effect on data of a given objective Cβ is characterized by computing the absorption spectrum for a range of values of α1 and α2. At each set of values for Cα, the spectrum and corresponding deviation are calculated. The results are then displayed using a deviation map, which displays the total difference from the spectrum that would be obtained if morphology had no effect and only as a function of optical parameters of the lenses.
The range of values simulated are specified by α1 = (β2, 1.0) and α2 = (0.0, min(α1, β1)). These ranges are selected because they are the only values for a that allow incident light to reach the detector in an empty instrument, making an absorbance measurement possible. However, we do note that light scattered by the sample can arrive at the detector for values of α outside of these ranges. However, these effects are expected to be very small and simulations are difficult to compare to measurements, since the deviation metric must then compensate for the complex spectral profile of the source as well as atmospheric correction. Hence, the developed approach likely accounts for almost all effects while being practical in implementation.
The modeling and visualization methods are implemented in the I-Mie simulation package, which is open-source and available for download from our group's website. We also tested the predictions of the simulation against experimental data. We modified a commercial FT-IR imaging instrument to be equipped with multiple Cassegrains and lenses with attendant apertures to control the angles α and β. A 74X 0.65NA cassegrain objective was used to image 10μm diameter spheres on a barium fluoride (BaF2) slide using an Agilent FT-IR spectroscopic imaging system, as per previously described methods.10 Two condensers were tested: (a) a 15X 0.55NA cassegrain with a 0.2NA internal obscuration, and (b) a 0.6NA germanium (Ge) lens with an adjustable pupil. Measurements of the spheres were taken using both the cassegrain objective and Ge lens. An adjustable pupil was used to block higher-order components of the image through the Ge lens, simulating a varying NA. The measured results are shown in Figure 3. To our knowledge, these are the first reports that provide a systematic analysis of the optical effects introduced by the objective and condenser in an FT-IR imaging system. While this was expected from previous theoretical studies and anecdotally by several scientists, the actual demonstration and precise effects of changing optics can be observed here.
Fig. 3.
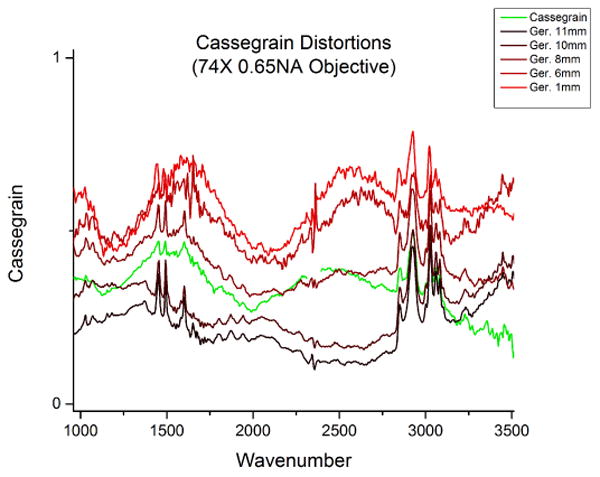
The dependence of spectra on optical configuration can be seen in recorded spectra from a single polystyrene sphere, approximately 10μm in size. Spectra were recorded using a 74X 0.65NA cassegrain objective and various condenser parameters, including a 15X 0.5NA cassegrain (green) and a 0.6NA germanium lens with a varying pupil to simulate changing NA. The NA of the germanium lens was artificially reduced using a pupil between 1mm and 11mm in diameter (black-red). Note the variation in recorded spectra and changes in chemical signal as the condenser NA is reduced.
While one aspect of this demonstration is that practitioners should take into account the optics of the imaging system to correct for the effects of morphology on recorded spectral data, another is that this framework can be used to design better imaging systems. While the results above indicate what might happen if the NA were changed, we sought to examine the optimal configuration that may reduce baseline deviations. We constructed deviation maps for spectra that would be obtained by spanning the typical parameters that are encountered for IR imaging lenses, as shown in Figure 4. A number of lessons are apparent from these plots. The most important conclusion is that a matched 15X configuration, which is close to the current standard in IR imaging, strongly couples the effects of the optical setup to data from a scattering sample. While current commercial systems optimize for resolution and signal-to-noise by matching condenser and objective optics, our results suggest that this often provides the worst results in terms of spectral deviations. In general, we note that the use of a Schwarzschild objective with a central obscuration appears to play a role in both spectral deformation and reducing the amplitude of chemically relevant features. While their use is indicated to reduce aberrations, especially when the spectral region is as wide as the typical mid-IR measurement, the figure clearly demonstrates that the central obscuration leads to a very strong coupling between morphology and data recorded. An alternative is available in the form of germanium or zinc selenide lenses, whose use should be considered. In our view, whatever lenses are used, some form of correction will be required. Hence, the use of refracting lenses may require the correction of morphological distortions. In cases where the optical image provides sufficient morphologic information and the use of imaging is to understand chemical changes, the use of refracting lenses may prove favorable. These lenses may play an important role in improving spectral quality for biomedical applications.
Fig. 4.
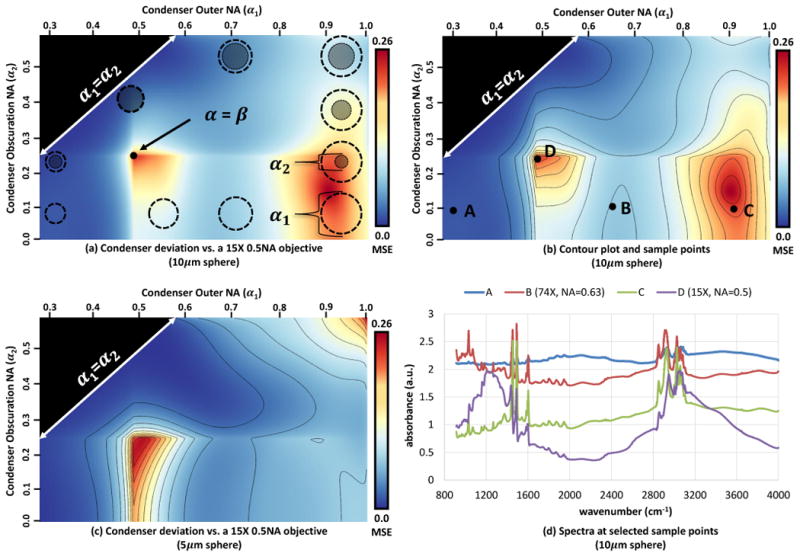
Deviation maps are computed for a 10μm and 5μm polystyrene spheres using parameters for a commercial 15X objective. The condenser geometry is summarized in (a) using circles do show the relative NA (α1) and center obscuration (α2). A contour plot and series of sample points are shown in (b), with the corresponding simulated spectra in (d). Note that a reduction in obscuration size and an increase in condenser NA dramatically improves spectral quality over matched optics (D), while condensers B and C show a reduction in both distortion and chemical signal. The spectrum for a low NA shows very little baseline deviation, while the chemical signal is significantly reduced (A). The deviation map for a 5μm sphere is shown in (c), demonstrating that the sample can affect the optimal optical system. MSE Values: A = 0.02, B = 0.12, C = 0.24, D = 0.26.
In addition, measuring spectral deviations can be a challenging problem. In particular, a majority of the error in Figure 4 is due to dispersion in regions exhibiting chemical absorption. Simulating the deviation map for a dispersion-free material creates a similar deviation map without the high-deviation spot at α1 = 0.9 and α2 = 0.2 (Figure 5). While non-dispersive materials are uncommon in mid-infrared absorbance imaging, this does provide a method for characterizing the deviations resulting from scattering for general samples. Finally, consideration should be given to the desired metric. We have selected the mean-centered MSE since its behavior is well-understood. This results in a quadratic relation in the underlying error, which may not be desirable for optimization. Another option for a deviation metric includes the normalized outer product of the spectrum with the ideal absorbance. Finally, metrics that weight deviations within regions expected to have exhibit chemical absorbance may be useful for optimizing instruments used in biomedicine.
Fig. 5.
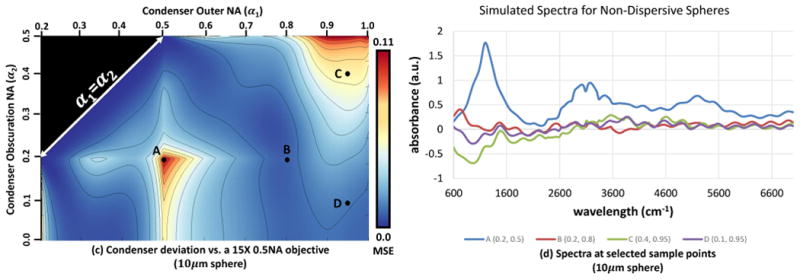
Deviation map produced by a non-dispersive 10μm sphere with a real refractive index of n = 1.48. Using a non-dispersive material provides a method for characterizing the spectral deviations that may be expected for a variety of chemical constituents. In this case, all deviations in the spectrum are due to the filtering of angular components introduced by the optical components of the imaging system. Compare to Figure 4b for an identical optical system and sample morphology, when dispersion occurs due to chemical absorption.
These results suggest that practitioners should consider the combined effects of the optical components on the recorded spectra when optimizing FT-IR spectroscopic imaging systems. This is particularly true in biomedical imaging, where scattering due to tissue heterogeneity plays a significant role in limiting chemical specificity and could be a large source of variance.21 In some studies, scattering from biological samples has been shown to closely match that obtained from the Mie scattering model,14,22,23 as used in our experiments. Hence, the results presented here likely present valid guidance for biomedical analysis. For scattering samples, this model can be used to examine what combination of lenses may provide ideal performance in terms of spectral fidelity. We note that the developed methodology is independent of the spectral recording mode and is equally applicable to laser-based24 or filter-based25 FT-IR imaging systems.
Fig. 2.
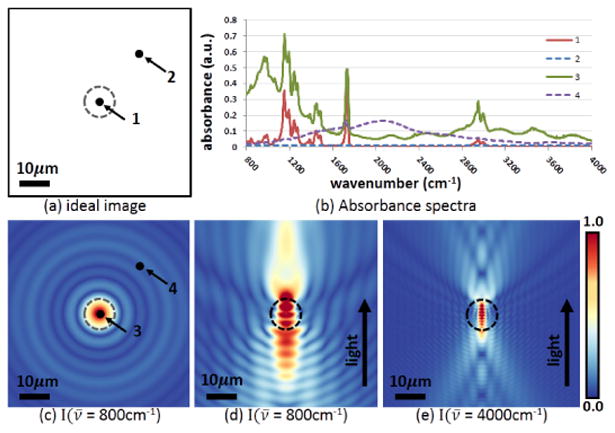
An idealized sample (sphere) in the x-y plane and focused in a microscope, the idealized case considered in this manuscript, is shown schematically in (a). Consider two points: Point 1 at the center of the 5μm diameter sphere (indicated by the dashed line) and Point 2 that is outside the sphere. Ideally, the spectra recorded at 1 and 2 would correspond only to the imaginary part of the refractive index at 1 and produce no signal at 2 (as indicated by the lines labeled 1 and 2 in (b)). The presence of a sample causes deviations from this ideal, however, resulting in a spectrum being recorded that is closely coupled to both the sample morphology and imaging optics. Spectra labeled 3 and 4 in (c) demonstrate the recorded spectra from points 1 and 2 in a real sample. The resulting image from a physical samples is shown in (c) and points 3 and 4 plot the absorbance indicated by the on- and off-sample spectra in (c) labeled as 3 and 4. The perpendicular plane can also be examined. Intensities in the focal plane for 800 and 4000 cm in the presence of the sample in the transverse plane (the y-z plane) are shown in (d) and (e), respectively.
Acknowledgments
This work was funded in part by the National Institutes of Health (NIH) #K99LM011390-01A1, NIH #R01CA138882, and NIH #R01EB009745.
References
- 1.Bhargava R. Applied Spectroscopy. 2012;66:1091–1120. doi: 10.1366/12-06801. [DOI] [PMC free article] [PubMed] [Google Scholar]
- 2.Walsh M, Reddy R, Bhargava R. IEEE Journal on Selected Topics in Quantum Electronics. 2012;18:1502–1513. [Google Scholar]
- 3.Steiner G, Koch E. Analytical and Bioanalytical Chemistry. 2009;394:671–678. doi: 10.1007/s00216-009-2737-5. [DOI] [PubMed] [Google Scholar]
- 4.Bhargava R, Wang SQ, Koenig J. Advances in Polymer Science. 2003;163:137–191. [Google Scholar]
- 5.Tahtouh M, Kalman J, Roux C, Lennard C, Reedy B. Journal of Forensic Sciences. 2005;50:64–72. [PubMed] [Google Scholar]
- 6.Bhargava R, Schwartz Perlman R, Fernandez DC, Levin IW, Bartick EG. Analytical and Bioanalytical Chemistry. 2009;394:2069–2075. doi: 10.1007/s00216-009-2817-6. [DOI] [PubMed] [Google Scholar]
- 7.Davis BJ, Scott Carney P, Bhargava R. Analytical Chemistry. 2010;83:525–532. doi: 10.1021/ac102239b. [DOI] [PubMed] [Google Scholar]
- 8.Davis BJ, Carney PS, Bhargava R. Analytical Chemistry. 2010;82:3474–3486. doi: 10.1021/ac902067p. [DOI] [PubMed] [Google Scholar]
- 9.Davis BJ, Carney PS, Bhargava R. Analytical Chemistry. 2010;82:3487–3499. doi: 10.1021/ac902068e. [DOI] [PubMed] [Google Scholar]
- 10.van Dijk T, Mayerich D, Carney PS, Bhargava R. Applied Spectroscopy. 2013;6:546–552. doi: 10.1366/12-06847. [DOI] [PubMed] [Google Scholar]
- 11.Pijanka J, Kohler A, Yang Y, Dumas P, Chio-Srichan S, Manfait M, Sockalingum G, Sul-Suso J. Analyst. 2009;134:1176–1181. doi: 10.1039/b821112d. [DOI] [PubMed] [Google Scholar]
- 12.Bhargava R, Wang SQ, Koenig JL. Applied Spectroscopy. 1998;52:323–328. [Google Scholar]
- 13.Bassan P, Byrne HJ, Bonnier F, Lee J, Dumas P, Gardner P. Analyst. 2009;134:1586–1593. doi: 10.1039/b904808a. [DOI] [PubMed] [Google Scholar]
- 14.Bassan P, Kohler A, Martens H, Lee J, Jackson E, Lockyer N, Dumas P, Brown M, Clarke N, Gardner P. Journal of Biophotonics. 2010;3:609–620. doi: 10.1002/jbio.201000036. [DOI] [PubMed] [Google Scholar]
- 15.Reddy R, Mayerich D, Walsh M, Schulmerich M, Carney PS, Bhargava R. IEEE International Symposium on Biomedical Imaging. 2012:354–357. [Google Scholar]
- 16.Chan KLA, Kazarian SG. Analytical Chemistry. 2013;85:1029–1036. doi: 10.1021/ac302846d. [DOI] [PubMed] [Google Scholar]
- 17.Chan KLA, Kazarian SG. Analyst. 2013;138:4040–4047. doi: 10.1039/c3an00327b. [DOI] [PubMed] [Google Scholar]
- 18.Gouesbet G, Grehan G. Generalized Lorenz-Mie Theories. 1st. Springer; 2011. [Google Scholar]
- 19.Bhargava R, Wall BG, Koenig JL. Applied Spectroscopy. 2000;54:470–479. [Google Scholar]
- 20.Debye P. Annalen der Physik. 1909;335:755–776. [Google Scholar]
- 21.Kwak JT, Reddy R, Sinha S, Bhargava R. Analytical Chemistry. 2012;84:1063–1069. doi: 10.1021/ac2026496. [DOI] [PMC free article] [PubMed] [Google Scholar]
- 22.Kohler A, Sul-Suso J, Sockalingum GD, Tobin M, Bahrami F, Yang Y, Pijanka J, Dumas P, Cotte M, van Pittius DG, Parkes G, Martens H. Applied Spectroscopy. 2008;62:259–266. doi: 10.1366/000370208783759669. [DOI] [PubMed] [Google Scholar]
- 23.Bambery KR, Wood BR, McNaughton D. The Analyst. 2012;137:126. doi: 10.1039/c1an15628d. [DOI] [PubMed] [Google Scholar]
- 24.Kole MR, Reddy RK, Schulmerich MV, Gelber MK, Bhargava R. Analytical Chemistry. 2012;84:10366–10372. doi: 10.1021/ac302513f. [DOI] [PMC free article] [PubMed] [Google Scholar]
- 25.Kodali AK, Schulmerich M, Ip J, Yen G, Cunningham BT, Bhargava R. Analytical Chemistry. 2010;82:5697–5706. doi: 10.1021/ac1007128. [DOI] [PMC free article] [PubMed] [Google Scholar]


