Abstract
Purpose
To determine if volumetric changes of diffusion-weighted and contrast material–enhanced magnetic resonance (MR) imaging can help assess early tumor response to intraarterial therapy (IAT) in neuroendocrine liver metastasis (NELM).
Materials and Methods
This retrospective single-center comprehensive imaging analysis was performed in compliance with HIPAA and was institutional review board approved. Informed patient consent was waived. Seventy-one patients (39 men; mean age, 62.3 years) with NELM treated with IAT were analyzed retrospectively. MR studies were performed before and 3–4 weeks after therapy. The index lesion was segmented to provide volumetric functional analysis of apparent diffusion coefficient (ADC) and contrast-enhanced MR imaging in the hepatic arterial phase (HAP) and portal venous phase (PVP). Tumor response was defined as increase in volumetric ADC of 15% or greater and decrease in volumetric enhancement of 25% or greater during the HAP or of 50% or greater during the PVP. Patient overall survival was the primary end point after therapy initiation. Univariate analysis included Kaplan-Meier survival curves. The Cox proportional hazards regression model was used to detect interactions between volumetric ADC and contrast-enhanced MR imaging and to calculate the hazard ratio.
Results
There was significant increase in mean volumetric ADC (27%, P < .0001) and significant decrease in mean volumetric enhancement during the HAP (−25.3%, P < .0001) and the PVP (−22.4%, P < .0001) in all patients. Patients who had 15% or greater volumetric ADC increase (n = 49) after therapy had better prognosis than those who had less than 15% increase in volumetric ADC (n = 22) (log-rank test, P < .002). Patients who had 25% or greater decrease in volumetric arterial enhancement (n = 40) or 50% or greater decrease in venous enhancement (n = 18) had better prognosis than those who had less than 25% decrease in volumetric arterial enhancement (n = 31) or less than 50% decrease in venous enhancement (n = 53) (log-rank test, P < .02).
Conclusion
Volumetric functional MR imaging criteria may act as biomarkers of early response, indicating that these criteria may be important to incorporate in future NELM clinical trials.
© RSNA, 2012
Supplemental material: http://radiology.rsna.org/lookup/suppl/doi:10.1148/radiol.12120495/-/DC1
Introduction
Neuroendocrine tumors are a heterogeneous group of slow-growing hormone-secreting neoplasms that can arise from different organ systems throughout the body, including the gastrointestinal and respiratory systems (1–4). Neuroendocrine tumors are categorized as carcinoid tumors and pancreatic neuroendocrine tumors. Carcinoid tumors arise from the enterochromaffin cells of the gastrointestinal tract and airways, and pancreatic neuroendocrine tumors arise from the islet cells of Langerhans. The overall age-adjusted incidence of carcinoids is about two to three cases per 100 000 per year (3,5) and that of pancreatic neuroendocrine tumors is one per 100 000 per year (6). According to the World Health Organization classification, gastroenteropancreatic neuroendocrine tumors have been classified as neuroendocrine neoplasm grade 1–2 and grade 3 neuroendocrine carcinoma, which includes small cell carcinoma and large cell neuroendocrine carcinoma (7). Roughly 46%–93% of patients with neuroendocrine tumors develop liver metastasis, which can involve large portions of liver with associated symptoms.
The presence of hepatic metastasis is the most important predictor of poor survival in patients with neuroendocrine tumor, with extent of liver metastasis correlating with subsequent survival (8–10). Treatment of patients with neuroendocrine liver metastasis (NELM) is still controversial and poses a substantial problem to medical and surgical oncologists. In a large cohort of 753 patients with NELM, Mayo et al (11) demonstrated asymptomatic patients with a large (>25%) burden of liver disease benefited least from surgical management and local-regional therapies may be a more appropriate treatment strategy. Liver-directed surgery for NELM is associated with prolonged survival (12); however, surgical resection benefits only 5%–15% of patients with hepatic NELM because most patients have multifocal disease and are not amenable to surgery. Somatostatin analogs have been shown to be effective in controlling symptoms, as well as improving progression-free survival (13), but the disease can become refractory to treatment. Cytotoxic systemic chemotherapy has limited effectiveness, particularly for patients with carcinoid tumors (14). Recently, however, two new agents, sunitinib, a multikinase inhibitor, and everolimus, a mammalian target of rapamycin inhibitor, have demonstrated improvement in progression-free survival (15). Intraarterial therapies (IATs) have also been shown to be promising treatment options in patients with NELM.
Current accepted guidelines for assessing treatment response in solid tumors include Response Evaluation Criteria in Solid Tumors (RECIST), which relies on anatomic imaging after treatment is complete (16,17). Anatomic tumor response metrics can be misleading when applied to molecular-targeted therapies or IATs that aim to achieve tumor necrosis and delay progression rather than induce a reduction in tumor size. The European Association for the Study of the Liver (EASL) proposed guidelines for measuring treatment response in patients with hepatocellular carcinoma; guidelines were based on reduction in the enhancing area of the tumor in the axial plane (18). More recently, modified RECIST (mRECIST) criteria based on reduction in the longest diameter of enhancing tumor in the axial plane were proposed (19).
There is a compelling need to develop noninvasive functional and metabolic imaging biomarkers capable of depicting early response to new therapeutic interventions. Diffusion-weighted imaging is a novel magnetic resonance (MR) imaging technique that provides insight about the tumor microenvironment by depicting molecular water distribution, thereby indicating the degree of tumor viability (20). Viable tumors have intact cell membranes limiting the mobility of water molecules that is reflected as low apparent diffusion coefficient (ADC). Increase in tumor necrosis results in increase in water permeability, as indicated by high ADC (21). On the other hand, contrast material–enhanced MR imaging may help quantify changes in neovascularity and angiogenesis. Reduction in the vascular supply to the tumor after treatment can delineate areas of necrotic tumor from viable tumor by absence of contrast enhancement (22). Previous studies have demonstrated significant increase in ADC and significant decrease in enhancement in all patients after IAT (20,23,24). In a prior study, it has been demonstrated that ADC could be used to differentiate responders from nonresponders after IAT for intrahepatic cholangiocarcinoma (25).
The purpose of this study was to determine if volumetric changes of diffusion-weighted and contrast-enhanced MR imaging can help assess early tumor response to IAT in NELM. We reported the outcome of a single-institution imaging analysis of unresectable NELM. We evaluated the role of volumetric diffusion-weighted and contrast-enhanced MR imaging, alone and in combination, in assessing early (3–4 weeks) treatment response to IAT, with overall survival as the primary end point.
Materials and Methods
This retrospective single-center comprehensive imaging analysis was approved by our institutional review board, with a waiver for informed patient consent. Our study was performed in compliance with the Health Insurance Portability and Accountability Act. This study was supported by Siemens Healthcare USA (Malvern, Pa) (access to proprietary software). Authors who did not receive salary support from Siemens Healthcare USA had control of the data.
Patient Population
A database of patients who underwent IAT for NELM from November 2005 to January 2011 at our institution was reviewed. The decision to undergo IAT and the type of IAT was determined by our multidisciplinary liver tumor board. Eighty-seven patients with NELM were treated during the period, and 71 patients were included and 16 were excluded in our study. Inclusion and exclusion criteria for our study are as described in Figure 1.
Figure 1:
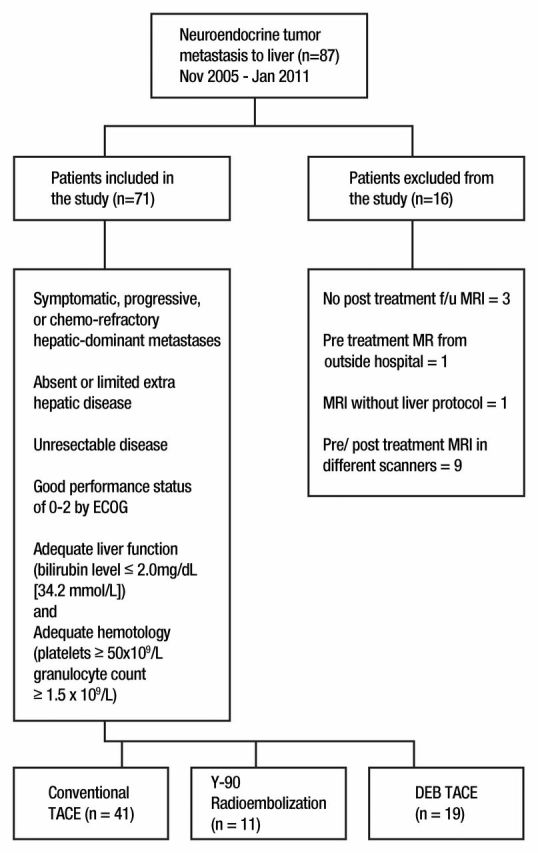
Chart shows inclusion and exclusion criteria. DEB = doxorubicin-eluting beads, ECOG = Eastern Cooperative Oncology Group, f/u = follow-up, TACE = transcatheter arterial chemoembolization, Y-90 = yttrium 90.
IAT Technique
IAT included chemoembolization (using cisplatin, doxorubicin, and mitomycin) and transcatheter arterial chemoembolization (using doxorubicin-eluting beads) performed according to our standard institution protocols (23,26). Radioembolization (using yttrium 90–embedded glass beads) was performed as previously described (24).
MR Imaging Technique
MR imaging was performed with a 1.5-T MR imager (Magnetom Avanto; Siemens, Erlangen, Germany) by using a phased-array torso coil. The protocol consisted of T2-weighted turbo spin-echo images (repetition time msec/echo time msec, 4500/92; matrix size, 256 × 256; section thickness, 8 mm; intersection gap, 2 mm; receiver bandwidth, 32 kHz) and breath-hold diffusion-weighted echo-planar images (3000/69; matrix, 128 × 128; section thickness, 8 mm; intersection gap, 2 mm; b value, 0 and 750 sec/mm2; receiver bandwidth, 64 kHz). Breath-hold unenhanced and contrast-enhanced (0.1 mmol intravenous gadopentetate per kilogram of body weight [Magnevist; Bayer, Wayne, NJ]) T1-weighted three-dimensional fat-suppressed spoiled gradient-echo images (5.77/2.77; field of view, 320–400 mm; matrix, 192 × 160; section thickness, 2.5 mm; receiver bandwidth, 64 kHz; flip angle, 10°) in the hepatic arterial phase (HAP) (20 seconds), portal venous phase (PVP) (70 seconds), and delayed phase (3 minutes) were also obtained.
MR Image Analysis
Index lesions in patients treated with IAT were analyzed by using proprietary software (MR Oncotreat), which was developed in collaboration with Siemens Medical Solutions USA. The largest lesion treated during the first session of IAT was selected as the representative lesion for the patient. In the first step, patient Digital Imaging and Communications in Medicine data (T2-weighted images, diffusion-weighted images, ADC maps, T1-weighted images: precontrast, HAP, and PVP images) were imported into the software. Next, tumor borders were defined with an interactive segmentation technique (27,28). Pretreatment and posttreatment (3–4 weeks after treatment) tumors were segmented separately, and for each study, the software automatically generated tumor diameter, volumetric ADC, and volumetric enhancement in the HAP and PVP. Volumetric enhancement was calculated from the formula [(A − P)/A] · 100 for arterial enhancement and [(V − P)/V] · 100 for venous enhancement, where A is arterial phase image, V is venous phase image, and P is precontrast image.
Percentage change in volumetric tumor ADC and volumetric enhancement at follow-up compared with baseline values was calculated by using the formula [(Tpost – Tpre)/Tpre] · 100, where Tpre is volumetric ADC or enhancement before treatment and Tpost is volumetric ADC or enhancement 3–4 weeks after treatment.
Each patient was classified as a responder or nonresponder according to RECIST, mRECIST, and EASL on the basis of pretreatment and 3–4-week posttreatment MR imaging results of the index lesion and also for up to two target lesions. Response categorization for EASL and mRECIST was based on arterial phase images (Table 1). Because no guidelines exist for volumetric ADC and enhancement, we selected cutoff values based on the highest log-likelihood in univariate Cox regression models for increase in ADC and decrease in enhancement to stratify patients as responders or nonresponders; cutoff values were 15% for volumetric ADC and 25% and 50% for volumetric enhancement in the HAP and PVP, respectively, which had the best hazard ratio. After the first follow-up, patients who had undergone MR imaging were followed up every 2–3 months until death. The primary end point of this study was overall survival, which was calculated from the date of the first IAT until death or until March 20, 2011. A total of 475 MR imaging studies were reviewed in this cohort.
Table 1.
Current Response Evaluation Criteria
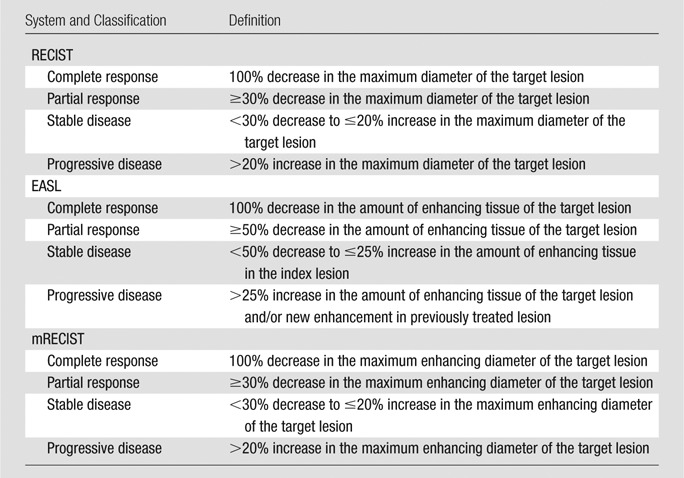
Note.—EASL criteria are based on recommendations from the conclusions of the Barcelona-2000 EASL conference. EASL is calculated by measuring the longest diameter of the enhancing tumor in the axial plane and by drawing a line perpendicular to it. mRECIST is calculated by measuring the longest diameter of the enhancing tumor in the axial plane.
Statistical Analysis
A paired Student t test was used to determine if changes in anatomic and functional MR imaging data after IAT were statistically significant. Optimal cutoffs were selected on the basis of the log-likelihood in univariate Cox regression models for increase in ADC and decrease in enhancement. Survival with corresponding two-sided 95% confidence intervals was analyzed by using the Kaplan-Meier method, and significance was analyzed by using the log-rank method. The Cox proportional hazards regression model was used to detect interactions between volumetric ADC and contrast-enhanced MR imaging and to calculate a hazard ratio. A P value less than .05 was considered to indicate a statistically significant difference. Statistical analysis was performed with a software package (SPSS, version 16.0; SPSS, Chicago Ill).
Results
Demographic Data
Table 2 shows the characteristics of patients included in the current study who were imaged between November 1, 2005 and March 20, 2011. Seventy-five percent of patients included (53 of 71) had clinical symptoms or evidence of disease progression from previous computed tomographic or MR images. A total of 163 IAT procedures (range, one to five) were performed, with a median of two IAT sessions. Limited extrahepatic disease was present in 20 of 71 (28%) patients. Median time from the date of the first IAT to first follow-up MR imaging was 25 days (range, 14–76 days). Median time from the date of pretreatment MR imaging to the first session of IAT was 11 days (range, 0–84 days), and median time from the date of pretreatment MR imaging to first posttreatment MR imaging was 36 days (range, 20–124 days).
Table 2.
Baseline Patient Characteristics
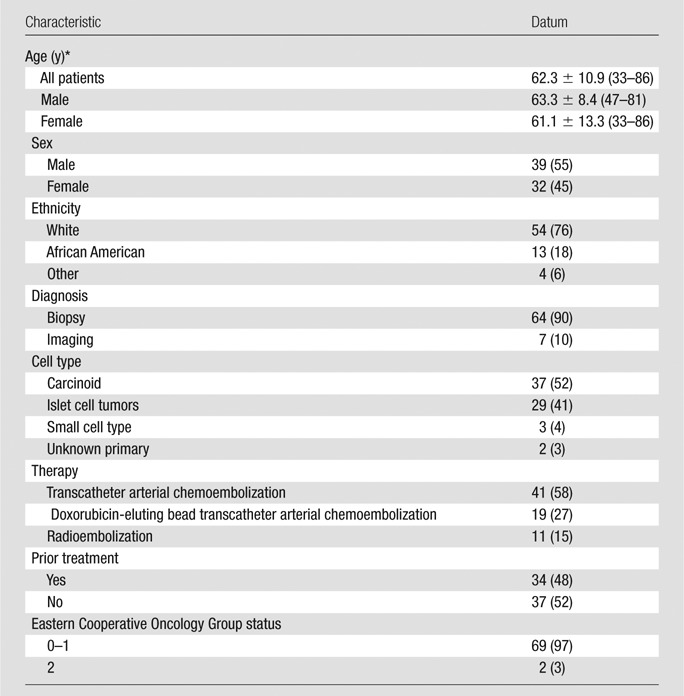
Note.—Unless otherwise indicated, data are numbers of patients, with percentages in parentheses.
Data are means ± standard deviations, with range in parentheses.
Survival
At the time of the last follow-up, 38 of 71 (54%) patients had died. Median survival of all patients was 29.6 months (95% confidence interval: 15.1 months, 44 months). One-year and 2-year survival for the entire cohort was 66.1% and 36.6%, respectively. Patients who were still alive at the time of last follow-up (March 20, 2011) were censored. Median follow-up time was 15.5 months (range, 1.5–58.7 months).
MR Imaging Findings
Table 3 summarizes the pretreatment and 3–4-week posttreatment changes in volumetric functional MR imaging changes, as well as conventional anatomic changes according to RECIST, mRECIST, and EASL of the index lesion after IAT. Even though there were significant changes in tumor size according to RECIST and enhancement according to EASL and mRECIST, their median percentage change did not fulfill the partial response according to respective criteria.
Table 3.
Changes in Volumetric Functional Metrics and Anatomic Metrics

Note.—Unless otherwise indicated, data are means ± standard deviations. There were significant changes in tumor size according to RECIST and enhancement according to EASL and mRECIST, but their median percentage change did not fulfill the partial response according to respective criteria.
P value indicates changes in pretreatment and 3–4-week posttreatment data analyzed by using a paired Student t test.
Table 4 summarizes percentage change in RECIST, mRECIST, and EASL of the index lesion and volumetric functional MR imaging in responders and nonresponders. There was significant decrease in tumor size according to RECIST and enhancement according to EASL and mRECIST in responders compared with nonresponders according to respective criteria. However, response according to RECIST, EASL, and mRECIST in the index lesion and up to two target lesions did not predict patient survival.
Table 4.
Percentage Changes in Volumetric Functional Metrics and Anatomic Metrics in Responders and Nonresponders according to Respective Criteria

Note.—Unless otherwise indicated, data are means ± standard deviations. For RECIST, EASL, and mRECIST, responders were those with complete response and partial response, and nonresponders were those with stable disease and progressive disease. There was significant decrease in tumor size according to RECIST and enhancement according to EASL and mRECIST in responders compared with nonresponders according to respective criteria. However, response according to RECIST, EASL, and mRECIST did not predict patient survival.
P value is obtained from independent-samples t test.
Anatomic Metrics 3–4 Weeks after IAT
RECIST.—The number of patients classified as responders (complete response and partial response) was five (7%) and that classified as nonresponders (stable disease and progressive disease) was 66 (93%) for the index lesion. The number of patients classified as responders (complete response and partial response) was three (4%) and that classified as nonresponders (stable disease and progressive disease) was 68 (96%) for up to two target lesions. There was no significant difference in survival in responders compared with nonresponders as assessed according to RECIST for the index lesion (log-rank test, P < .442) and up to two target lesions (log-rank test, P < .378) at 3–4 weeks after therapy (Fig E1 [online]).
EASL (3–4 weeks after IAT).—The number of patients classified as responders (complete response and partial response) was 32 (45%) and that classified as nonresponders (stable disease and progressive disease) was 39 (55%) for the index lesion. The number of patients classified as responders (complete response and partial response) was 26 (37%) and that classified as nonresponders (stable disease and progressive disease) was 45 (63%) for up to two target lesions. No significant difference in survival was noted in responders versus nonresponders according to EASL for the index lesion (log-rank test, P < .067) and up to two target lesions (log-rank test, P < .317) at 3–4 weeks after therapy (Fig E2 [online]).
mRECIST (3–4 weeks after IAT).—The number of patients classified as responders (complete response and partial response) was 20 (28%) and that classified as nonresponders (stable disease and progressive disease) was 51 (72%) for the index lesion. The number of patients classified as responders (complete response and partial response) was 18 (25%) and that classified as nonresponders (stable disease and progressive disease) was 53 (75%) for up to two target lesions. In addition, there was no significant difference in survival in responders versus nonresponders according to mRECIST for the index lesion (log-rank test, P < .362) and up to two target lesions (log-rank test, P < .926) 3–4 weeks after therapy (Fig E3 [online]).
Volumetric Functional Metrics 3–4 Weeks after IAT
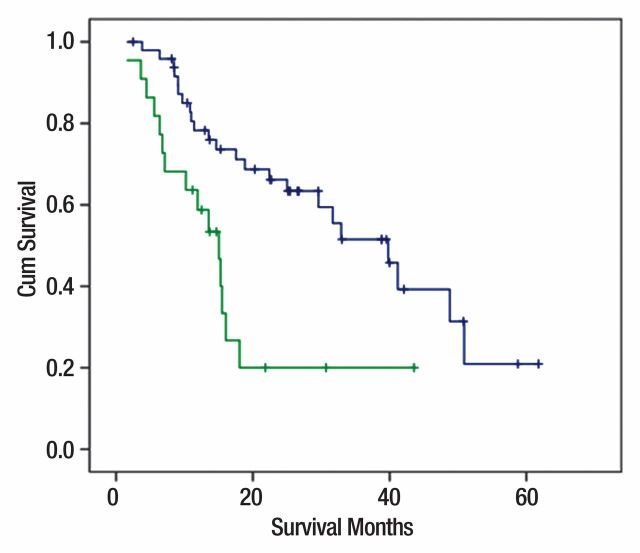
Volumetric ADC changes.—Patients who had 15% or greater increase in volumetric ADC (n = 49) had a better prognosis than patients who had either a decrease or a less than 15% increase in volumetric ADC (n = 22) (median overall survival: 40 vs 15 months, respectively; log-rank test, P < .002), with a hazard ratio of 2.8 (95% confidence interval: 1.42, 5.61) for nonresponders (Figs 2a, 3, A–G).
Figure 2a:
(a) Kaplan-Meier curves for changes in volumetric ADC in responders (n = 49; blue curve; ≥15% increase in ADC) and nonresponders (n = 22; green curve; decrease or <15% increase in ADC), with overall survival as primary end point. Median overall survival was 40 and 15 months for responders and nonresponders, respectively (log-rank test, P < .002). (b) Kaplan-Meier curves for changes in volumetric arterial enhancement in responders (n = 40; blue curve; ≥25% decrease in arterial enhancement) and nonresponders (n = 31; green curve; increase or <25% decrease in arterial enhancement), with overall survival as primary end point. Median overall survival was 40 and 16 months for responders and nonresponders, respectively (log-rank test, P < .02). (c) Kaplan-Meier curves for changes in volumetric venous enhancement in responders (n = 18; blue curve; ≥50% decrease in venous enhancement) and nonresponders (n = 53; green curve; increase or <50% decrease in venous enhancement), with overall survival as primary end point. Median overall survival was 49 and 18 months for responders and nonresponders, respectively (log-rank test, P < .02). Cum = cumulative.
Figure 3:
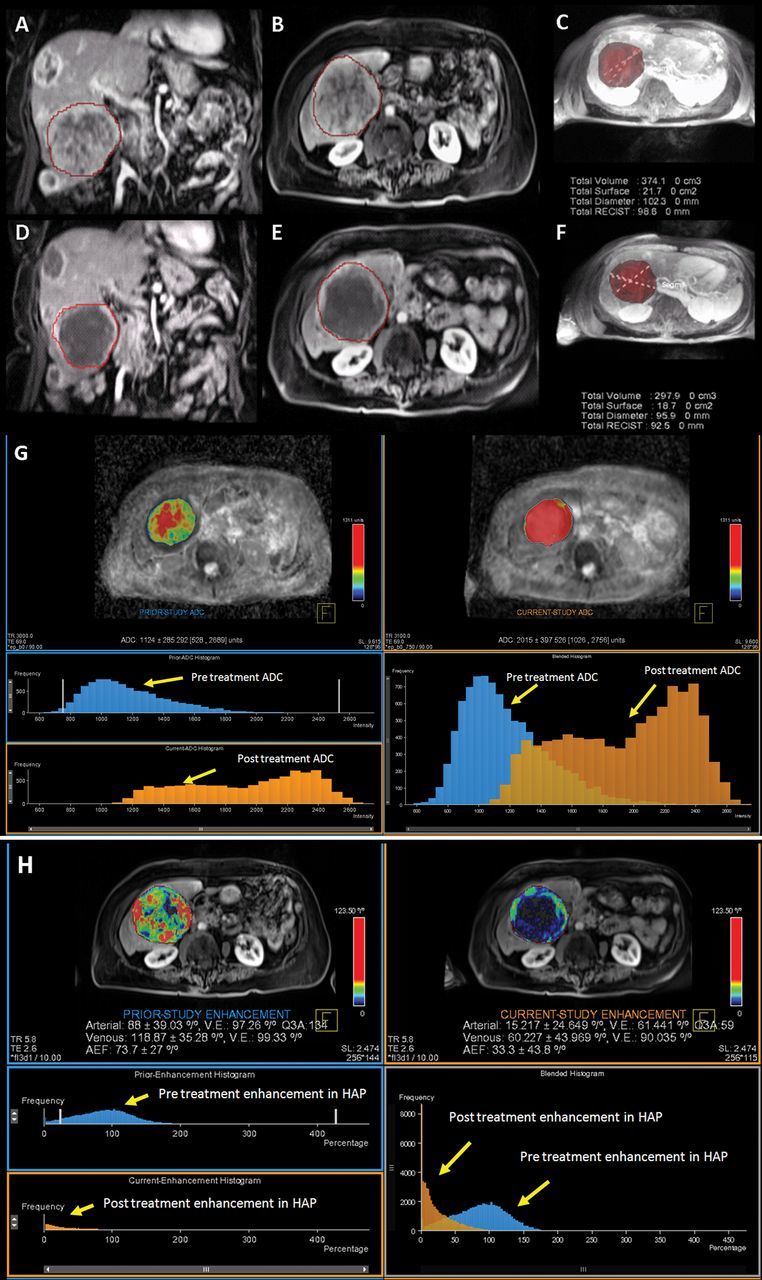
MR data in 80-year-old woman with NELM. A, B, Pretreatment MR images show arterial enhancing lesion in coronal and axial plane, respectively, with, C, segmented three-dimensional tumor. D, E, MR images show posttreatment tumor in coronal and axial plane, respectively, with, F, segmented three-dimensional tumor. RECIST diameter decreased from 9.8 to 9.2 cm, and there was decrease in tumor volume after treatment from 374 to 298 cm3. This case was classified as stable disease according to RECIST. G, Volumetric ADC map demonstrates increase in volumetric ADC from 1.12 to 2.01 × 10⁻³ mm2/sec with 79.46% increase in ADC as depicted in the histogram (blue = pretreatment data, orange = posttreatment data). There is rightward shift in the blended histogram, representing increasing ADC after treatment and indicating favorable response to therapy. H, Volumetric enhancement characteristics in the same patient described in A. Volumetric enhancement map in arterial phase shows arterial enhancement decreased from 88% to 15% as depicted in the histogram (blue = pretreatment data, orange = posttreatment data). There is leftward shift in the blended histogram, representing decreasing enhancement after treatment and indicating favorable response to therapy. Mean percentage change was 27% for the ADC, −25.3% for the HAP, and −22.4% for the PVP.
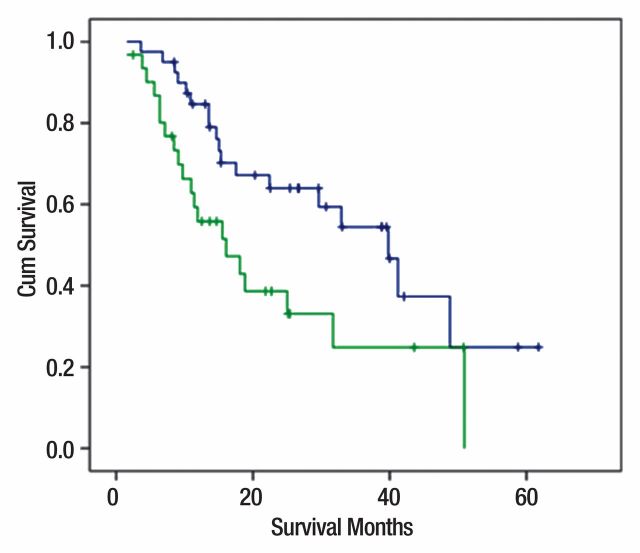
Volumetric arterial enhancement changes.—Patients who demonstrated 25% or greater decrease in volumetric enhancement during the HAP (n = 40) had an improved overall survival compared with patients who either had an increase or less than 25% decrease in volumetric arterial enhancement (n = 31) (median overall survival: 40 vs 16 months, respectively; log-rank test, P < .02), with a hazard ratio of 2.0 (95% confidence interval: 1.09, 3.95) for nonresponders (Figs 2b; 3, A–F, H).
Figure 2b:
(a) Kaplan-Meier curves for changes in volumetric ADC in responders (n = 49; blue curve; ≥15% increase in ADC) and nonresponders (n = 22; green curve; decrease or <15% increase in ADC), with overall survival as primary end point. Median overall survival was 40 and 15 months for responders and nonresponders, respectively (log-rank test, P < .002). (b) Kaplan-Meier curves for changes in volumetric arterial enhancement in responders (n = 40; blue curve; ≥25% decrease in arterial enhancement) and nonresponders (n = 31; green curve; increase or <25% decrease in arterial enhancement), with overall survival as primary end point. Median overall survival was 40 and 16 months for responders and nonresponders, respectively (log-rank test, P < .02). (c) Kaplan-Meier curves for changes in volumetric venous enhancement in responders (n = 18; blue curve; ≥50% decrease in venous enhancement) and nonresponders (n = 53; green curve; increase or <50% decrease in venous enhancement), with overall survival as primary end point. Median overall survival was 49 and 18 months for responders and nonresponders, respectively (log-rank test, P < .02). Cum = cumulative.
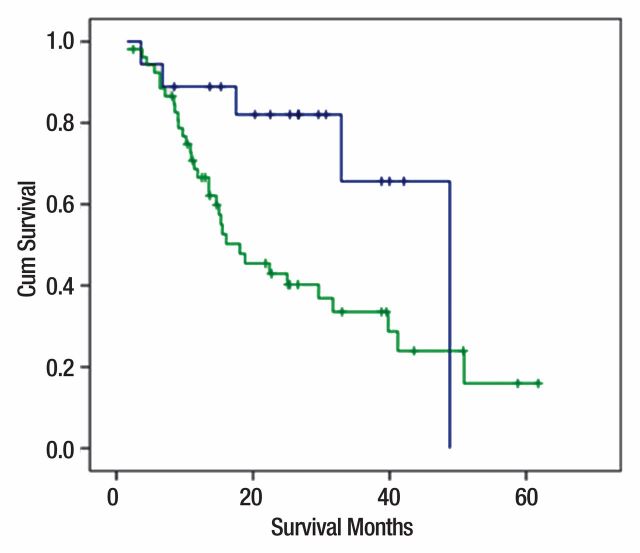
Volumetric venous enhancement changes.—Patients who demonstrated 50% or greater decrease in volumetric enhancement in the PVP (n = 18) had an improved overall survival compared with patients who either had an increase or less than 50% decrease in venous enhancement (n = 53) (median overall survival: 49 vs 18 months, respectively; log-rank test, P < .02), with a hazard ratio of 2.8 (95% confidence interval: 1.09, 7.23) for nonresponders (Fig 2c).
Figure 2c:
(a) Kaplan-Meier curves for changes in volumetric ADC in responders (n = 49; blue curve; ≥15% increase in ADC) and nonresponders (n = 22; green curve; decrease or <15% increase in ADC), with overall survival as primary end point. Median overall survival was 40 and 15 months for responders and nonresponders, respectively (log-rank test, P < .002). (b) Kaplan-Meier curves for changes in volumetric arterial enhancement in responders (n = 40; blue curve; ≥25% decrease in arterial enhancement) and nonresponders (n = 31; green curve; increase or <25% decrease in arterial enhancement), with overall survival as primary end point. Median overall survival was 40 and 16 months for responders and nonresponders, respectively (log-rank test, P < .02). (c) Kaplan-Meier curves for changes in volumetric venous enhancement in responders (n = 18; blue curve; ≥50% decrease in venous enhancement) and nonresponders (n = 53; green curve; increase or <50% decrease in venous enhancement), with overall survival as primary end point. Median overall survival was 49 and 18 months for responders and nonresponders, respectively (log-rank test, P < .02). Cum = cumulative.
Volumetric multiparametric MR imaging.—Multivariate Cox regression analysis demonstrated no interaction between volumetric ADC and volumetric enhancement during the HAP and PVP (P < .085 and < .165, respectively).
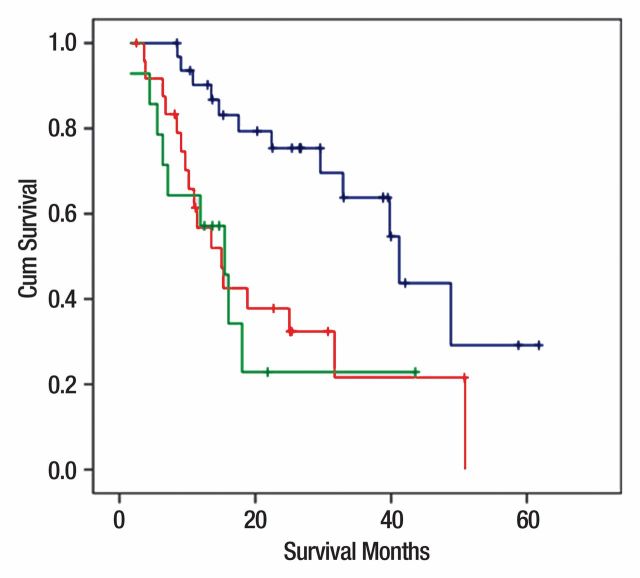
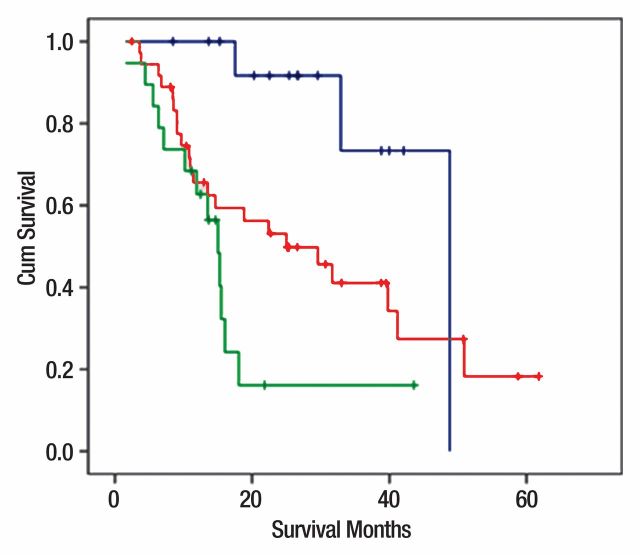
There was no prognostic benefit in combining ADC and enhancement for assessing treatment response. Patients who demonstrated both an increase in volumetric ADC and arterial enhancement had a similar median overall survival (41 months) compared with patients who demonstrated either an ADC response (40 months) or arterial enhancement response (40 months) alone. Similarly, patients who demonstrated both volumetric ADC response and volumetric venous enhancement response had a similar median overall survival (49 months) compared with those patients whose targeted lesions demonstrated only volumetric venous enhancement (49 months) (Fig 4).
Figure 4a:
(a) Kaplan-Meier curves by using multiparametric approach. Blue curve = responders with both ADC and arterial enhancement (ADC ≥ 15% and enhancement ≥ 25%). Median survival was 41 months. Green curve = nonresponders with both ADC and arterial enhancement (ADC < 15% and enhancement < 25%). Median survival was 15.5 months. Red curve = patients who demonstrated either ADC or arterial enhancement response (ADC ≥ 15% or enhancement ≥ 25%). Median survival was 15 months (log-rank test, P < .003). (b) Kaplan-Meier curves by using multiparametric approach. Blue curve = responders with both ADC and venous enhancement (ADC ≥ 15% and enhancement ≥ 50%). Median survival was 49 months. Green curve = nonresponders with both ADC and venous enhancement (ADC < 15% and enhancement < 25%). Median survival was 15 months. Red curve = patients who demonstrated either ADC or venous enhancement response (ADC ≥ 15% or enhancement ≥ 25%). Median survival was 25 months (log-rank test, P < .003). Cum = cumulative.
Figure 4b:
(a) Kaplan-Meier curves by using multiparametric approach. Blue curve = responders with both ADC and arterial enhancement (ADC ≥ 15% and enhancement ≥ 25%). Median survival was 41 months. Green curve = nonresponders with both ADC and arterial enhancement (ADC < 15% and enhancement < 25%). Median survival was 15.5 months. Red curve = patients who demonstrated either ADC or arterial enhancement response (ADC ≥ 15% or enhancement ≥ 25%). Median survival was 15 months (log-rank test, P < .003). (b) Kaplan-Meier curves by using multiparametric approach. Blue curve = responders with both ADC and venous enhancement (ADC ≥ 15% and enhancement ≥ 50%). Median survival was 49 months. Green curve = nonresponders with both ADC and venous enhancement (ADC < 15% and enhancement < 25%). Median survival was 15 months. Red curve = patients who demonstrated either ADC or venous enhancement response (ADC ≥ 15% or enhancement ≥ 25%). Median survival was 25 months (log-rank test, P < .003). Cum = cumulative.
Discussion
Quantitative volumetric multiparametric MR imaging can potentially be used as an imaging biomarker of early treatment response by stratifying patients as responders and nonresponders 3–4 weeks after intraarterial therapy. In our study, we used volumetric analysis of ADC and enhancement for assessing treatment response in patients with NELM treated by using IAT. Volumetric functional MR response criteria were better predictors of patient survival than current anatomic response criteria. Our data demonstrated significant increase in volumetric ADC and decrease in volumetric enhancement during the HAP and PVP early (3–4 weeks) after IAT. Patients who demonstrated 15% or greater volumetric increase in ADC had a better prognosis than patients who either had a decrease or less than 15% increase in volumetric ADC. Similarly, patients who demonstrated 25% or greater decrease in volumetric enhancement during the HAP or 50% or greater decrease during the PVP had a better prognosis than patients who either had an increase or less than 25% decrease in volumetric arterial enhancement or an increase or less than 50% decrease in venous enhancement. There were significant changes in tumor size according to RECIST and enhancement according to EASL and mRECIST, but their median percentage change did not fulfill the partial response according to respective criteria. Of note, none of the current response criteria including RECIST, mRECIST, and EASL were associated with a comparable survival outcome.
Assessing early response to therapy is of prime importance in patient treatment and could potentially improve prognosis (29,30). Changes in tumor size as determined with RECIST are the current accepted guidelines for assessing treatment response. However, these guidelines were proposed for assessing treatment response to cytotoxic therapies (17). In most instances, it can take a considerable amount of time for changes in tumor size to occur (31,32). The main aim of IATs is to induce cellular necrosis. When employing such therapies, tumor size frequently does not change considerably after therapy, making anatomic response criteria problematic to assess therapeutic efficacy (21,33). In our study, most patients (64 of 71 [90%]) were considered to have stable disease according to RECIST, although functional response rate was significantly higher with ADC and enhancement criteria. In addition, the use of RECIST guidelines to classify treatment response was not associated with prognosis or long-term outcome. EASL and mRECIST criteria were proposed to take into account the amount of cellular necrosis by using changes in arterial enhancement in the axial plane as a metric of response (18,19).
Diffusion-weighted imaging is a novel MR imaging technique that can help measure overall cellular integrity. ADC generated from diffusion-weighted images depicts thermally induced motion of water molecules (34). Diffusion-weighted imaging has been previously studied in tumor models for assessing treatment response (1,35,36) and has also been described in patients with primary central nervous system tumors (37). We found that patients with increase in volumetric ADC of 15% or greater had better prognosis than patients who demonstrated either a decrease or small changes in volumetric ADC after treatment. Consistent with these findings, results of Liapi et al (23) demonstrated a significant increase in ADC among a small group of patients with NELM treated with transcatheter arterial chemoembolization. Taken together, these data strongly suggest that an increase in ADC represents areas of tumor necrosis; in turn, patients who demonstrated an increase in volumetric ADC after treatment have a better prognosis than patients who do not have such changes. These results have important implications, because they indicated that areas of unchanged or decreased ADC represent areas of viable tumor and should potentially be targeted during subsequent IAT sessions.
Contrast-enhanced MR imaging has been used as a valuable metric for assessing treatment response. It has the ability to noninvasively characterize tumor neovascular growth because it can help distinguish viable from nonviable tumor by exploiting differences in contrast agent kinetics with extracellular contrast agents (38). This concept of contrast enhancement was used by EASL and mRECIST as a metric for assessing treatment response. Our results demonstrated, however, that EASL and mRECIST, which provide single or two-dimensional measurements in the axial plane, are inadequate. This discrepancy is probably because measurements in the axial plane take only one section and one plane into account. There was significant decrease in enhancement according to EASL and mRECIST in responders compared with nonresponders according to respective criteria. However, response according to EASL and mRECIST did not predict patient survival. Our data demonstrated that volumetric analysis of contrast-enhanced MR imaging during the arterial phase is superior perhaps in part because contrast-enhanced MR imaging takes into account the enhancement of the entire volume of the tumor, thereby assessing the “true” treatment effect.
Volumetric ADC and volumetric enhancement during the HAP and PVP were found to be independently predictive of prognosis with no significant interaction. Using either volumetric ADC or volumetric enhancement proved to be as effective as using the combination of these metrics for assessing response and prognosis. Volumetric ADC has an advantage over contrast-enhanced MR imaging in that it does not require gadolinium, which is potentially beneficial in patients with decreased glomerular filtration rate or impaired renal function.
There were several limitations to our study. We examined a heterogeneous cohort of patients who had been treated with various IATs. In addition, our study was a longitudinal observational study without a control arm. The main aim of our study was, however, to evaluate the association between imaging parameters, treatment response to IATs, and prognosis. Our study did not aim to examine the therapeutic efficacy of a particular IAT regimen. In addition, histopathologic confirmation of necrosis was not obtained. The cutoff values for defining tumor response were obtained for this retrospective data set, and they need to be tested on a prospectively acquired validation data set. Because Ki67 is considered an important prognostic factor of tumor proliferation, it would have been informative to correlate imaging parameters with this tumor proliferation marker. Because the study was retrospective in nature, obtaining histopathologic confirmation of necrosis was not feasible given that tissue was not routinely available and routine biopsy is not the standard of care. Our use of overall survival as the main outcome of interest, however, did allow for direct assessment of imaging parameters and prognosis. Future studies should correlate functional volumetric imaging response to biochemical response.
In conclusion, our findings suggest that volumetric functional analysis of diffusion-weighted and contrast-enhanced MR imaging may be used as a biomarker of tumor response in patients with NELM undergoing IAT. Conventional anatomic metrics including RECIST, mRECIST, and EASL in a single axial plane were not associated with long-term outcome. In contrast, volumetric measurement of diffusion-weighted imaging and enhancement more reliably assessed the entire volume of the tumor, leading to better assessment of tumor response and prediction of patient survival. Future prospective clinical trials should incorporate volumetric functional response metrics to assess the efficacy of therapies such as sunitinib and everolimus, as well as other emerging targeted agents.
Advances in Knowledge.
• Mean volumetric apparent diffusion coefficient (ADC) increased significantly by 27%, and mean volumetric enhancement decreased significantly by −25.3% during the hepatic arterial phase and by −22.4% during the portal venous phase 3–4 weeks after treatment.
• Patients who had 15% or greater volumetric ADC increase after therapy had better overall patient survival than those who had less than 15% increase in volumetric ADC.
• Patients who had 25% or greater decrease in volumetric arterial enhancement or 50% or greater decrease in venous enhancement had better overall patient survival than those who had less than 25% decrease in volumetric arterial enhancement or less than 50% decrease in venous enhancement.
Implication for Patient Care.
• Assessing early response to intraarterial therapies by using volumetric functional MR imaging can help predict overall patient survival and can help physicians decide on further treatment of patients with neuroendocrine liver metastasis.
Supplemental Figures
Acknowledgments
We thank Mehmet Akif Gulsun, PhD, Atilla Kiraly, PhD, and Li Pan, PhD, of Siemens Corporate Research, for their help and support with the MR Oncotreat software used for image processing.
Received March 13, 2012; revision requested April 9; revision received June 27; accepted July 20; final version accepted August 21.
Supported by Siemens Medical USA.
Disclosures of Conflicts of Interest: V.G.H. No relevant conflicts of interest to disclose. C.P.C. No relevant conflicts of interest to disclose. S.B. Financial activities related to the present article: institution receives grants from Siemens Medical. Financial activities not related to the present article: institution receives grants from Siemens Medical, Bayer Healthcare, and Bracco Diagnostics. Other relationships: none to disclose. Z.L. No relevant conflicts of interest to disclose. D.R. No relevant conflicts of interest to disclose. D.C. No relevant conflicts of interest to disclose. T.M.P. No relevant conflicts of interest to disclose. L.A.D. Financial activities related to the present article: none to disclose. Financial activities not related to the present article: author is board member for Personal Genome Diagnostics; consultant for Anaeropharma; provides expert testimony for MSKCCC, has patent with and receives royalties from Inostics; develops education presentations for CME course at JHH; and has stock in Inostics and Personal Genome Diagnostics; institution receives travel funds from Morphotek. Other relationships: none to disclose. N.B. No relevant conflicts of interest to disclose. J.E. No relevant conflicts of interest to disclose. J.F.G. Financial activities related to the present article: none to disclose. Financial activities not related to the present article: author is consultant for Biocompatibles, Bayer Healthcare, Guerbet, Nordion, Merit, Abbott, and Jennerex; institution has grants from Biocompatibles, Genentech, Bayer Healthcare, Philips Medical, Nordion, and CeloNova; author is founder and CEO of PreScience Labs. Other relationships: none to disclose. I.R.K. Financial activities related to the present article: institution receives grant from Siemens. Financial activities not related to the present article: institution receives grant from Siemens; institution has patent with Oncotreat. Other relationships: none to disclose.
Abbreviations:
- ADC
- apparent diffusion coefficient
- EASL
- European Association for the Study of the Liver
- HAP
- hepatic arterial phase
- IAT
- intraarterial therapy
- mRECIST
- modified RECIST
- NELM
- neuroendocrine liver metastasis
- PVP
- portal venous phase
- RECIST
- Response Evaluation Criteria in Solid Tumors
References
- 1.Shebani KO, Souba WW, Finkelstein DM, et al. Prognosis and survival in patients with gastrointestinal tract carcinoid tumors. Ann Surg 1999;229(6):815–821; discussion 822–823. [DOI] [PMC free article] [PubMed] [Google Scholar]
- 2.Norheim I, Oberg K, Theodorsson-Norheim E, et al. Malignant carcinoid tumors: an analysis of 103 patients with regard to tumor localization, hormone production, and survival. Ann Surg 1987;206(2):115–125. [DOI] [PMC free article] [PubMed] [Google Scholar]
- 3.Modlin IM, Sandor A. An analysis of 8305 cases of carcinoid tumors. Cancer 1997;79(4):813–829. [DOI] [PubMed] [Google Scholar]
- 4.Kulke MH, Mayer RJ. Carcinoid tumors. N Engl J Med 1999;340(11):858–868. [DOI] [PubMed] [Google Scholar]
- 5.Oberg K. Diagnosis and treatment of carcinoid tumors. Expert Rev Anticancer Ther 2003;3(6):863–877. [DOI] [PubMed] [Google Scholar]
- 6.Oberg K, Eriksson B. Endocrine tumours of the pancreas. Best Pract Res Clin Gastroenterol 2005;19(5):753–781. [DOI] [PubMed] [Google Scholar]
- 7.Klimstra DS, Modlin IR, Coppola D, Lloyd RV, Suster S. The pathologic classification of neuroendocrine tumors: a review of nomenclature, grading, and staging systems. Pancreas 2010;39(6):707–712. [DOI] [PubMed] [Google Scholar]
- 8.Cadiot G, Vuagnat A, Doukhan I, et al. Prognostic factors in patients with Zollinger-Ellison syndrome and multiple endocrine neoplasia type 1. Groupe d’Etude des Néoplasies Endocriniennes Multiples (GENEM and groupe de Recherche et d’Etude du Syndrome de Zollinger-Ellison (GRESZE). Gastroenterology 1999;116(2):286–293. [DOI] [PubMed] [Google Scholar]
- 9.Norton JA, Jensen RT. Resolved and unresolved controversies in the surgical management of patients with Zollinger-Ellison syndrome. Ann Surg 2004;240(5):757–773. [DOI] [PMC free article] [PubMed] [Google Scholar]
- 10.Norton JA, Jensen RT. Current surgical management of Zollinger-Ellison syndrome (ZES) in patients without multiple endocrine neoplasia-type 1 (MEN1). Surg Oncol 2003;12(2):145–151. [DOI] [PubMed] [Google Scholar]
- 11.Mayo SC, de Jong MC, Bloomston M, et al. Surgery versus intra-arterial therapy for neuroendocrine liver metastasis: a multicenter international analysis. Ann Surg Oncol 2011;18(13):3657–3665. [DOI] [PubMed] [Google Scholar]
- 12.Mayo SC, de Jong MC, Pulitano C, et al. Surgical management of hepatic neuroendocrine tumor metastasis: results from an international multi-institutional analysis. Ann Surg Oncol 2010;17(12):3129–3136. [DOI] [PubMed] [Google Scholar]
- 13.Rinke A, Müller HH, Schade-Brittinger C, et al. Placebo-controlled, double-blind, prospective, randomized study on the effect of octreotide LAR in the control of tumor growth in patients with metastatic neuroendocrine midgut tumors: a report from the PROMID Study Group. J Clin Oncol 2009;27(28):4656–4663. [DOI] [PubMed] [Google Scholar]
- 14.Madoff DC, Gupta S, Ahrar K, Murthy R, Yao JC. Update on the management of neuroendocrine hepatic metastases. J Vasc Interv Radiol 2006;17(8):1235–1249; quiz 1250. [DOI] [PubMed] [Google Scholar]
- 15.Oberstein PE, Saif MW. Novel agents in the treatment of unresectable neuroendocrine tumors. Highlights from the “2011 ASCO Annual Meeting”. Chicago, IL, USA; June 3-7, 2011. JOP 2011;12(4):358–361. [PubMed] [Google Scholar]
- 16.Miller AB, Hoogstraten B, Staquet M, Winkler A. Reporting results of cancer treatment. Cancer 1981;47(1):207–214. [DOI] [PubMed] [Google Scholar]
- 17.Therasse P, Arbuck SG, Eisenhauer EA, et al. New guidelines to evaluate the response to treatment in solid tumors. European Organization for Research and Treatment of Cancer, National Cancer Institute of the United States, National Cancer Institute of Canada. J Natl Cancer Inst 2000;92(3):205–216. [DOI] [PubMed] [Google Scholar]
- 18.Bruix J, Sherman M, Llovet JM, et al. Clinical management of hepatocellular carcinoma: conclusions of the Barcelona-2000 EASL conference. European Association for the Study of the Liver. J Hepatol 2001;35(3):421–430. [DOI] [PubMed] [Google Scholar]
- 19.Lencioni R, Llovet JM. Modified RECIST (mRECIST) assessment for hepatocellular carcinoma. Semin Liver Dis 2010;30(1):52–60. [DOI] [PMC free article] [PubMed] [Google Scholar]
- 20.Kamel IR, Bluemke DA, Eng J, et al. The role of functional MR imaging in the assessment of tumor response after chemoembolization in patients with hepatocellular carcinoma. J Vasc Interv Radiol 2006;17(3):505–512. [DOI] [PubMed] [Google Scholar]
- 21.Kamel IR, Bluemke DA. Magnetic resonance imaging of the liver: assessing response to treatment. Top Magn Reson Imaging 2002;13(3):191–200. [DOI] [PubMed] [Google Scholar]
- 22.Bruix J, Sherman M; Practice Guidelines Committee, American Association for the Study of Liver Diseases. Management of hepatocellular carcinoma. Hepatology 2005;42(5):1208–1236. [DOI] [PubMed] [Google Scholar]
- 23.Liapi E, Geschwind JF, Vossen JA, et al. Functional MRI evaluation of tumor response in patients with neuroendocrine hepatic metastasis treated with transcatheter arterial chemoembolization. AJR Am J Roentgenol 2008;190(1):67–73. [DOI] [PubMed] [Google Scholar]
- 24.Kamel IR, Reyes DK, Liapi E, Bluemke DA, Geschwind JF. Functional MR imaging assessment of tumor response after 90Y microsphere treatment in patients with unresectable hepatocellular carcinoma. J Vasc Interv Radiol 2007;18(1 Pt 1):49–56. [DOI] [PubMed] [Google Scholar]
- 25.Halappa VG, Bonekamp S, Corona-Villalobos CP, et al. Intrahepatic cholangiocarcinoma treated with local-regional therapy: quantitative volumetric apparent diffusion coefficient maps for assessment of tumor response. Radiology 2012;264(1):285–294. [DOI] [PubMed] [Google Scholar]
- 26.Geschwind JF, Ramsey DE, Cleffken B, et al. Transcatheter arterial chemoembolization of liver tumors: effects of embolization protocol on injectable volume of chemotherapy and subsequent arterial patency. Cardiovasc Intervent Radiol 2003;26(2):111–117. [DOI] [PubMed] [Google Scholar]
- 27.Grady L. Random walks for image segmentation. IEEE Trans Pattern Anal Mach Intell 2006;28(11):1768–1783. [DOI] [PubMed] [Google Scholar]
- 28.Gulsun MA, Weiss CR, Strecker R, Meredith G, Kamel IR. A new tool for volumetric and functional analysis of hepatic tumors monitored with multi-modal MRI [abstr]. In: Proceedings of the Seventeenth Meeting of the International Society for Magnetic Resonance in Medicine. Berkeley, Calif: International Society for Magnetic Resonance in Medicine, 2009; 2876. [Google Scholar]
- 29.Ross BD, Moffat BA, Lawrence TS, et al. Evaluation of cancer therapy using diffusion magnetic resonance imaging. Mol Cancer Ther 2003;2(6):581–587. [PubMed] [Google Scholar]
- 30.Kamel IR, Liapi E, Reyes DK, Zahurak M, Bluemke DA, Geschwind JF. Unresectable hepatocellular carcinoma: serial early vascular and cellular changes after transarterial chemoembolization as detected with MR imaging. Radiology 2009;250(2):466–473. [DOI] [PMC free article] [PubMed] [Google Scholar]
- 31.Riaz A, Lewandowski RJ, Kulik L, et al. Radiologic-pathologic correlation of hepatocellular carcinoma treated with chemoembolization. Cardiovasc Intervent Radiol 2010;33(6):1143–1152. [DOI] [PMC free article] [PubMed] [Google Scholar]
- 32.Riaz A, Kulik L, Lewandowski RJ, et al. Radiologic-pathologic correlation of hepatocellular carcinoma treated with internal radiation using yttrium-90 microspheres. Hepatology 2009;49(4):1185–1193. [DOI] [PubMed] [Google Scholar]
- 33.Assumpcao L, Choti M, Pawlik TM, Gecshwind JF, Kamel IR. Functional MR imaging as a new paradigm for image guidance. Abdom Imaging 2009;34(6):675–685. [DOI] [PubMed] [Google Scholar]
- 34.Law M, Yang S, Wang H, et al. Glioma grading: sensitivity, specificity, and predictive values of perfusion MR imaging and proton MR spectroscopic imaging compared with conventional MR imaging. AJNR Am J Neuroradiol 2003;24(10):1989–1998. [PMC free article] [PubMed] [Google Scholar]
- 35.Ducreux M, Baudin E, Schlumberger M. Treatment strategy of neuroendocrine tumors [in French]. Rev Prat 2002;52(3):290–296. [PubMed] [Google Scholar]
- 36.Zhao M, Pipe JG, Bonnett J, Evelhoch JL. Early detection of treatment response by diffusion-weighted 1H-NMR spectroscopy in a murine tumour in vivo. Br J Cancer 1996;73(1):61–64. [DOI] [PMC free article] [PubMed] [Google Scholar]
- 37.Chenevert TL, Stegman LD, Taylor JM, et al. Diffusion magnetic resonance imaging: an early surrogate marker of therapeutic efficacy in brain tumors. J Natl Cancer Inst 2000;92(24):2029–2036. [DOI] [PubMed] [Google Scholar]
- 38.Padhani AR, Leach MO. Antivascular cancer treatments: functional assessments by dynamic contrast-enhanced magnetic resonance imaging. Abdom Imaging 2005;30(3):324–341. [DOI] [PubMed] [Google Scholar]
Associated Data
This section collects any data citations, data availability statements, or supplementary materials included in this article.


