Abstract
One of the reasons the visual cortex has attracted the interest of computational neuroscience is that it has well-defined inputs. The lateral geniculate nucleus (LGN) of the thalamus is the source of visual signals to the primary visual cortex (V1). Most large-scale cortical network models approximate the spike trains of LGN neurons as simple Poisson point processes. However, many studies have shown that neurons in the early visual pathway are capable of spiking with high temporal precision and their discharges are not Poisson-like. To gain an understanding of how response variability in the LGN influences the behavior of V1, we study response properties of model V1 neurons that receive purely feedforward inputs from LGN cells modeled either as noisy leaky integrate-and-fire (NLIF) neurons or as inhomogeneous Poisson processes. We first demonstrate that the NLIF model is capable of reproducing many experimentally observed statistical properties of LGN neurons. Then we show that a V1 model in which the LGN input to a V1 neuron is modeled as a group of NLIF neurons produces higher orientation selectivity than the one with Poisson LGN input. The second result implies that statistical characteristics of LGN spike trains are important for V1's function. We conclude that physiologically motivated models of V1 need to include more realistic LGN spike trains that are less noisy than inhomogeneous Poisson processes.
Keywords: Integrate-and-fire, Lateral geniculate nucleus, Neural noise, Orientation selectivity, Poisson processes, Primary visual cortex
1 Introduction
Visual signals are transmitted from the retina through neurons in the lateral geniculate nucleus (LGN) of the thalamus to the primary visual cortex (V1). Even though LGN afferents constitute only a small fraction of the synapses onto V1 neurons, they strongly drive responses in V1 and are the primary source of visual inputs to the cortex (White 1989; Braitenberg and Schüz 1991; Peters et al. 1994). One of the reasons the visual cortex has attracted the interest of computational neuroscience is that the visual input to the cortex is so well-defined.
Finding out how the LGN processes visual information and determining what is the nature of the LGN's intricate circuitry have garnered great interest for decades (Kaplan and Shapley 1982; Derrington and Lennie 1984; Blakemore and Vital-Durand 1986; Irvin et al. 1993; Carandini et al. 2005; Sherman 2005; Casti et al. 2008; Sincich et al. 2009, among others). Yet it remains a challenge to characterize by computational modeling what is important for visual function in the LGN input to V1. To describe all known ion channels and synaptic inputs of an LGN neuron is computationally demanding; the accompanying dynamics may prove too difficult to simulate and/or interpret. Consequently, researchers have spent considerable efforts to find a minimal model of LGN cells (and the network that drives them) that can realize details of their dynamics.
Most large-scale models of cortical networks treat the LGN spike trains as inhomogeneous Poisson processes. The Poisson rate is calculated by convolving the visual stimulus with a linear, spatio-temporal filter (Somers et al. 1995; Troyer et al. 1998; McLaughlin et al. 2000; Wielaard et al. 2001; Seriès et al. 2004; Tao et al. 2004; Zhu et al. 2009, 2010) that is supposed to represent the action of the retinal and LGN neuronal networks. Poisson processes may be a reasonable approximation for neurons in the cortex (see Shadlen and Newsome 1998; Miura et al. 2007; Maimon and Assad 2009, for example). However, studies of both awake and anesthetized animals have demonstrated that neurons in the retina and LGN generate spike trains in which the trial-to-trial variability is lower than predicted from a simple Poisson process (Berry et al. 1997; Reich et al. 1997, 1998; Kara et al. 2000; Andolina et al. 2007; Victor et al. 2007; Alitto et al. 2011). It is therefore important to describe the LGN with a model that allows neurons to spike with higher temporal precision without completely losing stochastic variability in their responses.
Many attempts have been made to improve upon the Poisson model. The integrate-and-fire model (Knight 1972) provides a more realistic alternative; recent studies have suggested that it can capture some of the important statistical characteristics of the spike trains produced by real retinal ganglion cells and LGN neurons (Reich et al. 1997, 1998; Keat et al. 2001; Casti et al. 2008). Unlike the Poisson process which is purely stochastic, the dynamics of the integrate-and-fire model is a deterministic function of the input stimulus. In the absence of ‘noisy’ drives, a leaky integrate-and-fire model phase locks to the stimulus (Knight 1972). By adding noise to the membrane potential, one can ensure that the model neuron does not respond identically to repeated presentations of the same stimulus. We refer to such a Noisy-Leaky-Integrate-and-Fire model as NLIF. In this study we investigate whether an improvement in modeling the spike-firing statistics of LGN neurons by using the NLIF model has an influence on the calculated visual response properties of neurons in V1.
Neurons in V1 are capable of discriminating different orientations, spatial frequencies, and colors, characteristics that are important in recognizing visual patterns. Orientation selectivity, in particular, is one of the most thoroughly investigated functional properties in V1. V1 neurons are more sharply tuned to stimulus orientation than LGN neurons, which respond well to all orientations. The conventional way of explaining this increase in cortical selectivity involves convergence of LGN inputs, i.e., the feedforward picture (Hubel and Wiesel 1962; De Valois and De Valois 1990; Reid and Alonso 1995). Theoretical and experimental work, however, points also to the importance of intra-cortical inhibition (Somers et al. 1995; Sompolinsky and Shapley 1997; Troyer et al. 1998; McLaughlin et al. 2000; Xing et al. 2005, 2011; Zhu et al. 2010). Since the LGN plays a non-negligible role in determining cortical spatial selectivity, adopting an LGN model that fires with higher temporal precision (and that cannot be characterized by firing rates alone) could have a significant impact on V1's functional properties. To address this, we investigate how a V1 cell's responses to stimuli of different orientations differ when its LGN afferents are modeled by the NLIF formalism instead of a Poisson process as in earlier models.
In this paper, we first show that with appropriate parameters, the NLIF model can provide a reasonable functional description of LGN neurons. The parameters are constrained by experimental data on LGN neurons of anesthetized cats. With a physiologically realistic LGN model in hand, we then build the simplest feedforward model of a cortical neuron whose sole input is the sum of two LGN spike trains. We show that model V1 neurons whose LGN afferents are modeled by the NLIF formalism exhibit higher orientation selectivity than neurons with Poisson LGN input. Therefore, capturing the spike-firing statistics of the LGN input to the cortex is important for understanding the causes of cortical orientation selectivity. More realistic large-scale models of the cortex can be built using NLIF inputs from the LGN.
2 Methods
To model the dynamics of an LGN neuron, we use a noisy variation of the leaky integrate-and-fire model (henceforth referred to as NLIF),
| (1) |
τ is the time constant of the leak (sec); I(t) is the stimulus applied (sec−1). N(t) is comprised of Poisson-distributed noise shots (sec−1) of steady rate (1 kHz), uniform size, and random polarity, and is added at every time step. This additive, stimulus-independent noise represents background synaptic activity. A spike is fired when the membrane potential, v, reaches the threshold, vthres (Reich et al. 1998).
Each V1 neuron's spike-firing, on the other hand, is governed by a standard integrate-and-fire equation (Eq. (2)) where the LGN synaptic input, glgn, drives the V1 membrane potential, V, towards the normalized spike-firing threshold, Vth = 1.
| (2) |
In this equation, the cortical cell's membrane capacitance is assumed constant and absorbed into the conductance, so that the unit of conductance is sec−1. The leakage conductance, gL, the resting potential, VL, and the reversal potential of the excitatory synaptic current, VE, are set to the values of 50, 0, and 14/3, respectively. A refractory period is not implemented.
The LGN excitatory conductance, glgn, is simply the sum of LGN spike trains filtered through the LGN–V1 synapse.
| (3) |
τσ = 1 ms, and H(t) is the Heaviside function. The sequence denotes the spike time of the kth LGN cell during stimulus presentations. cE is the LGN–V1 coupling coefficient, and we test several values of cE between 0.15 and 0.25 to pick one that gives V1 cells physiologically reasonable firing rates. (Since our much reduced V1 model receives input from only two LGN cells, we have to adopt higher values of cE.)
To solve Eqs. (1) and (2) numerically, we use a modified second order Runge–Kutta time-stepping method (Shelley and Tao 2001); the time step is fixed at 0.1 ms.
2.1 Visual stimuli
Two types of visual stimuli are used to drive the LGN cells in the model: (1) a constant input, I(t) I0; (2) a sinusoidally modulated current, I(t) = I0[1 + ε cos(2π ft φ)] where f is the temporal frequency (Hz), φ is the phase (radians), I0 is the mean luminance, and ε ∈ [0, 1] is the stimulus contrast.
2.2 Individual LGN neurons—NLIF model fitting
We scan the possible parameter space of the NLIF model at τ = 10, 15, and 20 ms by varying the noise shot size and the spike-firing threshold, vthres. In addition to the cycle-averaged mean firing rate, we characterize the behavior of LGN neurons with two statistical measures: the coefficient of variation (CV) and the Fano factor. We exclude cells that fire less than 2 impulses per second (ips) from these two statistical analyses.
The CV is computed from the interspike interval (ISI) distribution of the maintained discharge; CV = standard deviation of ISI / mean ISI. Spikes are collected from one 200 s run using a constant input, I0 = 100, as the visual stimulus.
Spike count variability across trials is often described by the Fano factor; Fano factor = variance of spike count/mean spike count. A sinusoidally modulated stimulus at 50% contrast (I0 = 100, ε = 0.5, φ = π, and f = 4) is applied. Stimulus-evoked spikes are collected over one thousand 1 s runs; the first stimulus cycle of each run is treated as the equilibration period and excluded from the analysis. For Fig. 3, the Fano factor is calculated using a bin size of 250 ms (one stimulus cycle). When analyzing the Fano factor as a function of time (Fig. 5(b)), we count the number of spikes in a sliding 50-ms window, evaluated at time t separated by 10 ms.
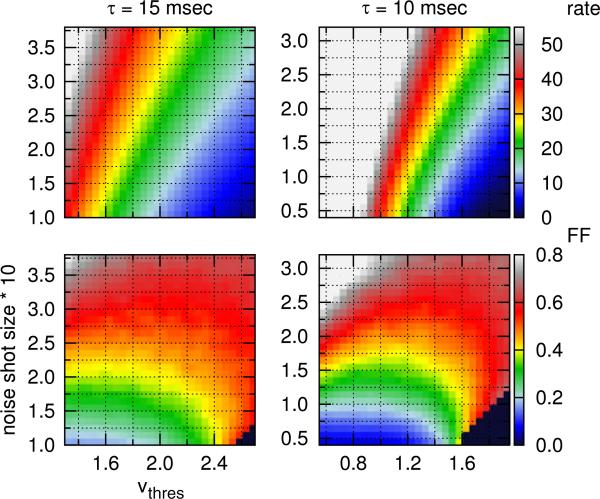
Fig. 3.
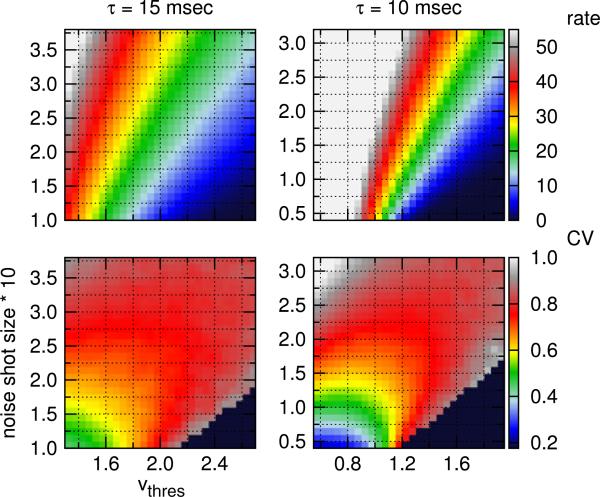
(Top) Mean rate in ips and (Bottom) Fano factor (FF) in the visually-driven discharge of an LGN neuron, described by the NLIF equation. Neurons are driven by a sinusoidally modulated stimulus at 50% contrast. Cells that fire less than 2 ips are excluded from the FF analysis (black region)
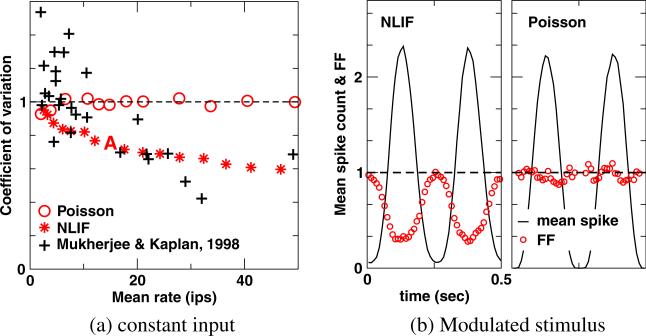
Fig. 5.
Inverse relationships between (a) the mean rate and CV in the LGN maintained discharge and between (b) the mean spike count and Fano factor (FF) in the visually-driven discharge of a LGN neuron at 50% contrast. Each point in (b) plots the mean spike count and FF in a 50 ms window versus the time of the center of that counting window
To compare with the NLIF model, we also create LGN spike trains using inhomogeneous Poisson processes. Poisson rates as a function of time are determined from peri-stimulus histograms (PSTHs) of the corresponding NLIF model.
2.3 Cortical neurons
To study how variability in the thalamic input affects cortical selectivity, we investigate the simplest scenario: a V1 neuron receiving feedforward inputs from two LGN neurons with a phase difference that depends on the stimulus orientation. The thalamic input is the sum of the responses of two LGN neurons filtered through the synapse (Eq. (3)).
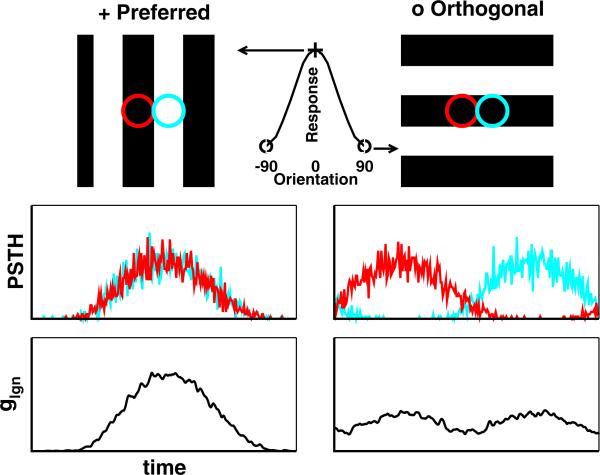
The basic layout of this model is depicted in Fig. 1, and we show only the cases of the preferred and orthogonal-to-preferred orientations. The bottom panels of Fig. 1 show the excitatory feedforward conductance glgn which is the sum of the excitatory conductances produced by the two LGN cells. Note that the ON- and OFF-center LGN cells are excited simultaneously at the preferred orientation and combine to produce a large conductance change (bottom left panel). The ON- and OFF-center LGN inputs respond out of phase to a stimulus at the orthogonal-to-preferred orientation. The resultant excitatory conductance is much smaller—as seen in the figure (bottom right panel). At intermediate orientations, glgn change gradually between those of the preferred and the orthogonal-to-preferred. The actual dependence of the different response measures on orientation will be shown later in Fig. 9. The NLIF model of LGN neurons for this cortical simulation uses parameters for the LGN time constant, threshold, and noise shot size that fit experimental LGN data the best, as discussed in Section 3.1.
Fig. 1.
A feedforward model of a V1 cell. (Top) Receptive fields and (Middle) PSTHs of the ON- (red) and OFF-center (cyan) LGN afferents. (Bottom) The summed LGN synaptic input to the V1 cell, glgn
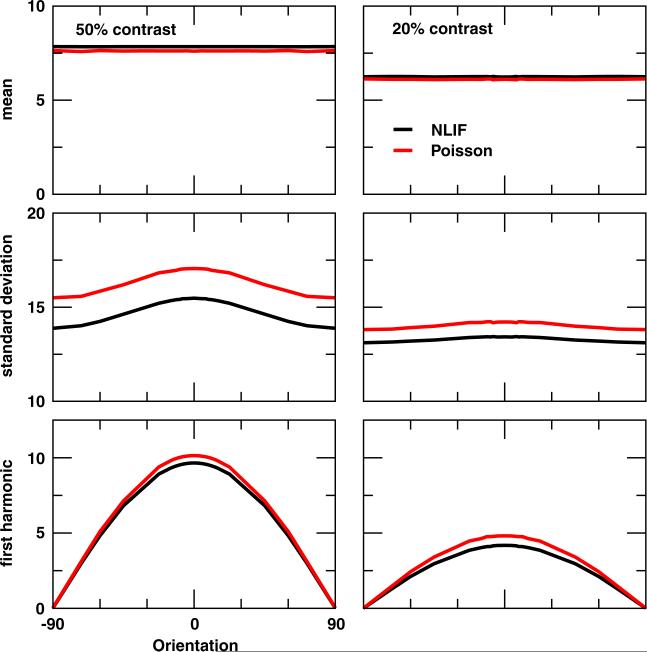
Fig. 9.
Orientation tuning curves of the LGN synaptic input glgn to a V1 cell at 50% and 20% contrasts for cE = 0.20. (Top) Mean glgn averaged across time and trials and (Middle) the corresponding standard deviation. (Bottom) First harmonic of the trial-averaged glgn
Orientation tuning curves are constructed from cortical responses (mean firing rates) to drifting gratings (I0 = 100 and f = 4) of several orientations at several contrast levels. Five thousand 2 s runs are carried out; data from the initial 1 s (equilibration period) of each run are discarded.
The orthogonal-to-preferred ratio (O/P ratio) is then defined as the ratio between mean rates (spontaneous activity subtracted) of a V1 cell in response to the orthogonal-to-preferred and preferred orientations; O/P ratio=(meanortho − meanspon)/(meanprefer − meanspon). The closer the O/P ratio is to one, the less ‘selective’ a neuron is.
Another common measure for orientation selectivity is the bandwidth of orientation tuning, and it can be estimated by fitting individual orientation tuning curves to Gaussian distributions,
| (4) |
A is the amplitude, x the orientation, μ the preferred orientation, σ the standard deviation, and R0 the baseline. The bandwidth is then estimated as half-width at half-height (= 1.17σ).
Variability of cortical responses is characterized by the Fano factor. For Fig. 10, we count the number of spikes in a sliding 50 ms window, and the Fano factor in Fig. 11 is calculated using a bin size of 250 ms.
Fig. 10.
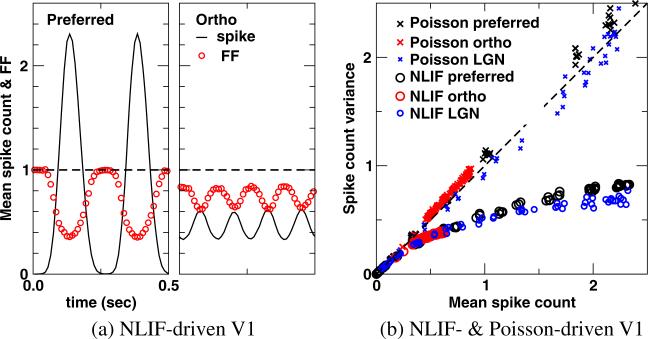
(a) The inverse relationship between the mean spike count and Fano factor (FF) and (b) the spike count variance versus the mean spike count in the stimulus-driven discharge of a V1 neuron at 50% contrast for cE = 0.20. Each point represents the value in a given 50 ms counting window
Fig. 11.
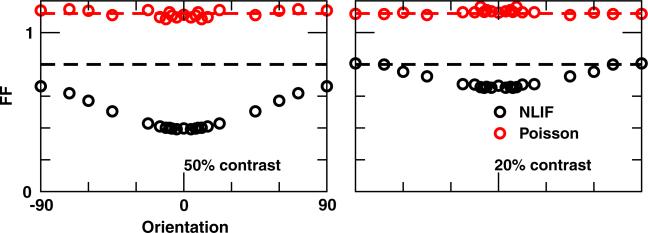
Fano factor (FF) in the stimulus-driven discharge of a V1 neuron as a function of stimulus orientations at 50% and 20% contrasts for cE = 0.20. FF of spontaneous activities are marked by dashed lines. Spikes are counted in 250 ms windows
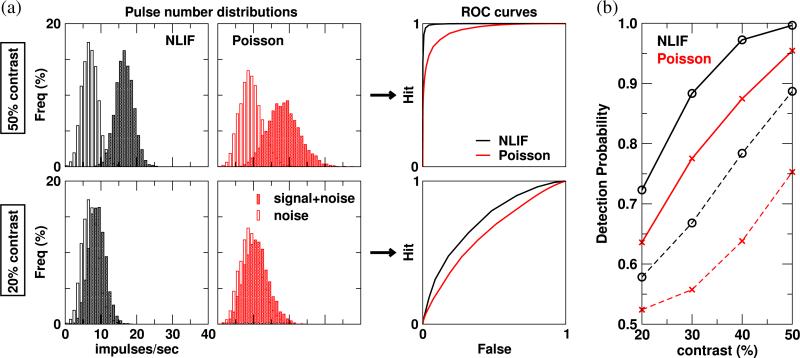
We also apply signal detection theory (Green and Swets 1966) to our cortical data. Receiver operator characteristic (ROC) curves are generated from the pulse number distributions (PNDs), distributions of the firing rate of the neuron for repeated presentations of identical stimuli. The ‘noise’ distribution refers to spontaneous activity, and the ‘signal+noise’ distributions are those collected with stimuli of the preferred orientation at a series of contrasts. Each point on the ROC curve represents a criterion firing rate. The ‘false alarm’ probability is the percentage of ‘noise’ trials greater than or equal to the criterion, and the ‘hit’ probability is the percentage of ‘signal+noise’ trials greater than or equal to the criterion. Integrating under the ROC curve then gives us the detection probability. (More details on ROC analysis can be found in e.g. Edwards et al. (1995).)
3 Results
3.1 Individual LGN neurons—NLIF model fitting
We first explore how an LGN neuron's responses to visual stimuli depend on the parameters of the NLIF model, i.e., the membrane time constant τ, the noise shot size, and vthres. Since an LGN neuron is active even in the absence of modulated stimuli, its maintained discharge constitutes the background activity from which the visual signal needs to be discriminated. As a result, we study the maintained discharge of an LGN neuron, in addition to its response to a modulated stimulus (visually-driven discharge). Results are presented in Figs. 2 and 3. (Only data for τ = 10 and 15 ms are shown.)
Fig. 2.
(Top) Mean rate in ips and (Bottom) CV in the maintained discharge of an LGN neuron, described by the NLIF formalism. The stimulus is a constant input, I0 = 100. Cells that fire less than 2 ips are excluded from the CV analysis (black region)
First, the mean rates of both maintained and visually-driven discharges strongly correlate with vthree and the noise shot size. By either reducing vthree or increasing the noise shot size, neurons fire more frequently. Second, response variability increases as the noise shot size or vthree is increased. The Fano factor of the visually-driven discharge, in particular, is strongly influenced by the noise shot size. The model neuron fires most regularly when vthree and the noise shot size are both small. With a low spike-firing threshold, the constant input alone is strong enough to drive neurons to fire. At high vthree, firing events tend to be fluctuation-driven, and the stimulus-independent noise (controlled by the noise shot size parameter) plays an important role in both firing rate and response variability.
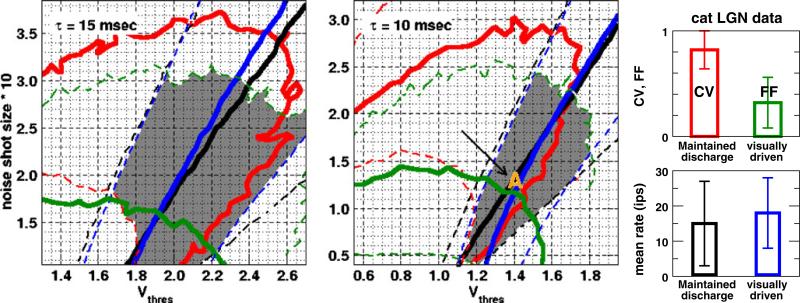
We constrain the model parameters by experimental data on LGN neurons of anesthetized cats to approximate physiological behaviors of a real LGN neuron. To this end, we use data from Fig. 1 of Mukherjee and Kaplan (1998), disregarding data from the minor fraction of neurons in that dataset that display bursty activity. We obtain population averages and standard deviations of the mean rates and CV. Data on the mean visually-driven discharge and the corresponding Fano factor at 50% contrast are taken from Fig. 3 of Kara et al. (2000). For ease of comparison, these data (CV, Fano factor, mean maintained, and mean visually-driven) are redrawn in the bar graph in the right panel of Fig. 4. To demonstrate how experimental data limit our choice of model parameters, in Fig. 4 we plot isolines in the space of vthree and the noise shot size, using the same axes as in Figs. 2 and 3. Along the thick solid isolines, values are equal to the population averages of the CV, Fano factor, mean maintained, and mean visually-driven; isolines of plus and minus one standard deviation from the population averages are plotted as dashed lines. For clarity's sake, we shade the region within one standard deviation from the population averages of all four experimental constraints. Parameters in this gray shaded region are most likely to mimic physiological behaviors of an LGN neuron. At all three τ studied we find parameter combinations that satisfy the four constraints in the right panel of Fig. 4 within a tolerance of one standard deviation around the population mean. (Only data for τ = 10 and 15 ms are shown.) For subsequent cortical simulations, we choose a parameter set that lies very close to the intersections of the four experimental population averages (marked A (in orange), τ = 10 ms, vthree 1.4, and the noise shot size = 0.13). The NLIF model with this parameter set should generate spike trains that are very similar to the average of real LGN neurons in experimental datasets. The NLIF model captures important features of experimental results on LGN neurons. Experimenters observed that the CV of the maintained discharge is inversely correlated with its mean rate (Mukherjee and Kaplan 1998), and the NLIF model closely mimics this behavior (see Fig. 5(a)). (Keeping τ and the noise shot size at 10 ms and 0.13, we vary vthree between 0.95 and 1.75 to obtain different mean rates.) As a side note, adding a 2 ms refractory period reduces the CV by only a small amount (results not shown). In contrast to the NLIF model, neurons modeled by a point Poisson process yield CV ~ 1 at all mean rates. A simple Poisson process thus fails to capture the salient feature of the experimental data in Fig. 5(a). Experimenters have found, rarely, another unique feature in the LGN maintained discharge: in some cells at low mean rate, the CV is greater than one. This super-Poisson behavior indicates that in these neurons there are bursty discharges (Mukherjee and Kaplan 1998). The simple NLIF model employed here does not produce such burst spiking activity.
Fig. 4.
Choice of model parameters is constrained within one standard deviation from the population averages of experimental data. (Right) Population averages of mean rates and variability in the maintained (Mukherjee and Kaplan 1998) and visually-driven (Kara et al. 2000) discharges of cat LGN neurons. Error bars are standard deviations. (Left, Middle) Isolines of Figs. 2 and 3, whose values correspond to population averages (solid) and one standard deviation from the population averages (dashed) of experimental data, are drawn here as a contour map. Black and red are the mean rate and CV in the maintained discharge; blue and green are the mean rate and Fano factor in the visually-driven discharge. The gray shaded area is the possible parameter space under these constraints, and the parameter set used in subsequent cortical studies is marked by A (in orange)
The NLIF model can also account for the observed dependence of the Fano factor on firing rates (Kara et al. 2000). In Fig. 5(b), we compare the variance in spike count to the mean spike count in the visually-driven discharge in 50 ms counting windows. Like the experimental data in Kara et al. (2000), the Fano factor of the NLIF LGN neuron is lowest at the peak of the evoked response. Thus, firing-rate variability declines with increasing mean rate in the NLIF model whereas the Fano factor of the Poisson model fluctuates around 1, regardless of the rate.
To summarize, the NLIF model provides a good description of the temporal response properties of LGN cells. However, the model's absolute response versus stimulus contrast does not include the contrast nonlinearity observed experimentally (Kaplan et al. 1987; Sclar et al. 1990). We do not aim to reproduce the contrast response function, as our goal here is to assess how the response variability of the thalamic input affects the orientation selectivity of V1 neurons. Consequently, we focus on the response regime corresponding to stimulus contrast in the range of 10–50% in our analysis of cortical selectivity.
3.2 Cortical response
To illustrate how variability in the thalamic input could influence its downstream cortical cell's responses, we model the simplest case where a cortical neuron receives purely feedforward inputs from one ON- and one OFF-center LGN neurons (Fig. 1). In what follows we compare V1 responses for the two cases in which the dynamics of each LGN neuron is described either by an NLIF model or by an inhomogeneous Poisson process.
3.2.1 Orientation selectivity
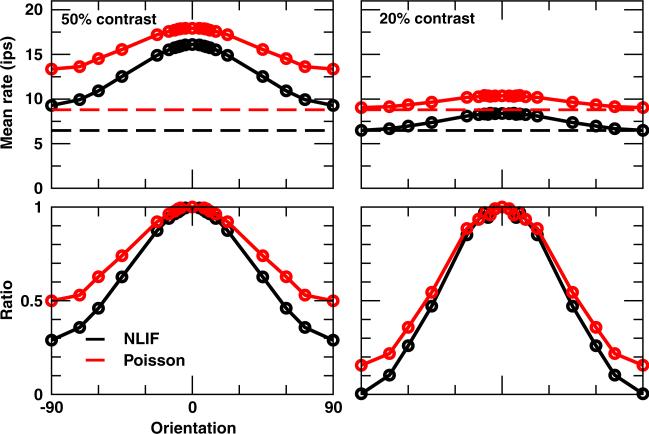
We start by focusing on a model V1 cell in which the LGN–V1 synaptic coupling coefficient, cE, is 0.20. The V1 cell's responses to stimuli of different orientations at 50% and 20% contrasts are plotted in Fig. 6. First, V1 cells receiving Poisson input have higher mean firing rates than their NLIF counterparts. Second, neuronal responses of a V1 cell depend on the stimulus orientation, especially at high contrast. Third, Poisson-driven cortical neurons have larger responses to the orthogonal-to-preferred orientation relative to their peak responses than NLIF-driven neurons.
Fig. 6.
Orientation tuning curves of a V1 neuron at 50% and 20% contrasts for cE = 0.20. (Top) Mean rate at each orientation. (Bottom) Ratio between mean rates (background rate subtracted) at each orientation and the preferred. Dashed lines indicate background rates
The differences between the outcomes with these two LGN models are more readily perceived if we plot the ratio between cortical responses (mean firing rate with background rate subtracted) to a specific orientation and firing in response to the preferred orientation (set to 0°). In particular, the ratio between the cortical responses to the orthogonal-to-preferred and preferred orientations is termed the O/P ratio, an often-used measure of orientation selectivity (Gegenfurtner et al. 1996; Ringach 2002; Johnson et al. 2008). A highly selective neuron would have an O/P ratio close to zero, whereas the O/P ratio of an unselective neuron is one.
At 50% contrast, cortical cells with Poisson afferents have a moderately high O/P ratio of 0.5; whereas cells receiving the NLIF input exhibit better orientation selectivity with a O/P ratio of approximately 0.3 (see Fig. 6). Unlike its responses to high-contrast stimuli, responses of a V1 cell to low-contrast drifting gratings of non-preferred orientations are very close to its spontaneous activity, bringing the O/P ratio down to almost zero. The O/P ratios at low contrast are 0 and 0.15 for cortical cells with NLIF and Poisson afferents, respectively. Again, a more regular thalamic input (i.e., NLIF) gives rise to a more selective cortical cell, albeit to a lesser degree.
Another common measure for orientation selectivity is the bandwidth of orientation tuning. The tuning bandwidth of both NLIF- and Poisson-driven cortical neurons are the same (σ ~ 40°) at 50% and 20% contrasts. In other words, the bandwidth is invariant to both the stimulus contrast and the variability of the LGN input. The baseline R0 and the amplitude A are what differ significantly. (For instance, R0 = 6 and 9 ips, A = 2 and 7 ips for an NLIF-driven V1 cell at 20% and 50% contrasts, i.e., both R0 and A increase with contrast. V1 cells receiving Poisson input follow a similar trend.)
3.2.2 LGN–V1 coupling strength
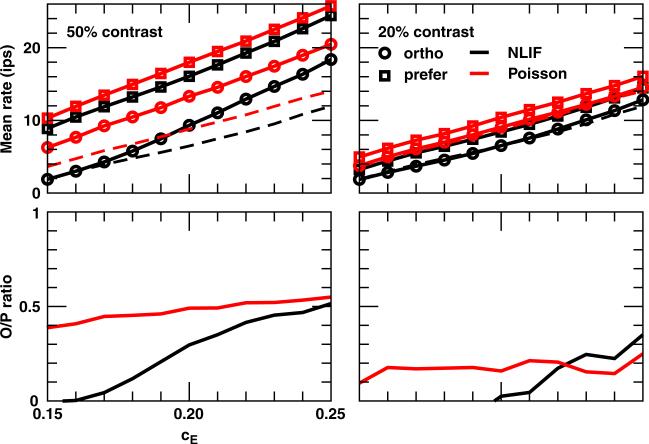
How does the synaptic coupling strength influence properties of cortical cells? We plot in the top panel of Fig. 7 mean firing rates of a V1 cell in response to the orthogonal and preferred stimuli at 50% and 20% contrasts as a function of the LGN–V1 coupling coefficient cE for cE ∈ [0.15, 0.25 . The first observation is that V1 cells fire more spikes] as cE increases since each LGN spike now carries more weight in driving the V1 membrane potential. For example, one single LGN spike induces an LGN synaptic input glgn that reaches a maximum of around 33 with cE = 0.15; whereas with cE = 0.20, glgn reaches a higher value of 45. To have the same peak value with cE = 0.15, LGN afferents have to fire two consecutive spikes with an interspike interval of 4 ms. Second, V1 cells receiving Poisson input have higher mean firing rates than their NLIF counterparts across all cE. This difference is smaller with the preferred stimulus at both contrasts. Furthermore, in response to the orthogonal stimulus at 50% contrast, the mean rates of V1 cells with NLIF afferents are almost identical to their background rates for cE less than 0.17. However, at 20% contrast, regardless of which LGN model is adopted, the orthogonal stimulus triggers responses similar to spontaneous activities across all cE.
Fig. 7.
(Top) Mean rates and (Bottom) O/P ratios of a V1 cell in response to the orthogonal and preferred stimuli at 50% and 20% contrasts as a function of the LGN–V1 synaptic coefficient cE. Dashed lines indicate background rates
To compare orientation selectivity of the two models better, we also plot O/P ratios as a function of cE in Fig. 7. As indicated by these ratios, when presented with 50%-contrast stimulus, V1 cells with Poisson afferents are less selective across all cE tested. The difference, however, gets smaller as cE increases. At large cE, say, 0.25, a single LGN spike can trigger a large enough glgn (whose maximum is 56) to drive its downstream cortical neuron to fire even when the initial V1 membrane potential is low. The ‘abilities’ of the orthogonal and preferred stimuli to drive a V1 cell are thus not as different as in the case of smaller cE.
Differences in O/P ratios between NLIF- and Poisson-driven cortical neurons as a function of cE are more erratic at 20% contrast. O/P ratios of V1 cells receiving the NLIF input are larger than the ones with Poisson afferents for cE greater than 0.22 but dip to zero for cE less than 0.20. As a reminder, O/P ratio = (mean rate to orthogonal − background rate)/(mean rate to preferred − background rate). Since responses to both orthogonal and preferred stimuli are low at 20% contrast, the contribution of background rate to O/P ratio becomes significant. The absolute O/P ratios (mean rate to orthogonal divided by mean rate to preferred) indicate higher orientation selectivity for NLIF-driven cortical neurons at both high and low contrasts.
In short, the strength of the LGN–V1 synaptic coupling also has a large influence on cortical selectivity. It is therefore an important parameter in constructing a realistic neuronal network. We are guided by the cortical firing rate to choose a value of cE of 0.20.
3.2.3 Stimulus contrast
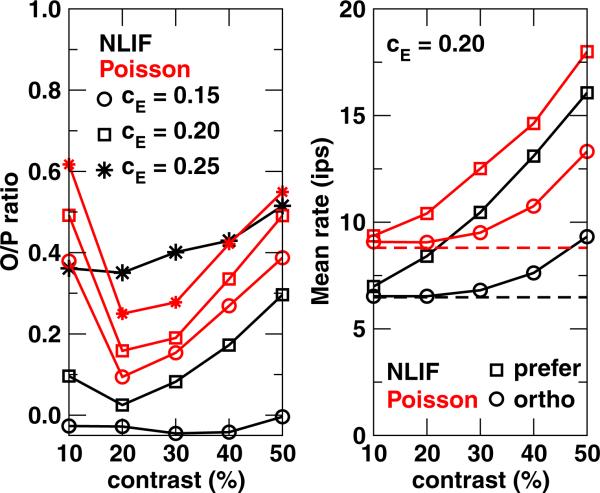
Figures 6 and 7 suggest that if a cortical cell were to follow a feedforward model, whether the afferents were Poisson or NLIF, its selectivity as measured by the O/P ratio should vary with stimulus contrast. To explore this further, we plot in Fig. 8 O/P ratios against contrast levels for cE = 0.15, 0.20, and 0.25. The contrast-dependence of O/P ratios in the cortex is very different for NLIF versus Poisson afferents. For V1 cells receiving Poisson input, regardless of the synaptic coupling strength, O/P ratios initially dip between 10% and 20% contrasts and then increase with increasing contrast. NLIF-driven cortical cells, on the other hand, may have a flat, or very shallow, dependence on the stimulus contrast, and this dependence varies more strongly with cE. Figure 8 also indicates that for all cE bar one (cE = 0.25), NLIF-driven cortical cells are more orientationally selective than their Poisson-driven counterparts at all contrast levels. These observations are easily rationalized by the trend depicted in the right panel. As contrast increases, the mean rates to the orthogonal and preferred stimuli increase for both Poisson- and NLIF-driven neurons. However, the contrast dependence of the response to the orthogonal stimulus only kicks in at ~20% contrast, explaining the ‘dip’ in O/P ratios with respect to contrast. In addition, the influence of contrast on response to the preferred stimulus is much stronger in NLIF-driven V1 neurons than their Poisson counterparts.
Fig. 8.
(Left) O/P ratios and (Right) mean rates of a V1 neuron in response to the orthogonal and preferred stimuli as a function of stimulus contrast for cE = 0.15, 0.20, and 0.25. For mean rates, only data for cE = 0.20 is plotted as an example
3.2.4 Mean input and variability of LGN conductance
The difference between orientation selectivity of V1 cells with Poisson and NLIF afferents is unlikely to be caused by the average response properties of LGN neurons. Mean firing rates of LGN neurons modeled by the NLIF and Poisson formalisms in response to drifting gratings at 50% and 20% contrasts are 20 (19 for Poisson) and 16 (15 for Poisson) ips, respectively. Similarly, their PSTHs and trial-averaged glgn as a function of time match almost perfectly.
To help decipher the mechanism behind the difference observed in V1 orientation selectivity between the NLIF and Poisson inputs, we plot in Fig. 9 a few properties of the summed LGN synaptic input (mean and standard deviation of glgn across time and trials, first harmonic of the trial-averaged glgn) with respect to stimulus orientation. As a side note, these LGN synaptic inputs provide feedforward inputs to model V1 cells whose tuning properties are depicted in Fig. 6. As expected, the mean LGN input conductance is constant irrespective of the orientation, exhibiting no orientation selectivity at all. The first harmonic of trial-averaged glgn, on the other hand, shows high orientation selectivity, peaking at the preferred orientation and dropping to zero at the orthogonal-to-preferred orientation. This, however, is unlikely to be the main factor that causes the difference in selectivity between NLIF- and Poisson-driven cortical cells because the first-harmonic tuning curves of the NLIF and Poisson models are similar in both the shape and amplitude.
The standard deviations of both Poisson and NLIF inputs are tuned to stimulus orientation (Fig. 9, middle panels), and the difference between the orientation tuning curves of standard deviation of the LGN inputs closely resembles the tuning curves of mean V1 firing rates in Fig. 6. What is significant is that the variability of the Poisson input is higher than that of the NLIF input across all orientations at both contrast levels. Since cortical responses to the orthogonal stimulus are mostly fluctuation-driven (Finn et al. 2007), the highly variable Poisson LGN input can induce a higher cortical firing rate than the more regular NLIF LGN input. This may be the main reason V1 responses are less selective when driven by Poisson afferents.
3.2.5 Variability of cortical responses
Kara et al. (2000) show that variability is inversely related to firing rates in individual neuron's responses, i.e., Fano factors decline as mean firing rates rise. The NLIF model of LGN neurons faithfully reproduces this trend as illustrated in Fig. 5(b). This dependence is also captured by NLIF-driven cortical neurons; their responses vary throughout the trial, reaching a minimum FF of 0.35 in the time bin with the highest firing rate (Fig. 10(a) preferred, mean count = 2.3, or 46 ips). The variance of Poisson-driven cortical responses, on the other hand, is proportional to the mean count, yielding an FF that is constant throughout the cycle (data not shown). We also plot the variance in spike count as a function of the mean spike count in overlapping 50-ms windows (Fig. 10(b)). In V1 cells with the NLIF input, whether driven by the preferred or orthogonal stimuli, many 50 ms windows have variance well below the mean count. Furthermore, NLIF-driven cortical cells fire slightly less regularly than their LGN afferents, qualitatively reproducing the trend observed by Kara et al. (2000).
Previous studies have shown that stimulus onset reduces membrane-potential and firing-rate variability in V1 (Monier et al. 2003; Finn et al. 2007; Churchland et al. 2010). In Fig. 11 we see that Poisson-driven V1 cells have FF ~ 1.1 (calculated using 250 ms windows, i.e., one stimulus cycle) across all stimulus orientations and contrasts. In addition, variability of the background rate is the same as the stimulus-driven case. V1 neurons with LGN afferents modeled by the NLIF equation, on the other hand, show a reduction in FF in response to a drifting-grating stimulus in general. Unsurprisingly, the decline in variability is most apparent when the corresponding firing rate is the highest, i.e., response to the preferred stimulus at 50% contrast. Variability of response to the orthogonal stimulus at 20% contrast is similar to the variability in spontaneous activity.
3.2.6 ROC analysis
The noisiness of the LGN input has an influence also on stimulus detectability based on the spike trains of model V1 neurons. Receiver-Operating Characteristic (ROC) curves indicate how likely it is that a neuron can correctly distinguish a signal trial (visually driven) from a blank trial (spontaneous activity), based on its firing rate. Integrating under the ROC curve gives us the detection probability. (0.5 is the chance level, 1 indicates perfect detectability.) We first note in Fig. 12(a) that for both NLIF- and Poisson-driven cortical neurons, as stimulus strength decreases from 50% to 20%, the separation between the noise and signal+noise Pulse-Number-Distributions (PNDs) narrows. This in turn shifts the ROC curve at lower contrast closer to the diagonal ‘chance’ line. In agreement with Edwards et al. (1995), we see an increase in detection probability as the stimulus contrast increases (Fig. 12(b)).
Fig. 12.
(a) Pulse number distributions and ROC curves generated from a model V1 neuron's responses to blank (noise) and the preferred stimulus at 50% and 20% contrasts (signal+noise); cE = 0.20. (b) Detection probability as a function of stimulus contrast ranging from 20% to 50% for a model V1 neuron (solid) and its LGN afferents (dashed)
Figure 12(b) also shows clearly that cortical cells with Poisson afferents have lower detection probability than cells with NLIF afferents across all contrasts tested. As an example, the detection probabilities at 20% contrast are 0.64 and 0.72 for Poisson-and NLIF-driven cortical neurons, respectively. This observation implies that NLIF-driven cortical neurons are better at telling the ‘signal’ (stimulus-driven cases) apart from the ‘noise’ (spontaneous activities). Poisson-driven V1 neurons have larger contrast-dependent response variability than their NLIF counterparts, resulting in a greater overlap between their ‘noise’ and ‘signal+noise’ distributions.
4 Discussion
The goal of this study is to investigate how response variability in the LGN influences the behavior of V1. We choose orientation selectivity as an example of V1's functions and find that it is strongly affected by the variability of the LGN input. Our work suggests that a point Poisson process is a crude approximation with considerable consequences for the many functional properties of the visual cortex.
4.1 Variability of thalamic input and orientation selectivity
We begin by estimating parameters of the NLIF model so it reproduces spiking activities of LGN neurons experimentally observed in cats in vivo. This allows us to use the NLIF model as a compact description of how LGN neurons encode the visual stimulus to be further relayed to V1. Our work establishes that the NLIF model provides an improved description of LGN response properties over inhomogeneous Poisson processes. An LGN neuron described by the NLIF model displays an inverse relationship between the mean and CV of its background firing rate as well as an inverse relationship between the visually-driven spike rate and corresponding Fano factor. Both results are not predicted by the Poisson model of LGN spike trains. Next we show that V1 neurons whose LGN inputs are modeled by the NLIF formalism are more orientationally selective than those with Poisson inputs. We find that the order of ‘improvement’ (i.e., increase in selectivity) depends on the stimulus contrast and the strength of the LGN–V1 synaptic coupling, controlled by the parameter cE. With cE = 0.20 and stimulus contrast of 50%, the O/P ratio drops from 0.5 (Poisson) to 0.3 (NLIF).
When spikes are caused by irregular temporal fluctuations of the membrane potential (i.e., the mean potential does not reach the spike-firing threshold), the spiking process is fluctuation-driven. A pure stochastic input such as Poisson processes will drive neurons to fire more frequently than a more regular NLIF input in the fluctuation-driven regime (the orthogonal stimulus). With the preferred stimulus, V1 cells are strongly driven by their LGN afferents, and they are mostly likely to operate closer to the mean-driven regime where variability of the thalamic input matters less. A much higher spiking rate to the orthogonal stimulus and an only slightly elevated response to the preferred stimulus thus render Poisson-driven cortical cells less orientationally selective than cells driven by the more regular NLIF afferents.
4.2 Contrast invariance and orientation selectivity
Although firing rates of neurons in the visual cortex depend on the stimulus contrast, orientation tuning is generally considered to be contrast invariant (Sclar and Freeman 1982). The theoretical importance of this invariance has gathered much attention (Ben-Yishai et al. 1995; Troyer et al. 1998; Hansel and van Vreeswijk 2002; Finn et al. 2007, among others). Typically, effects of contrast on orientation tuning are assessed by comparing the half-width at half-height of tuning curves, a property not affected by contrast levels. Nevertheless, measures such as O/P ratios and circular variance are contrast noninvariant. Johnson et al. (2008), for example, report that in macaque V1 the O/P ratio for high-luminance contrast is more often lower than for contrast of low-luminance, consistent with the observation of Alitto and Usrey (2004) in ferret V1. Regardless of how we model the LGN afferents, the pure feedforward model of V1 cells offered here does not explain all the contrast-dependence of orientation selectivity. Tuning bandwidths of both NLIF-and Poisson-driven cortical neurons remain constant as contrast levels vary. O/P ratios, on the other hand, increase as stimulus contrast increases, opposite to what is observed experimentally. We only consider here the most reduced feedforward model of the cortex because we focus on the role of spike-firing variability. To account for contrast-dependence and to explain all phenomena of cortical orientation selectivity would require a model with cortico-cortical inhibition and cortico-cortical excitation (Somers et al. 1995; Sompolinsky and Shapley 1997; Troyer et al. 1998; McLaughlin et al. 2000; Xing et al. 2005, 2011; Zhu et al. 2010). This study should help modelers to build a more realistic and elaborate model with NLIF inputs from the LGN to the cortex.
4.3 Modeling considerations
Despite the fact that the NLIF model is more realistic than a simple Poisson point process, it is still only a simplified description of all known mechanisms underlying the neuronal responses of LGN cells. As alluded to previously, the NLIF model fails to account for burst spiking activities. One remedy is to employ a more sophisticated LGN model that explicitly includes the ‘burst’ mode in the dynamics, e.g., the integrate-and-fire-or-burst neuron (Smith et al. 2000). One should note that there are significantly fewer bursts in awake animals compared to the anesthetized. Alitto et al. (2011), for example, report that anesthesia increases the percentage of bursts by roughly 3 times in macaque monkeys. As a result, the NLIF model without bursts may be an adequate model for the LGN in awake animals. Another improvement on the NLIF model adopted in this paper would be to include a mechanism for the contrast-dependent non-linearity of visual responses. This non-linearity of LGN cells may be mostly a reflection of the retinal contrast gain control and can be modeled in the steady state as a functional of the spatio-temporal contrast (Koelling et al. 2008). Last but not least, LGN neurons are more than just passive relays. Anatomical data have shown that only 10–20% of the input to the LGN are comprised of retinal afferents (see Sherman and Koch 1986, for example). Neuronal responses of LGN cells are thus driven and modulated by a complicated feedforward (retina), feedback (from cortex), and recurrent (within the LGN itself) circuitry. Further improvements on the NLIF model of LGN cells could include more of this complex circuitry.
One should also note that it is generally believed that many V1 neurons in the input layer receive inputs from more than two LGN cells (Alonso et al. 2001). The effect we observe here will become gradually smaller as the number of LGN afferents per cortical cell increases. The dependence on the amount of afferent convergence needs further study.
Although visual signals relayed through the LGN clearly drive responses in V1, the main source of synaptic inputs to cortical neurons in V1 is from other nearby cortical neurons (intra-cortical excitation and inhibition). This has inspired many anatomically motivated cortical network models (Somers et al. 1995; McLaughlin et al. 2000; Wielaard et al. 2001; Tao et al. 2004; Teich and Qian 2006; Zhu et al. 2009, 2010), many of which treat the LGN spike trains as inhomogeneous Poisson processes. Our study suggests that a point Poisson process is a crude approximation with considerable consequences for the many functional properties of the visual cortex.
Acknowledgements
We thank E. Kaplan and J. Wielaard for helpful comments on the manuscript. This work was supported by grants from the National Institutes of Health and National Science Foundation and by fellowships from the Swartz Foundation.
References
- Alitto HJ, Moore BD, 4th, Rathbun DL, Usrey WM. A comparison of visual responses in the lateral geniculate nucleus of alert and anaesthetized macaque monkeys. 1. Journal of Physiology. 2011;589:87–99. doi: 10.1113/jphysiol.2010.190538. [DOI] [PMC free article] [PubMed] [Google Scholar]
- Alitto HJ, Usrey WM. Influence of contrast on orientation and temporal frequency tuning in ferret primary visual cortex. Journal of Neurophysiology. 2004;91:2797–2808. doi: 10.1152/jn.00943.2003. [DOI] [PubMed] [Google Scholar]
- Alonso J-M, Usrey WM, Reid RC. Rules of connectivity between geniculate cells and simple cells in cat primary visual cortex. Journal of Neuroscience. 2001;21:4002–4015. doi: 10.1523/JNEUROSCI.21-11-04002.2001. [DOI] [PMC free article] [PubMed] [Google Scholar]
- Andolina IM, Jones HE, Wang W, Sillito AM. Corticothalamic feedback enhances stimulus response precision in the visual system. Proceedings of the National Academy of Sciences. 2007;104:1685–1690. doi: 10.1073/pnas.0609318104. [DOI] [PMC free article] [PubMed] [Google Scholar]
- Ben-Yishai R, Bar-Or RL, Sompolinsky H. Theory of orientation tuning in visual cortex. Proceedings of the National Academy of Sciences. 1995;92:3844–3848. doi: 10.1073/pnas.92.9.3844. [DOI] [PMC free article] [PubMed] [Google Scholar]
- Berry MJ, Warland DK, Meister M. The structure and precision of retinal spike trains. Proceedings of the National Academy of Sciences. 1997;94:5411–5416. doi: 10.1073/pnas.94.10.5411. [DOI] [PMC free article] [PubMed] [Google Scholar]
- Blakemore C, Vital-Durand F. Organization and post-natal development of the monkey's lateral geniculate nucleus. Journal of Physiology. 1986;380:453–491. doi: 10.1113/jphysiol.1986.sp016297. [DOI] [PMC free article] [PubMed] [Google Scholar]
- Braitenberg V, Schüz A. Anatomy of the cortex: Statistics and geometry. Springer; Berlin: 1991. [Google Scholar]
- Carandini M, Demb JB, Mante V, Tolhurst DJ, Dan Y, Olshausen BA, et al. Do we know what the early visual system does? Journal of Neuroscience. 2005;25:10577–10597. doi: 10.1523/JNEUROSCI.3726-05.2005. [DOI] [PMC free article] [PubMed] [Google Scholar]
- Casti A, Hayot F, Xiao Y, Kaplan E. A simple model of retina-LGN transmission. Journal of Computational Neuroscience. 2008;24:235–252. doi: 10.1007/s10827-007-0053-7. [DOI] [PubMed] [Google Scholar]
- Churchland MM, Yu BM, Cunningham JP, Sugrue LP, Cohen MR, et al. Stimulus onset quenches neural variability: A widespread cortical phenomenon. Nature Neuroscience. 2010;13:369–378. doi: 10.1038/nn.2501. [DOI] [PMC free article] [PubMed] [Google Scholar]
- De Valois RL, De Valois KK. Spatial vision. Oxford University Press; New York: 1990. [Google Scholar]
- Derrington AM, Lennie P. Spatial and temporal contrast sensitivities of neurones in lateral geniculate nucleus of macaque. Journal of Physiology. 1984;357:219–240. doi: 10.1113/jphysiol.1984.sp015498. [DOI] [PMC free article] [PubMed] [Google Scholar]
- Edwards DP, Purpura KP, Kaplan E. Contrast sensitivity and spatial frequency response of primate cortical neurons in and around the cytochrome oxidase blobs. Vision Research. 1995;35:1501–1523. doi: 10.1016/0042-6989(94)00253-i. [DOI] [PubMed] [Google Scholar]
- Finn IM, Priebe NJ, Ferster D. The emergence of contrast-invariant orientation tuning in simple cells of cat visual cortex. Neuron. 2007;54:137–152. doi: 10.1016/j.neuron.2007.02.029. [DOI] [PMC free article] [PubMed] [Google Scholar]
- Gegenfurtner KR, Kiper DC, Fenstemaker SB. Processing of color, form, and motion in macaque area V2. Visual Neuroscience. 1996;13:161–172. doi: 10.1017/s0952523800007203. [DOI] [PubMed] [Google Scholar]
- Green DM, Swets JA. Signal detection theory and psychophysics. Wiley; New York: 1966. [Google Scholar]
- Hansel D, van Vreeswijk C. How noise contributes to contrast invariance of orientation tuning in cat visual cortex. Journal of Neuroscience. 2002;22:5118–5128. doi: 10.1523/JNEUROSCI.22-12-05118.2002. [DOI] [PMC free article] [PubMed] [Google Scholar]
- Hubel DH, Wiesel TN. Receptive fields, binocular interaction and functional architecture in the cat's visual cortex. Journal of Physiology. 1962;160:106–154. doi: 10.1113/jphysiol.1962.sp006837. [DOI] [PMC free article] [PubMed] [Google Scholar]
- Irvin GE, Casagrande VA, Norton TT. Center/surround relationships of magnocellular, parvocellular, and koniocellular relay cells in primate lateral geniculate nucleus. Visual Neuroscience. 1993;10:363–373. doi: 10.1017/s0952523800003758. [DOI] [PubMed] [Google Scholar]
- Johnson EN, Hawken MJ, Shapley R. The orientation selectivity of color-responsive neurons in macaque V1. Journal of Neuroscience. 2008;28:8096–8106. doi: 10.1523/JNEUROSCI.1404-08.2008. [DOI] [PMC free article] [PubMed] [Google Scholar]
- Kaplan E, Purpura K, Shapley RM. Contrast affects the transmission of visual information through the mammalian lateral geniculate nucleus. Journal of Physiology. 1987;391:267–288. doi: 10.1113/jphysiol.1987.sp016737. [DOI] [PMC free article] [PubMed] [Google Scholar]
- Kaplan E, Shapley RM. X and Y cells in the lateral geniculate nucleus of macaque monkeys. Journal of Physiology. 1982;330:125–143. doi: 10.1113/jphysiol.1982.sp014333. [DOI] [PMC free article] [PubMed] [Google Scholar]
- Kara P, Reinagel P, Reid RC. Low response variability in simultaneously recorded retinal, thalamic, and cortical neurons. Neuron. 2000;27:635–646. doi: 10.1016/s0896-6273(00)00072-6. [DOI] [PubMed] [Google Scholar]
- Keat J, Reinagel P, Reid RC, Meister M. Predicting every spike: A model for the responses of visual neurons. Neuron. 2001;30:803–817. doi: 10.1016/s0896-6273(01)00322-1. [DOI] [PubMed] [Google Scholar]
- Knight BW. Dynamics of encoding in a population of neurons. Journal of General Physiology. 1972;59:734–766. doi: 10.1085/jgp.59.6.734. [DOI] [PMC free article] [PubMed] [Google Scholar]
- Koelling M, Shapley R, Shelley M. Retinal and cortical nonlinearities combine to produce masking in V1 responses to plaids. Journal of Computational Neuroscience. 2008;25:390–400. doi: 10.1007/s10827-008-0086-6. [DOI] [PubMed] [Google Scholar]
- Maimon G, Assad JA. Beyond Poisson: Increased spike-time regularity across primate parietal cortex. Neuron. 2009;62:426–440. doi: 10.1016/j.neuron.2009.03.021. [DOI] [PMC free article] [PubMed] [Google Scholar]
- McLaughlin D, Shapley R, Shelley M, Wielaard DJ. A neuronal network model of macaque primary visual cortex (V1): Orientation selectivity and dynamics in the input layer 4Cα. Proceedings of the National Academy of Sciences. 2000;97:8087–8092. doi: 10.1073/pnas.110135097. [DOI] [PMC free article] [PubMed] [Google Scholar]
- Miura K, Tsubo Y, Okada M, Fukai T. Balanced excitatory and inhibitory inputs to cortical neurons decouple firing irregularity from rate modulations. Journal of Neuro-science. 2007;27:13802–13812. doi: 10.1523/JNEUROSCI.2452-07.2007. [DOI] [PMC free article] [PubMed] [Google Scholar]
- Monier C, Chavane F, Baudot P, Graham LJ, Frégnac Y. Orientation and direction selectivity of synaptic inputs in visual cortical neurons: A diversity of combinations produces spike tuning. Neuron. 2003;37:663–680. doi: 10.1016/s0896-6273(03)00064-3. [DOI] [PubMed] [Google Scholar]
- Mukherjee P, Kaplan E. The maintained discharge of neurons in the cat lateral geniculate nucleus: Spectral analysis and computational modeling. Visual Neuroscience. 1998;15:529–539. doi: 10.1017/s0952523898153063. [DOI] [PubMed] [Google Scholar]
- Peters A, Payne BR, Budd J. A numerical analysis of the geniculocortical input to striate cortex in the monkey. Cerebral Cortex. 1994;4:215–219. doi: 10.1093/cercor/4.3.215. [DOI] [PubMed] [Google Scholar]
- Reich DS, Victor JD, Knight BW. The power ratio and the interval map: Spiking models and extracellular recordings. Journal of Neuroscience. 1998;18:10090–10104. doi: 10.1523/JNEUROSCI.18-23-10090.1998. [DOI] [PMC free article] [PubMed] [Google Scholar]
- Reich DS, Victor JD, Knight BW, Ozaki T, Kaplan E. Response variability and timing precision of neuronal spike trains in vivo. Journal of Neurophysiology. 1997;77:2836–2841. doi: 10.1152/jn.1997.77.5.2836. [DOI] [PubMed] [Google Scholar]
- Reid RC, Alonso J-M. Specificity of monosynaptic connections from thalamus to visual cortex. Nature. 1995;378:281–284. doi: 10.1038/378281a0. [DOI] [PubMed] [Google Scholar]
- Ringach DL. Spatial structure and symmetry of simple-cell receptive fields in macaque primary visual cortex. Journal of Neurophysiology. 2002;88:455–463. doi: 10.1152/jn.2002.88.1.455. [DOI] [PubMed] [Google Scholar]
- Sclar G, Freeman RD. Orientation selectivity in the cat's striate cortex is invariant with stimulus contrast. Experimental Brain Research. 1982;46:457–461. doi: 10.1007/BF00238641. [DOI] [PubMed] [Google Scholar]
- Sclar G, Maunsell JHR, Lennie P. Coding of image contrast in central visual pathways of the macaque monkey. Vision Research. 1990;30:1–10. doi: 10.1016/0042-6989(90)90123-3. [DOI] [PubMed] [Google Scholar]
- Seriès P, Latham PE, Pouget A. Tuning curve sharpening for orientation selectivity: Coding efficiency and the impact of correlations. Nature Neuroscience. 2004;7:1129–1135. doi: 10.1038/nn1321. [DOI] [PubMed] [Google Scholar]
- Shadlen MN, Newsome WT. The variable discharge of cortical neurons: Implications for connectivity, computation, and information coding. Journal of Neuro-science. 1998;18:3870–3896. doi: 10.1523/JNEUROSCI.18-10-03870.1998. [DOI] [PMC free article] [PubMed] [Google Scholar]
- Shelley MJ, Tao L. Efficient and accurate time-stepping schemes for integrate-and-fire neuronal networks. Journal of Computational Neuroscience. 2001;11:111–119. doi: 10.1023/a:1012885314187. [DOI] [PubMed] [Google Scholar]
- Sherman SM. Thalamic relays and cortical functioning. Progress in Brain Research. 2005;149:107–126. doi: 10.1016/S0079-6123(05)49009-3. [DOI] [PubMed] [Google Scholar]
- Sherman SM, Koch C. The control of retinogeniculate transmission in the mammalian lateral geniculate nucleus. Experimental Brain Research. 1986;63:1–20. doi: 10.1007/BF00235642. [DOI] [PubMed] [Google Scholar]
- Sincich LC, Horton JC, Sharpee TO. Preserving information in neural transmission. Journal of Neuroscience. 2009;29:6207–6216. doi: 10.1523/JNEUROSCI.3701-08.2009. [DOI] [PMC free article] [PubMed] [Google Scholar]
- Smith GD, Cox CL, Sherman SM, Rinzel J. Fourier analysis of sinusoidally driven thalamocortical relay neurons and a minimal integrate-and-fire-or-burst model. Journal of Neurophysiology. 2000;83:588–610. doi: 10.1152/jn.2000.83.1.588. [DOI] [PubMed] [Google Scholar]
- Somers DC, Nelson SB, Sur M. An emergent model of orientation selectivity in cat visual cortical simple cells. Journal of Neuroscience. 1995;15:5448–5465. doi: 10.1523/JNEUROSCI.15-08-05448.1995. [DOI] [PMC free article] [PubMed] [Google Scholar]
- Sompolinsky H, Shapley R. New perspectives on the mechanisms for orientation selectivity. Current Opinion in Neurobiology. 1997;7:514–522. doi: 10.1016/s0959-4388(97)80031-1. [DOI] [PubMed] [Google Scholar]
- Tao L, Shelley M, McLaughlin D, Shapley R. An egalitarian network model for the emergence of simple and complex cells in visual cortex. Proceedings of the National Academy of Sciences. 2004;101:366–371. doi: 10.1073/pnas.2036460100. [DOI] [PMC free article] [PubMed] [Google Scholar]
- Teich AF, Qian N. Comparison among some models of orientation selectivity. Journal of Neurophysiology. 2006;96:404–419. doi: 10.1152/jn.00015.2005. [DOI] [PubMed] [Google Scholar]
- Troyer TW, Krukowski AE, Priebe NJ, Miller KD. Contrast-invariant orientation tuning in cat visual cortex: Thalamocortical input tuning and correlation-based intracortical connectivity. Journal of Neuroscience. 1998;18:5908–5927. doi: 10.1523/JNEUROSCI.18-15-05908.1998. [DOI] [PMC free article] [PubMed] [Google Scholar]
- Victor JD, Blessing EM, Forte JD, Buzás P, Martin PR. Response variability of marmoset parvocellular neurons. Journal of Physiology. 2007;5791:29–51. doi: 10.1113/jphysiol.2006.122283. [DOI] [PMC free article] [PubMed] [Google Scholar]
- White EL. Cortical circuits: Synaptic organization of the cerebral cortex. Structure, function and theory. Boston: 1989. Birkhäuser. [Google Scholar]
- Wielaard DJ, Shelley M, McLaughlin D, Shapley R. How simple cells are made in a nonlinear network model of the visual cortex. Journal of Neuroscience. 2001;21:5203–5211. doi: 10.1523/JNEUROSCI.21-14-05203.2001. [DOI] [PMC free article] [PubMed] [Google Scholar]
- Xing D, Ringach DL, Hawken MJ, Shapley RM. Untuned suppression makes a major contribution to the enhancement of orientation selectivity in macaque V1. Journal of Neuroscience. 2011;31:15972–15982. doi: 10.1523/JNEUROSCI.2245-11.2011. [DOI] [PMC free article] [PubMed] [Google Scholar]
- Xing D, Shapley RM, Hawken MJ, Ringach DL. Effect of stimulus size on the dynamics of orientation selectivity in macaque V1. Journal of Neurophysiology. 2005;94:799–812. doi: 10.1152/jn.01139.2004. [DOI] [PubMed] [Google Scholar]
- Zhu W, Shelley M, Shapley R. A neuronal network model of primary visual cortex explains spatial frequency selectivity. Journal of Computational Neuroscience. 2009;26:271–287. doi: 10.1007/s10827-008-0110-x. [DOI] [PubMed] [Google Scholar]
- Zhu W, Xing D, Shelley M, Shapley R. Correlation between spatial frequency and orientation selectivity in V1 cortex: Implications of a network model. Vision Research. 2010;50:2261–2273. doi: 10.1016/j.visres.2010.01.007. [DOI] [PMC free article] [PubMed] [Google Scholar]


