

Significance
In type 1 diabetes (T1D), the insulin-producing pancreatic β-cells are destroyed by the immune system. Both genetic and environmental factors contribute to T1D risk. Candidate genes for T1D identified by genome-wide association studies have been proposed to act at both the immune system and the β-cell levels. This study shows that the risk variant rs3825932 in the candidate gene cathepsin H (CTSH) predicts β-cell function in both model systems and human T1D. Collectively, our data indicate that higher CTSH expression in β-cells may protect against immune-mediated damage and preserve β-cell function, thereby representing a possible therapeutic target. Our study reinforces the concept that candidate genes for T1D may affect disease progression by modulating survival and function of the β-cells.
Keywords: remission, susceptibility gene, GWAS, eQTL, polymorphism
Abstract
Over 40 susceptibility loci have been identified for type 1 diabetes (T1D). Little is known about how these variants modify disease risk and progression. Here, we combined in vitro and in vivo experiments with clinical studies to determine how genetic variation of the candidate gene cathepsin H (CTSH) affects disease mechanisms and progression in T1D. The T allele of rs3825932 was associated with lower CTSH expression in human lymphoblastoid cell lines and pancreatic tissue. Proinflammatory cytokines decreased the expression of CTSH in human islets and primary rat β-cells, and overexpression of CTSH protected insulin-secreting cells against cytokine-induced apoptosis. Mechanistic studies indicated that CTSH exerts its antiapoptotic effects through decreased JNK and p38 signaling and reduced expression of the proapoptotic factors Bim, DP5, and c-Myc. CTSH overexpression also up-regulated Ins2 expression and increased insulin secretion. Additionally, islets from Ctsh−/− mice contained less insulin than islets from WT mice. Importantly, the TT genotype was associated with higher daily insulin dose and faster disease progression in newly diagnosed T1D patients, indicating agreement between the experimental and clinical data. In line with these observations, healthy human subjects carrying the T allele have lower β-cell function, which was evaluated by glucose tolerance testing. The data provide strong evidence that CTSH is an important regulator of β-cell function during progression of T1D and reinforce the concept that candidate genes for T1D may affect disease progression by modulating survival and function of pancreatic β-cells, the target cells of the autoimmune assault.
Type 1 diabetes (T1D) is a polygenic multifactorial disease characterized by an immune-mediated destruction of the insulin-producing pancreatic β-cells. The pathogenesis involves an inflammatory process, in which the pancreatic islets are infiltrated by immune cells that induce progressive β-cell loss by apoptosis (1, 2). Genome-wide association studies have identified more than 40 genetic loci that contribute to T1D susceptibility (3) (www.t1dbase.org), but the mechanisms underlying the contribution of these risk-associated variants for T1D remain to be clarified. More than 60% of the candidate genes for T1D are expressed in human pancreatic islets, and many are regulated by proinflammatory cytokines (4, 5), suggesting that genetic susceptibility to T1D affects both the immune system and the β-cell function. Variations in gene expression are important mechanisms in mediating disease susceptibility, and SNPs may directly regulate the transcript abundance of candidate genes by modifying regulatory elements (6).
The T1D susceptibility locus on chromosome 15q25.1 contains four known protein-coding genes: ADAMTS7, cathepsin H (CTSH), MORF4L1, and RASGRF (3, 7). The most significantly associated SNP, rs3825932, is located in intron 1 of the CTSH gene (7) and has been reported to correlate with the CTSH transcript level (http://eqtl.uchicago.edu/cgi-bin/gbrowse/eqtl/).
CTSH is a ubiquitously expressed lysosomal cysteine protease. The family of cathepsins is involved in overall protein turnover and specific cellular processes, such as apoptosis, antigen presentation, and prohormone processing (8, 9). Experiments with nonobese diabetic mice deficient in cathepsin B, L, or S showed that these proteases are important for the onset of autoimmune diabetes (10, 11). Additionally, several cathepsins have been implicated in proinsulin processing (12) or insulitis in nonobese diabetic mice (13). CTSH has been implicated in apoptosis (14–16), cancer development (17), and processing of neurotransmitters (18).
Against this background, we investigated how genetic variations affect CTSH expression, disease mechanisms, and disease progression in children with newly diagnosed T1D. By combining in vitro and in vivo experimental studies and functional observations in healthy and T1D individuals, we show that the T1D candidate gene CTSH is an important regulator of β-cell function during progression of T1D.
Results
rs3825932 Genotypes Correlate with CTSH mRNA and Protein Expression.
Previous expression quantitative trait locus (eQTL) studies have reported effects of rs3825932 on the CTSH transcript level (19, 20). These datasets show a clear signal surrounding the linkage disequilibrium (LD) block at the transcriptional start site of CTSH, where rs3825932 is among the SNPs with the most significant eQTL signals in CTSH (Fig. S1). There was no eQTL effect on the expression of the three additional genes at the 15q25.1 locus.
Real-time quantitative PCR (qPCR) analysis of the HapMap B-lymphoblastoid cell lines (BLCLs) confirmed that the T allele of rs3825932 correlated with decreased CTSH mRNA in an allele dose-dependent manner (P = 1.3 × 10⁻⁷, ANOVA) (Fig. 1A). Of all analyzed SNPs in the LD block, rs3825932 was most significantly associated with CTSH expression (Table S1) and captured the eQTL effect of the top SNPs, which was shown by forward stepwise regression. When tag SNPs for the entire region were included, rs3825932 explained most of the eQTL effects observed.
Fig. 1.

rs3825932 affects CTSH mRNA and protein levels. (A) CTSH mRNA was examined in HapMap BLCLs by qPCR and normalized to the geomean of GAPDH, ACTB, and UBC. Data are relative expression with median, SD, and 5–95 percentiles [n = 25 (CC), n = 24 (CT), and n = 7 (TT)]. (B) CTSH protein was examined in HapMap BLCLs by immunoblotting and normalized to β-actin. Data are relative expression (fold) with median, SD, and 5–95 percentiles [n = 6 (CC), n = 5 (CT), and n = 6 (TT)]. (C) A representative immunoblot with n = 2 for each genotype. *P < 0.05; **P < 0.01; ***P < 0.001.
Additionally, rs3825932 also affected the protein expression of CTSH in the HapMap BLCLs. The TT genotype was associated with a lower CTSH protein level compared with the CC and CT genotypes (P = 0.014, ANOVA) (Fig. 1 B and C). Similar to the HapMap BLCLs, the T allele of rs3825932 was correlated with a decreased CTSH mRNA level in BLCLs from patients with T1D (P = 0.006). Analysis of pancreatic tissue from five donors with T1D supported that the effect is present in primary disease-relevant tissue, because the CTSH mRNA level was one-third in the three TT genotype carriers compared with the two CC/CT carriers (Fig. S2).
Cytokines Suppress CTSH Expression in Human Islets and Rat β-Cells.
Proinflammatory cytokines, particularly IL-1β, IFN-γ, and TNF-α, contribute to β-cell dysfunction and apoptosis in T1D (1, 21). We, therefore, investigated if cytokines affect the expression of CTSH in pancreatic islets. Exposure of human islets to IL-1β, IFN-γ, and TNF-α decreased the expression of CTSH compared with untreated islets (Fig. 2A). The cytokine-mediated suppression of CTSH expression was confirmed specifically in β-cells, which was shown by a decrease in Ctsh mRNA in purified primary rat β-cells after exposure to IL-1β and IFN-γ (Fig. 2B).
Fig. 2.
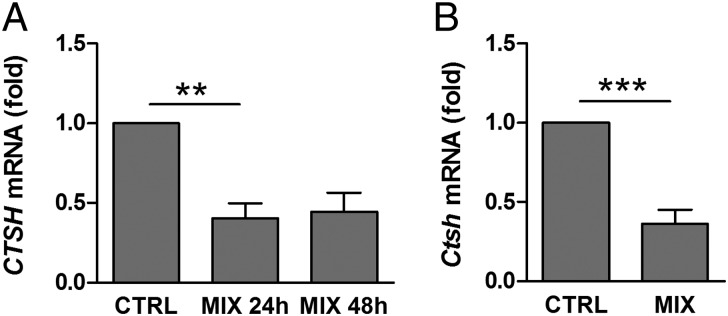
Cytokines suppress CTSH expression. (A) Human islets were untreated or exposed to IL-1β (1 ng/mL), IFN-γ (20 ng/mL), and TNF-α (8 ng/mL) (MIX) for 24 or 48 h. CTSH was examined by microarray. Data are means ± SEMs of four individuals. (B) Purified primary rat β-cells were untreated or exposed to IL-1β (50 U/mL) and IFN-γ (500 U/mL) (MIX) for 24 h. Ctsh was examined by qPCR and normalized to Gapdh. Data are means ± SEMs (n = 6). CTRL, control. **P < 0.01; ***P < 0.001.
To confirm that CTSH is expressed at the protein level in human β-cells, we performed immunohistochemical staining of pancreatic sections from nondiabetic donors. CTSH was expressed in both exocrine tissue and pancreatic islets (Figs. S3 and S4), including β-cells, where it costained with insulin (Fig. S3).
Overexpression of CTSH Decreases Cytokine-Induced Apoptosis.
To investigate whether CTSH is involved in cytokine-induced β-cells apoptosis, insulin-secreting INS-1 cells with stable overexpression of CTSH were generated, and two CTSH-overexpressing clones [plasmid encoding CTSH #1 (pCTSH #1) and pCTSH #2) were selected (Fig. 3A). Overexpression of CTSH decreased cytokine-induced apoptosis by ∼50% compared with cells transfected with an empty vector (Fig. 3B). Basal apoptosis rate was not significantly affected. These findings were supported by data showing that overexpression of CTSH decreased cytokine-induced caspase-3/7 activity (Fig. 3C).
Fig. 3.

CTSH overexpression decreases cytokine-induced apoptosis. INS-1 cells were stably transfected with an empty control vector (pcDNA) or a vector encoding CTSH (pCTSH #1 and pCTSH #2). Cells were untreated or exposed to IL-1β (150 pg/mL) and IFN-γ (5 ng/mL) (MIX) for 24 h. (A) Immunoblot of CTSH in INS-1 pcDNA and pCTSH cells. (B) Apoptosis determined by the presence of cytosolic histone–DNA complexes. Data are means ± SEMs (n = 4). (C) Caspase-3/7 activity. Data are means ± SEMs (n = 4). CTRL, control. *P < 0.05; **P < 0.01.
CTSH Regulates Cytokine Signaling.
NF-κB, signal transducer and activator of transcription 1, and the MAPKs JNK, p38, and ERK are critical mediators of cytokine signal transduction in β-cells (21, 22). We, therefore, examined if CTSH affects cytokine signaling through these components. Cytokine-induced degradation of IκB, phosphorylation of signal transducer and activator of transcription 1, and phosphorylation of ERK1/2 were unaffected by CTSH overexpression (Fig. S5). In contrast, phosphorylation of JNK1/2 and p38 was diminished in cells overexpressing CTSH compared with control cells (Fig. 4 A and B). In line with these data, phosphorylation of c-Jun and JunD, transcription factors downstream of JNK, was decreased in CTSH-overexpressing cells after exposure to cytokines (Fig. 4 C and D). A downstream target of NF-κB and MAPKs in β-cells is inducible nitric oxide synthase (iNOS) (21, 22). Overexpression of CTSH caused an early transient reduction in cytokine-induced iNOS mRNA expression, which translated into reduced iNOS protein (Fig. 4 E and F).
Fig. 4.

CTSH overexpression decreases cytokine signaling. INS-1 pcDNA and pCTSH cells were untreated or exposed to IL-1β (150 pg/mL) and IFN-γ (5 ng/mL) (MIX). (A–D and F) Immunoblotting was performed after stimulation for 0 h, 30 min, or 6 h. Data are means ± SEMs (n = 3–4). (E and G–I) qPCR was performed after stimulation for 2, 4, or 8 h; data are normalized to Actb and presented as fold induction. Data are means ± SEMs (n = 4). CTRL, control. *P < 0.05; **P < 0.01; ***P < 0.001.
Finally, we examined if overexpression of CTSH affects the expression of the proapoptotic factors Bim, Bak, Bid, death protein 5 (DP5), p53 up-regulated modulator of apoptosis (Puma), and c-Myc. Although overexpression of CTSH abolished cytokine-induced expression of Bcl2l11 (Bim), c-Myc, and DP5 (Hrk) mRNA (Fig. 4 G–I), it failed to significantly affect Bak, Bid, and Puma (Bbc3) mRNA expression (Fig. S5).
CTSH Regulates Insulin Transcription.
We also examined if CTSH affects insulin secretion. Overexpression of CTSH increased the medium-accumulated insulin by ∼50–70% compared with control cells (Fig. 5A); however, CTSH did not affect glucose-stimulated insulin secretion (Fig. S5). The CTSH-overexpressing cells had a higher Ins2 mRNA expression compared with the control cells (Fig. 5B), whereas Ins1 was not significantly affected (Fig. 5C).
Fig. 5.

CTSH regulates insulin transcription and secretion. (A) Medium insulin accumulation over 24 h from INS-1 pcDNA and pCTSH cells. Data are insulin (micrograms per liter) divided by DNA content with median, SD, and 5–95 percentiles (n = 7). (B and C) INS-1 pcDNA and pCTSH cells were untreated or exposed to IL-1β (150 pg/mL) and IFN-γ (5 ng/mL) (MIX) for 24 h. Ins1 and Ins2 were examined by qPCR and normalized to Hprt1. Data are mean ± SEM (n = 4). (D) Medium insulin accumulation over 24 h from islets of WT and Ctsh−/− (KO) mice. Data are insulin (micrograms per liter) divided by DNA content with median, SD, and 5–95 percentiles (n = 4). (E) Blood glucose (milligrams per deciliter) was measured in WT and Ctsh−/− (KO) mice after overnight fasting with ad libitum water access. Median, SD, and 5–95 percentiles (n = 7 in each group). CTRL, control. **P < 0.01; ***P < 0.001.
To further validate our findings, mirror experiments were performed in primary islets from Ctsh−/− and WT mice. Medium-accumulated insulin was lower in isolated islets from Ctsh−/− mice compared with WT littermates (Fig. 5D). These data are in line with a trend for a higher fasting blood glucose level in Ctsh−/− mice (P = 0.2) (Fig. 5E). Additionally, the insulin intensity was significantly lower in islets from Ctsh−/− mice compared with islets from WT mice (Fig. 6 and Table S2), which was evaluated by immunohistochemical staining of pancreatic sections. The difference was not caused by a deficit of Ins2 in Ctsh−/− mice, which was shown by an identical ratio of Ins1 and Ins2 mRNA in pancreas from Ctsh−/− and WT mice. In contrast, there was no difference in the glucagon intensity between Ctsh−/− and WT mice (Fig. 6).
Fig. 6.

CTSH regulates insulin content. Representative immunohistochemical staining of pancreatic sections from (A–C) WT and (D–F) Ctsh−/− mice stained for insulin (green) and glucagon (red). Nuclei were stained using DAPI (blue). (Magnification: 40×; scale bar: 50 µm.)
rs3825932 Affects Disease Progression in Children with T1D.
To gain insight into possible in vivo effects caused by the rs3825932 variant, we examined if rs3825932 affects residual β-cell function and glycemic control in children with newly diagnosed T1D. These children display a varying degree of decline in residual β-cell function, which could partly be determined by genetic risk factors. Of interest, carriers of the TT genotype required a higher daily insulin dose 9 and 12 mo after disease onset compared with the CC and CT carriers (9 mo: estimate: 0.18 U/kg, P = 0.009; 12 mo: estimate: 0.22 U/kg, P = 0.009) (Fig. 7A). There was no difference in glycemic control (HbA1c) between the groups. The insulin dose-adjusted HbA1c (IDAA1c) levels were, however, higher 9 and 12 mo after disease onset in carriers of the TT genotype compared with the CC and CT carriers (9 mo: estimate: 0.8, P = 0.042; 12 mo: estimate: 1.1, P = 0.026) (Fig. 7B). Of note, there was a tendency toward fewer TT carriers entering remission (as assessed by an IDAA1c ≤ 9) (23), which is a state of temporary improvement in disease progression caused by improved β-cell function. Indeed, by 12 mo after disease onset, none of the TT carriers were in remission compared with 15% and 21% of the CC and CT carriers, respectively (Fig. 7C) (P = 0.068, recessive model).
Fig. 7.

rs3825932 affects disease progression in children with T1D. The genotype distribution was CC, 107; CT, 126; and TT, 18. (A) Daily insulin dose (units per kilogram) and (B) IDAA1c according to genotype (black, CT; blue, CC; red, TT). Data are means ± SEMs. (C) Clinical remission 12 mo after onset defined as IDAA1c ≤ 9. *P < 0.05; **P < 0.01.
rs3825932 Affects β-Cell Function in Healthy Subjects.
We next investigated if rs3825932 affects β-cell function in a group of young, clinically well-characterized healthy twins. Insulin secretion was assessed by oral glucose tolerance test (OGTT) (Table 1) and i.v. glucose tolerance test (IVGTT) (Table S3), whereas insulin sensitivity was evaluated by a euglycemic–hyperinsulinemic clamp (Table S3). There was a significant effect of rs3825932 on the insulinogenic index, a measure of β-cell function. The effect size was 0.79 (P = 0.03), corresponding to a 21% decrease in β-cell function for each T allele (Table 1). However, rs3825932 did not affect insulin sensitivity (Table S3), suggesting that the observed effect is caused by differences in β-cell function.
Table 1.
Oral glucose tolerance test measures in healthy subjects
| CC | CT | TT | Effect size (%) | P value | |
| n (men/women) | 38 (18/20) | 51 (22/29) | 17 (17/0) | ||
| Age (y) | 28.1 (1.8) | 27.7 (1.9) | 28.8 (1.7) | ||
| Insbasal (pmol/L)* | 36.3 (22.5) | 32.8 (15.3) | 33.1 (18.2) | 1.03 | 0.71 |
| Insindex† | 198 (282) | 138 (112) | 79 (29) | 0.79 | 0.03 |
| AUCins0−30‡ | 6,580 (2,669) | 5,684 (3,249) | 5,111 (2,653) | 0.88 | 0.08 |
| HOMAβ-cell§ | 62.1 (23.4) | 71.1 (29.1) | 62.1 (23.1) | 1.07 | 0.24 |
Data are mean (SD). P values were calculated using the mathematical model Ln(response variable) = age + sex + VO2max + total fat percentage + rs3825932 genotype.
The fasting plasma insulin concentration was measured before the OGTT.
Insulinogenic index was calculated as (Ins30 − Ins0)/(Glu30 − Glu0).
The total insulin area under the curve (AUC) was calculated for the initial 30-min period.
Homeostasis model assessment (HOMA) of β-cell function was calculated as Ins0 × 0.144 × 20/(Glu0 − 3.5).
Discussion
We have shown that CTSH is a T1D candidate gene that regulates β-cell function and disease progression in newly diagnosed patients. We confirmed that the previously reported eQTL signals for SNPs located in the T1D susceptibility locus on chromosome 15q25.1 affect the expression of CTSH. Specifically, we observed that the T allele and the TT genotype of rs3825932 significantly correlate with a lower CTSH expression at the mRNA and protein levels, respectively; rs3825932 has no effect on the expression of the other candidate genes in the region, supporting CTSH as the causal gene of this locus. Although rs3825932 is superior in explaining the eQTL signal in CTSH expression, it cannot be excluded that other SNPs or structural variants in tight LD with this variant also carry causal effects.
Exposure of isolated human islets and purified primary rat β-cells to proinflammatory cytokines decreased CTSH mRNA expression. This observation is in concordance with recently published RNA sequencing data used to identify transcripts under cytokine regulation in human islets (4). Importantly, we confirmed that CTSH is expressed at the protein level in human β-cells in pancreatic sections, which is consistent with a previous study that showed that CTSH is localized to the secretory granules of α- and β-cells (24).
The overexpression experiments revealed CTSH as a negative regulator of cytokine-induced apoptosis in insulin-secreting cells. Interestingly, deletion of Ctsh in a mouse model of pancreatic islet cell cancer led to a reduction in tumor incidence and tumor growth because of increased apoptosis (17). Taken together, these results support an antiapoptotic effect of CTSH. Subsequent mechanistic experiments indicated that CTSH exerts its antiapoptotic effects through inhibition of specific cytokine-induced signals in β-cells. Thus, overexpression of CTSH in INS-1 cells diminished signaling through the JNK and p38 pathways, key modulators of cytokine-induced β-cell apoptosis (21). We also observed a clear inhibitory effect of CTSH overexpression on cytokine-induced transcription of the proapoptotic factors Bim, DP5, and c-Myc. The expressions of Bim, c-Myc, and DP5 are induced by cytokines in β-cells, and Bim and DP5 are regulated, at least in part, through JNK (25–27). Importantly, knockdown of DP5 or Bim significantly decreases cytokine-induced apoptosis in both human and rodent β-cells (26–28), and the proapoptotic effects of Bim in β-cells are modulated by two other candidate genes for T1D, namely PTPN2 (26) and GLIS3 (28). These observations suggest that CTSH protects against β-cell apoptosis through inhibition of JNK and p38 signaling and consequent activation of key proapoptotic genes.
Our data also showed effects of CTSH on insulin gene transcription and chronic insulin release. Overexpression of CTSH causes an increase in chronic insulin release from INS-1 cells that is paralleled by increased transcription of Ins2. Accordingly, islets from Ctsh−/− mice contain less insulin than islets from WT littermates. Ctsh−/− mice also tend to have a higher fasting blood glucose.
The clinical data from patients with newly diagnosed T1D supported the in vitro results. Carriers of the rs3825932 TT genotype require a significantly higher insulin dose to maintain glycemic control and have higher IDAA1c levels, thus indicating a negative effect of the TT genotype on the residual β-cell function in T1D patients. Interestingly, the CTSH protein expression data support the clinical observation that the TT genotype differs from the CC and CT genotypes. The lack of association between CTSH genotypes and C-peptide or proinsulin levels might relate to the fact that these patients already suffer from severe β-cell loss, rendering it difficult to detect subtle differences in the β-cell mass and function. Nevertheless, the results indicate that TT carriers have a faster disease progression, leading to a more prominent β-cell dysfunction, which is consistent with our observation that fewer TT carriers enter remission.
In line with these observations, healthy human subjects carrying the T allele had lower β-cell function. We found no effect of rs3825932 on the first-phase insulin secretion, which was assessed through the IVGTT, but in the OGTT, rs3825932 significantly affected the insulinogenic index, showing that the β-cell function was decreased by 21% for each T allele. The data suggest that rs3825932 primarily affects insulin secretion in response to oral as opposed to i.v. glucose ingestion. It is conceivable that the differences between the two tests are explained by rs3825932 primarily affecting the second-phase insulin secretion response. Importantly, a recent study identified a type 2 diabetes candidate gene that only affects second-phase insulin secretion (29).
Several T1D candidate genes have been implicated in β-cell function and survival (28, 30–32), but to our knowledge, this study is the first demonstration that a genome-wide association study-identified genetic variation affects β-cell function in both model systems and human T1D. Thus, this study strengthens CTSH as a causal risk gene in T1D and reinforces the concept that candidate genes for T1D may affect disease progression by modulating survival and function of the pancreatic β-cells (33). We suggest that SNPs, which cause a low expression of CTSH, sensitize β-cells to immune-mediated β-cell dysfunction and death, leading to a more rapid and severe loss of functional β-cell mass. This functional knowledge of CTSH may be used for development of new diagnostic and preventive strategies to preserve β-cell function in T1D.
Materials and Methods
Cell Lines.
BLCLs from 60 HapMap CEPH founders, obtained from the Coriell Institute (www.ccr.coriell.org), were cultured in RPMI1640 with Glutamax, 10% (vol/vol) heat-inactivated FBS, 100 U/mL penicillin, and 100 µg/mL streptomycin (Invitrogen). qPCR, immunoblotting, and eQTL analysis are described in SI Materials and Methods. BLCLs from 20 T1D and 25 nondiabetic subjects were available from the Type 1 Diabetes Genetics Consortium (www.t1dgc.org). The generation and culturing of these cells have been described previously (34). Microarray, genotyping, and eQTL analysis are in SI Materials and Methods. INS-1 cells were cultured as described (35) and stably transfected with a plasmid pCTSH (OriGene) or an empty control vector (pcDNA 3.1) using Dharmafect 1 (Thermo Scientific). Two days posttransfection, 200 µg/mL G418 (Sigma) was added to the culture medium for selection of stably transfected cells. After 1 wk, the concentration of G418 was reduced to 100 µg/mL, which was used continuously during culturing. INS-1 cells were treated with recombinant mouse IL-1β (BD Pharmingen) and recombinant rat IFN-γ (R&D Systems). qPCR, immunoblotting, apoptosis, and insulin measurements are discussed in SI Materials and Methods.
Human Pancreas.
Human islets from four nondiabetic donors were provided through the Juvenile Diabetes Research Foundation Islet Distribution Program. The islets were cultured in RPMI1640 supplemented with 2% (vol/vol) human serum (Lonza) and precultured for ∼5 d to allow islet depletion of passenger cells, including immune cells. Islets were treated with IL-1β (1 ng/mL), IFN-γ (20 ng/mL), and TNF-α (8 ng/mL) and used for microarray analysis (SI Materials and Methods). Six-micrometer fresh frozen pancreatic samples from five donors with T1D (disease durations ranging from 1 to 8 y) were obtained through the Network for Pancreatic Organ Donors with Diabetes or donated by Thomas Kay (St. Vincent's Institute, Fitzroy, Victoria, Australia). The samples were used for qPCR and genotyping (SI Materials and Methods). Adult human paraffin-embedded, formaldehyde-fixed pancreatic tissues were obtained from four nondiabetic donors through the multicenter European Union-supported program on β-cell transplantation in diabetes and used for immunostaining (SI Materials and Methods).
Animals.
Isolation and culturing of primary rat β-cells have been described previously (36) and followed the guidelines of the Belgian Regulation for Animal Care. The preparations contained 93 ± 1% β-cells (n = 6) and were treated with recombinant human IL-1β (R&D Systems) and recombinant rat IFN-γ (R&D Systems). qPCR is described in SI Materials and Methods. Ctsh−/− mice (strain Ctshtm1Thre) were generated as described (37) on a 129P2/OlaHsd genetic background and backcrossed for 10 generations to the C57BL/6N strain. For these experiments, Ctsh+/− mice were bred, offspring was genotyped (37), and Ctsh+/+ and Ctsh−/− littermates were selected for study. The absence of Ctsh in pancreases from Ctsh−/− mice was verified using qPCR (SI Materials and Methods). The generation and phenotype analyses of Ctsh−/− mice were conducted in accordance to the German law of animal protection. The protocols were approved by the ethics committee of the governmental regional board, Freiburg or the Danish Animal Experiment Inspectorate as appropriate. Pancreatic islets were isolated from Ctsh+/+ and Ctsh−/− mice (equal mix of males and females; 5–16 wk of age) by the collagenase digestion method (Collagenase P; Roche), handpicked, and cultured in RPMI1640 with Glutamax, 10% (vol/vol) heat-inactivated FBS, 100 U/mL penicillin, and 100 µg/mL streptomycin (Invitrogen). The islets were precultured for 3 d. Insulin measurements and immunostaining are in SI Materials and Methods.
Study Populations.
The study population of T1D children was collected through The Hvidoere Study Group on Childhood Diabetes as described (38). The cohort included 126 girls and 131 boys with new-onset T1D. Age at diagnosis was 9.1 ± 3.7 y (mean ± SEM). Glycemic control was measured at 1, 3, 6, 9, and 12 mo after diagnosis (38). IDAA1c defined as actual HbA1c + (4 × insulin dose in units per kilogram per 24 h) was calculated and used as a surrogate marker of residual β-cell function. A calculated IDAA1c ≤ 9 corresponds to an estimated maximal C-peptide level above 300 pmol/L and was used to define clinical remission (23). The twin study population originally included 55 young (22–31 y) and 43 old (57–66 y) monozygotic and same sex dizygotic twin pairs without known diabetes (39); however, in this study, we focused on the young twins, because they are most likely more compatible with the T1D children; 108 subjects had normal glucose tolerance, and 2 subjects had impaired glucose tolerance. The clinical examination included a 75-g OGTT, a 30-min IVGTT (0.3 g/kg body weight), and a 2-h euglycemic–hyperinsulinemic clamp (40 mU m–2 min–1) (39).
Ethical Approval.
All human studies were approved by the regional ethical committee and conducted according to the principles of the Declaration of Helsinki. Animal studies were approved by the local ethical committees as described in detail above.
Statistical Analyses.
Statistical analysis was performed using a two-tailed t test unless otherwise stated. P < 0.05 was considered statistically significant. Genotype-specific levels of CTSH were analyzed using two-way ANOVA. The difference in intensity of the insulin staining between islets from WT and Ctsh−/− mice was evaluated using χ2 test with 5 degrees of freedom (groups 6 and 7 were merged because of few measurements). The distributions are shown in Table S2. All statistical tests on the two study populations were performed in SAS (version 9.1; SAS Institute). In the Hvidoere Study Group, stimulated C peptide (logarithmic), proinsulin (logarithmic), HbA1c, daily insulin dose per kilogram, and IDAA1c (logarithmic) were analyzed as dependent variables in separate multiple regression repeated measurement models with unstructured variance, with sex, age, HLA risk groups, and CTSH genotype as explanatory variables. The assumption of constant effect of genotype was checked by first allowing for interaction between genotype and disease duration. In the twin study population, the proc mixed procedure was used to adjust for twin pair and zygosity status as well as other contributing variables, including age, sex, VO2max, and total fat percentage. All response variables were log-transformed to avoid skewness of the residuals, which also resulted in per-allele effects expressing percentagewise and not absolute changes of the response variable.
Supplementary Material
Acknowledgments
We thank Novo Nordisk for support to The Hvidoere Study Group on Childhood Diabetes, Nils Billestrup for RNA from human islets, Katja Serena and Anne Mette Trauelsen for assistance with mice, Anders Mellerup for sample preparation, and Klaus Stensgaard Frederiksen for help with the microarrays on human islets. The technical assistance of Bodil Bosmann Jørgensen, Oda Troest, Jacqueline Tybjerg, and Fie Hillesø is acknowledged. T.F., C.B., and F.P. were funded by National Institute of Health Grant 1 DP3 DK085678, Juvenile Diabetes Research Foundation Grant 33-2008-391, the A. P. Møller Foundation, and the Poul and Erna Sehested Hansen Foundation. R.R., Q.N., M. Mehta, and G.M. were funded by National Health and Medical Research Council of Australia Grant 516700 and the Diabetes Research Foundation of Western Australia. M. Miani and D.L.E. were funded by the Communaite Francaise de Belgique Actions de Recherche Concertes, Fonds National de la Recherche Scientifique Belgium, and the European Union (NAIMIT and BetaBat in the FP7 of the European Community). T.R. was funded by the Excellence Initiative of the German Federal and State Governments (EXC 294).
Footnotes
The authors declare no conflict of interest.
This article is a PNAS Direct Submission.
This article contains supporting information online at www.pnas.org/lookup/suppl/doi:10.1073/pnas.1402571111/-/DCSupplemental.
References
- 1.Nerup J, et al. On the pathogenesis of IDDM. Diabetologia. 1994;37(Suppl 2):S82–S89. doi: 10.1007/BF00400830. [DOI] [PubMed] [Google Scholar]
- 2.Eizirik DL, Colli ML, Ortis F. The role of inflammation in insulitis and beta-cell loss in type 1 diabetes. Nat Rev Endocrinol. 2009;5(4):219–226. doi: 10.1038/nrendo.2009.21. [DOI] [PubMed] [Google Scholar]
- 3.Barrett JC, et al. Type 1 Diabetes Genetics Consortium Genome-wide association study and meta-analysis find that over 40 loci affect risk of type 1 diabetes. Nat Genet. 2009;41(6):703–707. doi: 10.1038/ng.381. [DOI] [PMC free article] [PubMed] [Google Scholar]
- 4.Eizirik DL, et al. The human pancreatic islet transcriptome: Expression of candidate genes for type 1 diabetes and the impact of pro-inflammatory cytokines. PLoS Genet. 2012;8(3):e1002552. doi: 10.1371/journal.pgen.1002552. [DOI] [PMC free article] [PubMed] [Google Scholar]
- 5.Bergholdt R, et al. Identification of novel type 1 diabetes candidate genes by integrating genome-wide association data, protein-protein interactions, and human pancreatic islet gene expression. Diabetes. 2012;61(4):954–962. doi: 10.2337/db11-1263. [DOI] [PMC free article] [PubMed] [Google Scholar]
- 6.Schaub MA, Boyle AP, Kundaje A, Batzoglou S, Snyder M. Linking disease associations with regulatory information in the human genome. Genome Res. 2012;22(9):1748–1759. doi: 10.1101/gr.136127.111. [DOI] [PMC free article] [PubMed] [Google Scholar]
- 7.Cooper JD, et al. Meta-analysis of genome-wide association study data identifies additional type 1 diabetes risk loci. Nat Genet. 2008;40(12):1399–1401. doi: 10.1038/ng.249. [DOI] [PMC free article] [PubMed] [Google Scholar]
- 8.Conus S, Simon HU. Cathepsins: Key modulators of cell death and inflammatory responses. Biochem Pharmacol. 2008;76(11):1374–1382. doi: 10.1016/j.bcp.2008.07.041. [DOI] [PubMed] [Google Scholar]
- 9.Reiser J, Adair B, Reinheckel T. Specialized roles for cysteine cathepsins in health and disease. J Clin Invest. 2010;120(10):3421–3431. doi: 10.1172/JCI42918. [DOI] [PMC free article] [PubMed] [Google Scholar]
- 10.Maehr R, et al. Cathepsin L is essential for onset of autoimmune diabetes in NOD mice. J Clin Invest. 2005;115(10):2934–2943. doi: 10.1172/JCI25485. [DOI] [PMC free article] [PubMed] [Google Scholar]
- 11.Hsing LC, et al. Roles for cathepsins S, L, and B in insulitis and diabetes in the NOD mouse. J Autoimmun. 2010;34(2):96–104. doi: 10.1016/j.jaut.2009.07.003. [DOI] [PMC free article] [PubMed] [Google Scholar]
- 12.Zou F, et al. Regulation of cathepsin G reduces the activation of proinsulin-reactive T cells from type 1 diabetes patients. PLoS ONE. 2011;6(8):e22815. doi: 10.1371/journal.pone.0022815. [DOI] [PMC free article] [PubMed] [Google Scholar]
- 13.Korpos É, et al. The peri-islet basement membrane, a barrier to infiltrating leukocytes in type 1 diabetes in mouse and human. Diabetes. 2013;62(2):531–542. doi: 10.2337/db12-0432. [DOI] [PMC free article] [PubMed] [Google Scholar]
- 14.Cirman T, et al. Selective disruption of lysosomes in HeLa cells triggers apoptosis mediated by cleavage of Bid by multiple papain-like lysosomal cathepsins. J Biol Chem. 2004;279(5):3578–3587. doi: 10.1074/jbc.M308347200. [DOI] [PubMed] [Google Scholar]
- 15.Droga-Mazovec G, et al. Cysteine cathepsins trigger caspase-dependent cell death through cleavage of bid and antiapoptotic Bcl-2 homologues. J Biol Chem. 2008;283(27):19140–19150. doi: 10.1074/jbc.M802513200. [DOI] [PubMed] [Google Scholar]
- 16.D’Angelo ME, et al. Cathepsin H is an additional convertase of pro-granzyme B. J Biol Chem. 2010;285(27):20514–20519. doi: 10.1074/jbc.M109.094573. [DOI] [PMC free article] [PubMed] [Google Scholar]
- 17.Gocheva V, Chen X, Peters C, Reinheckel T, Joyce JA. Deletion of cathepsin H perturbs angiogenic switching, vascularization and growth of tumors in a mouse model of pancreatic islet cell cancer. Biol Chem. 2010;391(8):937–945. doi: 10.1515/BC.2010.080. [DOI] [PMC free article] [PubMed] [Google Scholar]
- 18.Lu WD, et al. Cathepsin H functions as an aminopeptidase in secretory vesicles for production of enkephalin and galanin peptide neurotransmitters. J Neurochem. 2012;122(3):512–522. doi: 10.1111/j.1471-4159.2012.07788.x. [DOI] [PMC free article] [PubMed] [Google Scholar]
- 19.Stranger BE, et al. Relative impact of nucleotide and copy number variation on gene expression phenotypes. Science. 2007;315(5813):848–853. doi: 10.1126/science.1136678. [DOI] [PMC free article] [PubMed] [Google Scholar]
- 20.Zeller T, et al. Genetics and beyond—the transcriptome of human monocytes and disease susceptibility. PLoS ONE. 2010;5(5):e10693. doi: 10.1371/journal.pone.0010693. [DOI] [PMC free article] [PubMed] [Google Scholar]
- 21.Donath MY, Størling J, Berchtold LA, Billestrup N, Mandrup-Poulsen T. Cytokines and beta-cell biology: From concept to clinical translation. Endocr Rev. 2008;29(3):334–350. doi: 10.1210/er.2007-0033. [DOI] [PubMed] [Google Scholar]
- 22.Eizirik DL, Mandrup-Poulsen T. A choice of death—the signal-transduction of immune-mediated beta-cell apoptosis. Diabetologia. 2001;44(12):2115–2133. doi: 10.1007/s001250100021. [DOI] [PubMed] [Google Scholar]
- 23.Mortensen HB, et al. Hvidoere Study Group on Childhood Diabetes New definition for the partial remission period in children and adolescents with type 1 diabetes. Diabetes Care. 2009;32(8):1384–1390. doi: 10.2337/dc08-1987. [DOI] [PMC free article] [PubMed] [Google Scholar]
- 24.Im B, Kominami E, Grube D, Uchiyama Y. Immunocytochemical localization of cathepsins B and H in human pancreatic endocrine cells and insulinoma cells. Histochemistry. 1989;93(2):111–118. doi: 10.1007/BF00315963. [DOI] [PubMed] [Google Scholar]
- 25.Cardozo AK, et al. A comprehensive analysis of cytokine-induced and nuclear factor-kappa B-dependent genes in primary rat pancreatic beta-cells. J Biol Chem. 2001;276(52):48879–48886. doi: 10.1074/jbc.M108658200. [DOI] [PubMed] [Google Scholar]
- 26.Santin I, et al. PTPN2, a candidate gene for type 1 diabetes, modulates pancreatic β-cell apoptosis via regulation of the BH3-only protein Bim. Diabetes. 2011;60(12):3279–3288. doi: 10.2337/db11-0758. [DOI] [PMC free article] [PubMed] [Google Scholar]
- 27.Gurzov EN, et al. Signaling by IL-1beta+IFN-gamma and ER stress converge on DP5/Hrk activation: A novel mechanism for pancreatic beta-cell apoptosis. Cell Death Differ. 2009;16(11):1539–1550. doi: 10.1038/cdd.2009.99. [DOI] [PubMed] [Google Scholar]
- 28.Nogueira TC, et al. GLIS3, a susceptibility gene for type 1 and type 2 diabetes, modulates pancreatic beta cell apoptosis via regulation of a splice variant of the BH3-only protein Bim. PLoS Genet. 2013;9(5):e1003532. doi: 10.1371/journal.pgen.1003532. [DOI] [PMC free article] [PubMed] [Google Scholar]
- 29.Bhatnagar S, et al. Positional cloning of a type 2 diabetes quantitative trait locus; tomosyn-2, a negative regulator of insulin secretion. PLoS Genet. 2011;7(10):e1002323. doi: 10.1371/journal.pgen.1002323. [DOI] [PMC free article] [PubMed] [Google Scholar]
- 30.Colli ML, Moore F, Gurzov EN, Ortis F, Eizirik DL. MDA5 and PTPN2, two candidate genes for type 1 diabetes, modify pancreatic beta-cell responses to the viral by-product double-stranded RNA. Hum Mol Genet. 2010;19(1):135–146. doi: 10.1093/hmg/ddp474. [DOI] [PMC free article] [PubMed] [Google Scholar]
- 31.Moore F, et al. PTPN2, a candidate gene for type 1 diabetes, modulates interferon-gamma-induced pancreatic beta-cell apoptosis. Diabetes. 2009;58(6):1283–1291. doi: 10.2337/db08-1510. [DOI] [PMC free article] [PubMed] [Google Scholar]
- 32.Nielsen LB, et al. Hvidoere Study Group on Childhood Diabetes The PTPN22 C1858T gene variant is associated with proinsulin in new-onset type 1 diabetes. BMC Med Genet. 2011;12:41. doi: 10.1186/1471-2350-12-41. [DOI] [PMC free article] [PubMed] [Google Scholar]
- 33.Santin I, Eizirik DL. Candidate genes for type 1 diabetes modulate pancreatic islet inflammation and β-cell apoptosis. Diabetes Obes Metab. 2013;15(Suppl 3):71–81. doi: 10.1111/dom.12162. [DOI] [PubMed] [Google Scholar]
- 34.Rosinger S, et al. T1DGC Collection and processing of whole blood for transformation of peripheral blood mononuclear cells and extraction of DNA: The Type 1 Diabetes Genetics Consortium. Clin Trials. 2010;7(1 Suppl):S65–S74. doi: 10.1177/1740774510373493. [DOI] [PMC free article] [PubMed] [Google Scholar]
- 35.Berchtold LA, et al. Huntingtin-interacting protein 14 is a type 1 diabetes candidate protein regulating insulin secretion and beta-cell apoptosis. Proc Natl Acad Sci USA. 2011;108(37):E681–E688. doi: 10.1073/pnas.1104384108. [DOI] [PMC free article] [PubMed] [Google Scholar]
- 36.Miani M, et al. Endoplasmic reticulum stress sensitizes pancreatic beta cells to interleukin-1β-induced apoptosis via Bim/A1 imbalance. Cell Death Dis. 2013;4:e701. doi: 10.1038/cddis.2013.236. [DOI] [PMC free article] [PubMed] [Google Scholar]
- 37.Bühling F, et al. Gene targeting of the cysteine peptidase cathepsin H impairs lung surfactant in mice. PLoS ONE. 2011;6(10):e26247. doi: 10.1371/journal.pone.0026247. [DOI] [PMC free article] [PubMed] [Google Scholar]
- 38.Mortensen HB, et al. Hvidoere Study Group on Childhood Diabetes Multinational study in children and adolescents with newly diagnosed type 1 diabetes: Association of age, ketoacidosis, HLA status, and autoantibodies on residual beta-cell function and glycemic control 12 months after diagnosis. Pediatr Diabetes. 2010;11(4):218–226. doi: 10.1111/j.1399-5448.2009.00566.x. [DOI] [PubMed] [Google Scholar]
- 39.Poulsen P, et al. Heritability of insulin secretion, peripheral and hepatic insulin action, and intracellular glucose partitioning in young and old Danish twins. Diabetes. 2005;54(1):275–283. doi: 10.2337/diabetes.54.1.275. [DOI] [PubMed] [Google Scholar]
Associated Data
This section collects any data citations, data availability statements, or supplementary materials included in this article.