

Significance
To have a full understanding of the role of nuclear motions involved in nonradiative relaxation dynamics of complex molecular systems such as carotenoids, nanomaterials, and molecular photoswitches, the ability to correlate the electronic and nuclear degrees of freedom is imperative. We have developed 2D electronic–vibrational spectroscopy to observe this correlation, and this new spectroscopic technique will provide a direct probe of the coupling between electronic and nuclear dynamics at conical intersections, and thus the underlying mechanisms driving the ensuing photochemistry.
Keywords: photon echo, ultrafast dynamics, electronic–vibrational coupling
Abstract
Multidimensional nonlinear spectroscopy, in the electronic and vibrational regimes, has reached maturity. To date, no experimental technique has combined the advantages of 2D electronic spectroscopy and 2D infrared spectroscopy, monitoring the evolution of the electronic and nuclear degrees of freedom simultaneously. The interplay and coupling between the electronic state and vibrational manifold is fundamental to understanding ensuing nonradiative pathways, especially those that involve conical intersections. We have developed a new experimental technique that is capable of correlating the electronic and vibrational degrees of freedom: 2D electronic–vibrational spectroscopy (2D-EV). We apply this new technique to the study of the 4-(di-cyanomethylene)-2-methyl-6-p-(dimethylamino)styryl-4H-pyran (DCM) laser dye in deuterated dimethyl sulfoxide and its excited state relaxation pathways. From 2D-EV spectra, we elucidate a ballistic mechanism on the excited state potential energy surface whereby molecules are almost instantaneously projected uphill in energy toward a transition state between locally excited and charge-transfer states, as evidenced by a rapid blue shift on the electronic axis of our 2D-EV spectra. The change in minimum energy structure in this excited state nonradiative crossing is evident as the central frequency of a specific vibrational mode changes on a many-picoseconds timescale. The underlying electronic dynamics, which occur on the hundreds of femtoseconds timescale, drive the far slower ensuing nuclear motions on the excited state potential surface, and serve as a excellent illustration for the unprecedented detail that 2D-EV will afford to photochemical reaction dynamics.
Two-dimensional electronic spectroscopy (2D-ES) has become an incisive tool to investigate the electronic relaxation and energy transfer dynamics of molecules, molecular aggregates, and nanomaterials (1–5). These studies have been able to separate the homogenous and inhomogeneous line widths, and identify cross-peaks associated with energy transfer between excitons of biological systems or different electronic states of systems that undergo fast nonradiative transitions. Two-dimensional IR spectroscopy (2D-IR) has proved an indispensible tool for studying vibrational couplings and ground-state structures of chemical and complex biological systems (6–8). Thus far, only 1D electronic–vibrational pump-probe spectroscopy, femtosecond stimulated Raman spectroscopy, and transient 2D-IR (t-2D-IR) are able to follow the evolution of nuclei on the ground or excited states subsequent to narrowband electronic excitation (9–12). t-2D-IR has the unique capability of being able to study the evolution of couplings between vibrations on excited potential energy surfaces (PESs).
All of the aforementioned experimental techniques, however, are insensitive to the correlation between the initial absorption to an electronically excited state and the ensuing evolution of the nuclear modes on the excited PES(s). The vibrational manifolds on the ground and excited states are intrinsically linked to the electronic potentials: The coupling between these degrees of freedom is what determines the vertical Franck–Condon factors and therefore the electronic structure of excited molecules, complexes, and materials. The ability to correlate the initial excitation of the electronic–vibrational manifold with the subsequent evolution of high-frequency vibrational modes opens many potential avenues of fruitful study, especially in systems where electronic–vibrational coupling is important to the functionality of a system. This principle is paramount to understand the rapid nonradiative transfer between two (or more) electronic states via conical intersections where the Born–Oppenheimer approximation is not necessarily valid (13). For example, the primary steps in vision that involve the cis–trans isomerization of rhodopsin (14), or the photoprotective mechanisms that rapidly deliver excited DNA bases back to the ground state (15). The ability to directly measure these correlations has hitherto remained unexplored. Here, we demonstrate a new experimental technique, 2D electronic–vibrational spectroscopy (2D-EV), that combines the advantages of 2D-ES and 2D-IR, providing the ability to correlate the initial electronic absorption and subsequent evolution of nuclear motions.
Degenerate multidimensional spectroscopy experiments have traditionally been performed in a background-free, four-wave mixing phase-matched geometry (1). With the advent and development of pulse-shaping technology, it is now possible to take advantage of techniques routinely used in NMR, such as phase cycling, and apply them to nonlinear optical spectroscopy (16). Here, we perform 2D optical measurements in a partially collinear geometry, the so-called pump-probe geometry, as pioneered in the mid-IR and electronic regimes by the groups of Zanni and Ogilvie, respectively (17, 18) and as originally envisaged by Jonas and coworker (19). Our pulse sequence and interpulse time delays are illustrated in Fig. 1A. The first visible excitation pulse, k1, creates a coherent superposition of the ground and excited electronic states. After a coherence time, t1, a second pulse, k2, converts the system into a population state, either on the ground (Fig. 1B) or excited electronic state (Fig. 1C). Following a given value of the waiting time, t2, the mid-IR probe pulse interrogates the vibrational quantum state of the system, which subsequently emits a signal, ksig, after the echo time, t3. In the pump-probe geometry, k3 and ksig are collinear, meaning that the k3 probe pulse self-heterodynes the emitted field. This has the significant advantage that the signal has a well defined phase relationship with respect to the heterodyne, k3, obviating the need to phase each 2D-EV spectrum using the projection-slice theorem (20). One disadvantage of this implementation is that the signal is not background free. The k1 and k2 pump pulse pair are created using an acousto-optic programmable dispersive filter pulse shaper (AOPDF) (21), which affords attosecond precision over interpulse time delay, t1, and accurate control over the relative carrier-envelope phase (ϕ12). In a pump-probe geometry, we can no longer take advantage of phase-matching conditions to separate all of the relevant Liouville pathways for the third-order response of the system, namely, the pump-probe signal, rephasing and nonrephasing signals (22, 23). The sum of the latter two signals comprise the total 2D spectrum of a system: a frequency–frequency correlation map of the initial absorption with the final emission. The pump-probe signal is insensitive to the relative phase of the visible pump pulses, whereas the rephasing (photon echo) and nonrephasing (free-induction decay) signals are sensitive to this phase, and thus a 2D spectrum can be obtained by phase cycling the pair of pump pulses. Each 2D-EV spectrum is created by collecting data for a series of t1 time delays and ϕ12 relative phases for a fixed t2 waiting time. The mid-IR emission is frequency dispersed onto an array detector, and thereby t3 is Fourier-transformed on the detector into its conjugate, ωIR. The data are subsequently phase-cycled (17, 18), to create a time–frequency (t1–ωIR) map, which is then apodized, zero-padded (24), and Fourier-transformed along the t1 time delay to create the frequency–frequency, ωVIS–ωIR, 2D-EV surface. A schematic of the full experimental setup is displayed in Fig. S1.
Fig. 1.
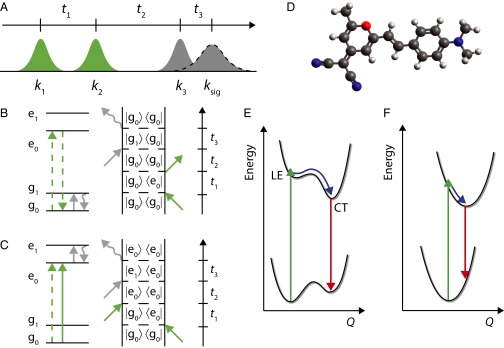
(A) Pulse ordering of electronic–vibrational experiments. The green k1 and k2 pulses represent the electronic (visible) excitation pulses, and the gray k3 and ksig pulses the vibrational (mid-IR) probe and vibrational echo pulses, respectively. Feynman and energy level diagrams for evolution on the (B) ground and (C) excited PESs. (D) Calculated DFT minimum energy ground-state structure of DCM dye. Schematic PESs for (E) the case where the first optically excited state undergoes a surface crossing to a CT state in near proximity to the vertical Franck–Condon region; and (F) for a two-level system where the Stokes shift arises from a large anharmonic shift on the excited state. The green arrows represent the initial absorption in E and F, the blue arrows represent vibrational relaxation or motion along a reaction coordinate, Q, and the red arrows represent the fluorescence.
Two-dimensional electronic spectroscopy is a penetrating tool to observe many different pathways including population transfer, electronic coupling, and coherent superpositions of various states of a system. This has the downfall that there is a degree of ambiguity in both the manifestation of pathways in a 2D spectrum and their interpretation. Fortunately 2D-EV, like other two-color 2D experiments (18, 25), has a reduced number of pathways that can contribute to a spectrum. For excitation bandwidths that are insufficient to excite one quantum of the mid-IR vibration probed (such as the experiments detailed here), we are unable to drive any wave packets in the vibration probed. Therefore, we are only sensitive to the two pathways displayed in the Feynman diagrams and associated energy level structure in Fig. 1 B and C: vibrational evolution on the ground or excited state. Note that we have only displayed the rephasing pathway for each signal. The respective nonrephasing signals of the pathways depicted in Fig. 1 B and C, which have the conjugate evolution in the t1 coherence, are not displayed. In 2D-EV experiments, the rephasing and nonrephasing pathways contain identical information because the period of the high-frequency vibration is far longer than that of the electronic coherence.
To demonstrate this new experimental technique, we apply it to the laser dye 4-(di-cyanomethylene)-2-methyl-6-p-(dimethylamino)styryl-4H-pyran (DCM), a model push-pull emitter (26). The calculated ground-state structure of DCM is displayed in Fig. 1D. The excited-state dynamics of DCM have been extensively studied, but the role of a charge-transfer (CT) state, especially in polar solvents, has remained inconclusive. DCM exhibits a substantial solvatochromatic Stokes shift. In dimethyl sulfoxide (DMSO), the static Stokes shift (λ) is 5,200 cm−1 (see Fig. S2 for the absorption and fluorescence spectra in DMSO-d6) but is only 3,200 cm−1 in n-hexane (27). This difference in Stokes shift is also accompanied by a commensurate difference in the fluorescence quantum yield, which varies by two orders of magnitude between nonpolar and polar solvents (27, 28). There are currently two models for excited-state relaxation of DCM: (i) The first electronically excited state, S1, is a valence or locally excited (LE) state that undergoes fast nonradiative decay into a lower-lying CT state (CT state between the dimethylaniline and pyran rings) and emission from CT state dominates the fluorescence quantum yield (29–34). This case is illustrated schematically in Fig. 1E. Some studies argue that the LE → CT surface crossing is accompanied by an excited-state isomerization or twisted intermediate (29, 30, 33, 34). The other proposed model (ii), illustrated in Fig. 1F, is that the S1 state is CT in character and therefore has an anharmonically displaced potential compared with the S0, which gives rise to the large vibrational Stokes shift (26, 35). The one prevailing conclusion from all of these studies is that the emissive state has some CT character.
Here, we demonstrate the first implementation (to our knowledge) of the new 2D-EV experimental method, tracking the evolution of the electronic excitation and simultaneously the associated changes in nuclear geometry with femtosecond time resolution. We are able to differentiate between the two proposed mechanisms leading to the observed large Stokes shift of DCM in DMSO-d6 and propose a mechanism based on observed shifts along the electronic and visible axes of 2D-EV spectra and their respective timescales.
Electronic–Vibrational Spectroscopy
Fig. 2 displays the 1D visible broadband excitation pump, mid-IR probe spectrum as a function of t2 waiting time. Negative features represent evolution of high-frequency vibrations on the excited PES, whereas positive signals are signatures of ground-state vibrations. The line width of the positive feature at 1,550 cm−1 does not evolve with increasing t2 waiting time, as expected for a ground-state vibration. Our ground-state density functional theory (DFT) calculation shows that the nuclear motion associated with this frequency is spread across the pyran and dimethylaniline aromatic rings and returns an energy for this mode in good accord with the linear FT-IR spectrum (Fig. S3). The excited-state vibration, initially centered at ∼1,480 cm−1, shows a shift to higher frequency (10 cm−1) as a function of increasing pump-probe time delay. The central frequency of this band was fitted to the sum of two exponentials with 270-fs and 2.9-ps time constants. The excited-state vibrations at 1,510 and 1,580 cm−1 broaden slightly throughout the first few picoseconds, but the central frequencies do not change noticeably. The kinetics for the latter two excited-state vibrations grows in on a picosecond timescale. We believe this is because they spectrally overlap with the ground-state vibrational bands at ∼1,600 cm−1 and 1,550 cm−1, contaminating their kinetics and evolution (34). This is further reenforced as the frequency-resolved pump-probe spectra for single t2 time delays contain many isobestic points: the signal does not go to zero ΔT/T for probe wavelengths either side of the excited-state vibrational features at 1,510 and 1,580 cm−1. The 1,480 cm−1 band, however, is spectrally more isolated from ground-state vibrations and shows a faster initial rise, and decays with the excited-state lifetime (34).
Fig. 2.

One-dimensional electronic–vibrational pump-probe spectrum for DCM in DMSO-d6. Evolution on the ground state is represented by positive features, and on the excited state by negative features.
The shift in central vibrational frequency for the ∼1,480 cm−1 mode is consistent with a change in excited-state geometry relative to the ground state; however, it is not apparent whether the vibrational mode in question shifts because of the associated change in Huang–Rhys factor for the vibration between the LE and CT states, or upon S1 ← S0 excitation and subsequent vibrational relaxation down an anharmonic vibrational ladder. This is the only mid-IR active vibrational mode that has an associated shift in its central frequency upon electronic excitation. This specific mode, therefore, must very sensitive to the change in geometry associated with either the LE → CT transfer and/or S1 ← S0 excitation.
This 1D pump-probe spectrum does not inform us about the simultaneous changes in the electronic line shape, i.e., the many low-frequency modes and combinations of vibrational states that contribute toward the electronic absorption spectrum. How this line shape changes with respect to an orthogonal high-frequency vibration will allow us to elucidate the dominant mechanism for excited-state relaxation in DCM.
Two-dimensional electronic–vibrational spectra are shown in Fig. 3 for a series of t2 waiting times. Fig. 3A displays the 2D-EV spectra for t2 = 0 fs. There are four main features in the spectrum, as per the pump-probe spectrum (Fig. 2). The vibrational line shapes evolve as per the pump-probe spectra with t2 time. The rephasing and nonrephasing spectra contain no extra information compared with the total 2D-EV spectra, and are displayed for t2 = 4.5 ps as a function of their real, imaginary, and total values in Fig. S4. To emphasize the evolution of the ∼1,480 cm−1 feature, we have superimposed a square box over the excited-state absorption for its initial bounds at t2 = 0 fs. Within the first few hundred femtoseconds, the central wavelength shifts to higher excitation energies (250 cm−1); on a picosecond timescale the peaks in the 2D-EV spectra broaden along the electronic axis. We illustrate this by integrating over the band ωIR = 1,464–1,490 cm−1 and plot the evolution of the feature as a function of ωVIS and t2 waiting time (Fig. 4). Fitting the shift in the central wavelength of this feature, a 180 fs time constant is extracted.
Fig. 3.
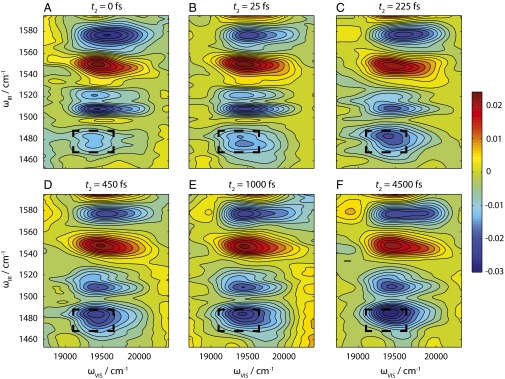
(A–F) Absorptive total 2D electronic–vibrational spectra data for displayed t2 waiting times. The dashed square box in each spectrum represents the initial position at t2 = 0 fs of the excited-state vibration at ωIR = 1,480 cm−1.
Fig. 4.

Evolution of the 1,480 cm−1 excited-state vibration along the electronic axis (ωvis) as a function of the t2 waiting time. The dashed line shows the center of the peak fitted to a biexponential function.
The time evolution of the line shapes in the 2D-EV spectra merits discussion. As t2 increases, the line shapes of the peaks evolve from rectangular (Fig. 3B, for example) to more elliptical on a picosecond timescale (Fig. 3F). The 2D-EV spectra measure the extreme cross-peak between electronic and vibrational degrees of freedom, and therefore analogy with evolution of 2D-IR and 2D-ES spectra is difficult. Peaks in 2D-EV spectra are sensitive to the correlation function between lower-frequency vibrational modes that comprise the diffuse structureless linear electronic absorption line shape (Fig. S2) and individual high-frequency vibrations on the ground or excited states. The line width along the vibrational axis represents the natural line width of the vibrational mode as dictated by the rotational constants and any low-frequency modes excited as spectators in the initial photoexcitation. These spectators are expected to relax in several picoseconds, which in turn may result in a narrowing of the line shape on the mid-IR axis. There is no spectral diffusion of vibrational modes as the initial and final vibrational states lie within the same electronic manifold, and experience correlated bath fluctuations. The visible axis, however, is susceptible to these very effects due to fluctuations of the bath affecting the ground–excited electronic state energy gap. The line width along the visible axis increases in width for all of the peaks due to spectral diffusion, as expected for simple aromatic dye molecules in solution (1, 2, 36). The precise details of such line shape evolution require further theoretical treatment and investigation.
The rapid blue shift in the electronic–vibrational line shape along the excitation axis for the 1,480 cm−1 excited-state vibration seems counterintuitive, especially given the large Stokes shift (Fig. S2). If the initially excited state were the fluorescent state, and the Stokes shift represented a large vibrational relaxation on LE, then we would expect the electronic line shape to shift to the red and outside of our laser bandwidth (18,700–20,400 cm−1). The blue shift can, however, be explained by considering the schematic in Fig. 1E and requires a small displacement along a reaction coordinate, Q, in the vertical Franck–Condon region. Upon photoexcitation, molecules are projected vertically onto the LE state close to the inner wall of the excited PES and feel a repulsive force inducing a semiballistic motion, as per the reflection principle (37). For the depicted surface in Fig. 1E, this drives molecules up in energy toward the transition state (TS) between the LE and CT states, as represented by the small barrier. The timescale of this blue shift is in accordance with a ballistic mechanism (τ = 180 fs) (Fig. 4). Furthermore, our 2D-EV spectra show that the blue shift is not reversible: Once molecules traverse the barrier associated with the TS, and exit into the CT state, they must have sufficient momentum from the initial semiballistic motion that they cannot recross the TS, and instead follow the potential toward the minimum energy of the CT state. Our experiment is not sensitive to the final part of this mechanism that occurs on the CT state, due to bandwidth constraints and overlap between the emission spectrum and the pump laser. The evolution of the vibrational coordinate is far slower, but biexponential. The faster time constant (270 fs) likely corresponds with the vibrational coordinate lagging behind the associated changes in electronic state as expected per the Born–Oppenheimer approximation, and will be limited by the mechanical frictional forces of the solvent, before LE → CT surface crossing. As soon as the TS is reached, as evidenced by the blue shift of the electronic absorption, molecules do not return, and the second 2.9-ps time constant likely represents subsequent vibrational reequilibration on the CT state.
Conclusions
We have demonstrated a new experimental technique, 2D-EV, and its application to the excited-state relaxation dynamics of DCM dye in DMSO-d6 solution. By correlating the initial visible excitation with mid-IR vibrational modes, we show that the excited-state dynamics proceed via an excited-state surface crossing between valence and CT states. The spectral blue shift evident along the electronic axis of the 2D-EV spectra represents a ballistic motion, upon Franck–Condon excitation, toward a TS between the LE and CT states. This allows us to discriminate against a model that involves direct excitation to a CT state with a large anharmonic displacement on the S1 state.
This technique is currently limited to probing the final emission in the mid-IR, which currently limits the frequency range of vibrations possible to study. With the advent of increasingly broadband laser sources in the IR (38, 39), it may be possible to extend this method to the study of very low-frequency modes, which often comprise the vibrations that couple electronic states at conical intersections. However, 2D-EV has substantial capabilities to gain understanding into nonadiabatic dynamics of molecules at conical intersections, where the Born–Oppenheimer approximation is not necessarily applicable. We expect to be able to monitor the evolution of vibrational tuning modes that drive the degeneracies between electronic states in regions close to conical intersections on the excited PES and the commensurate evolution of the electronic dynamics.
These 2D-EV measurements set a new benchmark for the level of detail and correlation that can be extracted between electronic and vibrational degrees of freedom in the condensed phase. Emerging experiments, such as 2D-EV, represent a new challenge to theoretical chemistry, whereby the details elucidated in experiments will need to be matched by theoretical calculations. The DCM system described here, may very well represent a prototypical system to test high-level quantum mechanical/molecular mechanics calculations and complement the insights gained from 2D-EV.
Methods
A schematic of the full experimental apparatus is shown in Fig. S1. The output of a commercial regenerative amplifier (Coherent; Legend Elite USP; 800 nm, 40 fs, 0.9 mJ, 1 kHz) was used to pump a homebuilt mid-IR optical parametric amplifier (OPA) and visible noncollinear optical parametric amplifier (NOPA). The output of the NOPA (515 nm, 30 nm FWHM) was subsequently compressed to 20 fs with an AOPDF pulse shaper (Dazzler, Fastlite) (21) and characterized by self-referenced interferometry using cross-polarized wave generation (Wizzler, Fastlite) (40). These devices were linked in a way that enabled an iterative feedback to correct for higher-order dispersion. The AOPDF pulse shaper was subsequently used to generate a pair of phase-locked pump pulses with precise control over the relative time delay between k1 and k2, t1, and relative carrier-envelope phase, ϕ12. These pulses were delayed on a delay stage and focused into the sample with an f = 25 cm, 90° off-axis parabolic silver mirror. At the sample position, the total power of the visible pump pulses, k1 + k2, was 270 nJ with a 350-μm spot size. The output of the mid-IR OPA was split into probe and reference pulses with a ∼50:50 ZnSe beam splitter, and both focused into the sample with an f = 15 cm, 90° off-axis parabolic gold mirror. Only the probe mid-IR probe pulse was overlapped with the visible pump. At the sample position, the power of the mid-IR pulses were measured to be ∼100 nJ (∼6 μm, 250-μm spot size) and the mid-IR pulse duration was measured to be ∼90 fs via interferometric autocorrelation. Both probe and reference IR pulses were then collimated and focused into a spectrometer and frequency dispersed onto two 64-element HgCdTe arrays (Infrared Systems Development). The mid-IR reference signal was used to normalize the probe signal laser intensities, compensating for the instability and noise intrinsic to ultrafast mid-IR laser pulse generation and detection. The relative polarization of the visible pump and mid-IR probe pulse was set to magic angle (54.7°).
For each waiting time, t2, a 2D-EV surface was recorded by incrementing the relative phase of the pump k1 and k2 pulses for fixed t1 time delays. We used a 3 × 1 × 1 phase cycling routine and rotated the frame to 1,000 nm. The coherence time delay, t1, was incremented in 0.89-fs time steps between 0 and 80 fs and therefore about double the sampling rate to satisfy the Nyquist–Shannon sampling theorem (at 1,000 nm, half the Nyquist frequency is 1.66 fs). Each data point that comprised a 2D-EV surface was acquired for 100 laser shots, and each surface was averaged three times. The 2D-EV spectra were collected for the values of t2 between –275 and 600 fs in 25-fs steps, 700 fs and 5 ps in 100-fs steps, and 6 and 20 ps in 1-ps steps.
Separate pump-probe data were acquired using the same apparatus and conditions as detailed above, except the Dazzler was used to chop the pump pulses. The pump-probe data were recorded as ΔT/T and averaged for five scans.
DFT Calculations.
DFT calculations were performed in Gaussian 09 (41) using the ωB97-xD exchange-correlation functional, a 6-311+G* basis set and a polarized solvent continuum model with appropriate dielectric constant for the DMSO solvent.
Sample.
DCM laser dye (Sigma-Aldrich) was dissolved in DMSO-d6 to make a solution with an optical density of 0.4 at the maximum visible laser intensity (515 nm) in a flow cell with a 250-μm path length (Fig. S2). The optical density of the ground-state IR transitions were ∼0.02 (Fig. S3). The sample was prepared just before the start of experiments and continuously flowed throughout the measurement. All measurements were performed at 21 °C.
Data Analysis.
A Savitzky–Golay filter was applied to the data as to remove sharp water absorptions from the signal. Careful consideration was taken in this process such that the line widths in 2D-EV were unaffected by this filter and the apodization and zero padding.
Supplementary Material
Acknowledgments
We thank Vanessa Huxter, Akihito Ishizaki, and Hui Dong for useful discussions. This work was supported by the National Science Foundation (NSF) under Contract CHE-1012168, the Director, Office of Science, Office of Basic Energy Sciences, US Department of Energy under Contract DE-AC02-05CH11231, and the Division of Chemical Sciences, Geosciences and Biosciences Division, Office of Basic Energy Sciences through Grant DE-AC03-76F000098 (at Lawrence Berkeley National Laboratory and University of California, Berkeley). We are also grateful to the College of Chemistry Molecular Graphics facility, which we used to perform our DFT calculations; this facility is funded by NSF under Contract CHE-0840505.
Footnotes
The authors declare no conflict of interest.
See Commentary on page 10031.
This article contains supporting information online at www.pnas.org/lookup/suppl/doi:10.1073/pnas.1409207111/-/DCSupplemental.
References
- 1.Hybl JD, Albrecht Ferro A, Jonas DM. Two-dimensional Fourier transform electronic spectroscopy. J Chem Phys. 2001;115(14):6606–6622. doi: 10.1063/1.4867996. [DOI] [PubMed] [Google Scholar]
- 2.Brixner T, Mancal T, Stiopkin IV, Fleming GR. Phase-stabilized two-dimensional electronic spectroscopy. J Chem Phys. 2004;121(9):4221–4236. doi: 10.1063/1.1776112. [DOI] [PubMed] [Google Scholar]
- 3.Engel GS, et al. Evidence for wavelike energy transfer through quantum coherence in photosynthetic systems. Nature. 2007;446(7137):782–786. doi: 10.1038/nature05678. [DOI] [PubMed] [Google Scholar]
- 4.Cundiff ST, et al. Optical 2-D Fourier transform spectroscopy of excitons in semiconductor nanostructures. IEEE J Sel Top Quantum Electron. 2012;18(1):318–328. [Google Scholar]
- 5.Ruetzel S, et al. Multidimensional spectroscopy of photoreactivity. Proc Natl Acad Sci USA. 2014;111(13):4764–4769. doi: 10.1073/pnas.1323792111. [DOI] [PMC free article] [PubMed] [Google Scholar]
- 6.Zheng J, et al. Ultrafast dynamics of solute-solvent complexation observed at thermal equilibrium in real time. Science. 2005;309(5739):1338–1343. doi: 10.1126/science.1116213. [DOI] [PubMed] [Google Scholar]
- 7.Hochstrasser RM. Two-dimensional spectroscopy at infrared and optical frequencies. Proc Natl Acad Sci USA. 2007;104(36):14190–14196. doi: 10.1073/pnas.0704079104. [DOI] [PMC free article] [PubMed] [Google Scholar]
- 8.Cho M. Coherent two-dimensional optical spectroscopy. Chem Rev. 2008;108(4):1331–1418. doi: 10.1021/cr078377b. [DOI] [PubMed] [Google Scholar]
- 9.Yoshizawa M, Kubo M, Kurosawa M. Ultrafast photoisomerization in DCM dye observed by new femtosecond Raman spectroscopy. J Lumin. 2000;87-89:739–741. [Google Scholar]
- 10.Herbst J, Heyne K, Diller R. Femtosecond infrared spectroscopy of bacteriorhodopsin chromophore isomerization. Science. 2002;297(5582):822–825. doi: 10.1126/science.1072144. [DOI] [PubMed] [Google Scholar]
- 11.Bredenbeck J, et al. Transient 2D-IR spectroscopy: Snapshots of the nonequilibrium ensemble during the picosecond conformational transition of a small peptide. J Phys Chem B. 2003;107(33):8654–8660. [Google Scholar]
- 12.Lynch MS, Slenkamp KM, Cheng M, Khalil M. Coherent fifth-order visible-infrared spectroscopies: Ultrafast nonequilibrium vibrational dynamics in solution. J Phys Chem A. 2012;116(26):7023–7032. doi: 10.1021/jp303701b. [DOI] [PubMed] [Google Scholar]
- 13.Domcke W, Yarkony DR. In: Conical Intersections: Electronic Structure, Dynamics and Spectroscopy. Köppel H, editor. Singapore: World Scientific; 2004. [Google Scholar]
- 14.Polli D, et al. Conical intersection dynamics of the primary photoisomerization event in vision. Nature. 2010;467(7314):440–443. doi: 10.1038/nature09346. [DOI] [PubMed] [Google Scholar]
- 15.Kohler B. Nonradiative decay mechanisms in DNA model systems. J Phys Chem Lett. 2010;1(13):2047–2053. [Google Scholar]
- 16.Tian P, Keusters D, Suzaki Y, Warren WS. Femtosecond phase-coherent two-dimensional spectroscopy. Science. 2003;300(5625):1553–1555. doi: 10.1126/science.1083433. [DOI] [PubMed] [Google Scholar]
- 17.Shim SH, Strasfeld DB, Ling YL, Zanni MT. Automated 2D IR spectroscopy using a mid-IR pulse shaper and application of this technology to the human islet amyloid polypeptide. Proc Natl Acad Sci USA. 2007;104(36):14197–14202. doi: 10.1073/pnas.0700804104. [DOI] [PMC free article] [PubMed] [Google Scholar]
- 18.Myers JA, Lewis KLM, Tekavec PF, Ogilvie JP. Two-color two-dimensional Fourier transform electronic spectroscopy with a pulse-shaper. Opt Express. 2008;16(22):17420–17428. doi: 10.1364/oe.16.017420. [DOI] [PubMed] [Google Scholar]
- 19.Faeder SG, Jonas DM. Two-dimensional electronic correlation and relaxation spectra: Theory and model calculations. J Phys Chem A. 1999;103(49):10489–10505. [Google Scholar]
- 20.Hybl JD, Albrecht AW, Gallagher Faeder SM, Jonas DM. Two-dimensional electronic spectroscopy. Chem Phys Lett. 1998;297(3-4):307–313. [Google Scholar]
- 21.Tournois P. Acousto-optic programmable dispersive filter for adaptive compensation of group delay time dispersion in laser systems. Opt Commun. 1997;140(4-6):245–249. [Google Scholar]
- 22.Mukamel S. Principles of Nonlinear Optical Spectroscopy. Oxford: Oxford Univ Press; 1995. [Google Scholar]
- 23.Cho M. Two-Dimensional Optical Spectroscopy. Boca Raton, FL: CRC; 2009. [Google Scholar]
- 24.Harris FJ. On the use of windows for harmonic analysis with the discrete Fourier transform. Proc IEEE. 1978;66(1):51–83. [Google Scholar]
- 25.Rubtsov IV, Wang J, Hochstrasser RM. Dual-frequency 2D-IR spectroscopy heterodyned photon echo of the peptide bond. Proc Natl Acad Sci USA. 2003;100(10):5601–5606. doi: 10.1073/pnas.0931292100. [DOI] [PMC free article] [PubMed] [Google Scholar]
- 26.Boldrini B, Cavalli E, Painelli A, Terenziani F. Polar dyes in solution: A joint experimental and theoretical study of absorption and emission band shapes. J Phys Chem A. 2002;106(26):6286–6294. [Google Scholar]
- 27.Bondarev SL, Knyukshto VN, Stepuro VI, Stupak AP, Turban AA. Fluorescence and electronic structure of the laser dye DCM in solutions and in polymethylmethacrylate. J Appl Spectrosc. 2004;71(2):194–201. [Google Scholar]
- 28.Lesiecki M, Asmar F, Drake JM, Camaioni DM. Photoproperties of DCM. J Lumin. 1984;31-32:546–548. [Google Scholar]
- 29.Marguet S, Mialocq JC, Millié P, Berthier G, Momicchioli F. Intramolecular charge transfer and trans-cis isomerization of the DCM styrene dye in polar solvents. A CS INDO MRCI study. Chem Phys. 1992;160(2):265–279. [Google Scholar]
- 30.Martin MM, Plaza P, Meyer YH. Ultrafast intramolecular charge transfer in the merocyanine dye DCM. Chem Phys. 1995;192(3):367–377. [Google Scholar]
- 31.Kovalenko SA, Ernsting NP, Ruthmann J. Femtosecond hole-burning spectroscopy of the dye DCM in solution: The transition from the locally excited to a charge-transfer state. Chem Phys Lett. 1996;258(3-4):445–454. [Google Scholar]
- 32.van der Meulen P, Zhang H, Jonkman AM, Glasbeek M. Subpicosecond solvation relaxation of 4-(dicyanomethylene)-2-methyl-6-(p-(dimethylamino)styryl)-4H-pyran in polar liquids. J Chem Phys. 1996;100(13):5367–5373. [Google Scholar]
- 33.Yoshizawa M, Kurosawa M. Femtosecond time-resolved Raman spectroscopy using stimulated Raman scattering. Phys Rev A. 1999;61:013808. [Google Scholar]
- 34.Van Tassle AJ, Prantil MA, Fleming GR. Investigation of the excited state structure of DCM via ultrafast electronic pump/vibrational probe. J Phys Chem B. 2006;110(38):18989–18995. doi: 10.1021/jp0603738. [DOI] [PubMed] [Google Scholar]
- 35.Petsalakis ID, et al. Theoretical investigation on the effect of protonation on the absorption and emission spectra of two amine-group-bearing, red “push-pull” emitters, 4-dimethylamino-4′-nitrostilbene and 4-(dicyanomethylene)-2-methyl-6-p-(dimethylamino)styryl-4H-pyran, by DFT and TDDFT calculations. J Phys Chem A. 2010;114(17):5580–5587. doi: 10.1021/jp100338d. [DOI] [PubMed] [Google Scholar]
- 36.Fleming GR, Cho M. Chromophore-solvent dynamics. Annu Rev Phys Chem. 1996;47:109–134. [Google Scholar]
- 37.Schinke R. Photodissociation Dynamics. Cambridge, UK: Cambridge Univ Press; 1995. [Google Scholar]
- 38.Cheng M, Reynolds A, Widgren H, Khalil M. Generation of tunable octave-spanning mid-infrared pulses by filamentation in gas media. Opt Lett. 2012;37(11):1787–1789. doi: 10.1364/OL.37.001787. [DOI] [PubMed] [Google Scholar]
- 39.Petersen PB, Tokmakoff A. Source for ultrafast continuum infrared and terahertz radiation. Opt Lett. 2010;35(12):1962–1964. doi: 10.1364/OL.35.001962. [DOI] [PubMed] [Google Scholar]
- 40.Oksenhendler T, Coudreau S, Forget N, Crozatier V. Self-referenced spectral interferometry. Appl Phys B. 2010;99(1-2):7–12. [Google Scholar]
- 41.Frisch MJ, et al. 2009. Gaussian 09 (Gaussian, Inc., Wallingford, CT)
Associated Data
This section collects any data citations, data availability statements, or supplementary materials included in this article.