

Significance
Most of the single miRNA gene knockouts display no developmental phenotype. Here, we report that simultaneous inactivation of two functionally overlapping miRNAs, miR-34b/c and miR-449, led to a sexually dimorphic partial perinatal lethality, growth retardation and sterility. Multiple underlying developmental defects, including underdevelopment of the basal forebrain structures, a lack of motile cilia in trachea and oviduct, severely disrupted spermatogenesis and oligoasthenoteratozoospermia, result from the dysregulation of ∼240 target genes that are mainly involved in three major cellular functions, including cell fate control, brain development and microtubule dynamics. This study provides physiological evidence demonstrating an essential role of miR-34b/c and miR-449 in normal brain development, motile ciliogenesis and spermatogenesis.
Keywords: forebrain, egg transport, airway obstruction, oviduct
Abstract
Ablation of a single miRNA gene rarely leads to a discernable developmental phenotype in mice, in some cases because of compensatory effects by other functionally related miRNAs. Here, we report that simultaneous inactivation of two functionally related miRNA clusters (miR-34b/c and miR-449) encoding five miRNAs (miR-34b, miR-34c, miR-449a, miR-449b, and miR-449c) led to sexually dimorphic, partial perinatal lethality, growth retardation, and infertility. These developmental defects correlated with the dysregulation of ∼240 target genes, which are mainly involved in three major cellular functions, including cell-fate control, brain development and microtubule dynamics. Our data demonstrate an essential role of a miRNA family in brain development, motile ciliogenesis, and spermatogenesis.
MicroRNAs (miRNAs) comprise a highly conserved set of small RNA species encoded by eukaryotic genomes. miRNAs exert their function posttranscriptionally by binding the 3′ UTRs of their target mRNAs, thereby controlling mRNA stability and translational efficiency (1, 2). One miRNA can target numerous mRNAs, whereas the 3′ UTR of a particular mRNA can be bound by multiple miRNAs. Therefore, miRNAs and their target mRNAs form an interwoven regulatory network characterized by a reciprocal “one-to-multiple” relationship, which has been hypothesized as a “fail-safe” mechanism to control gene expression (1, 3).
Many miRNA genes exist in clusters and thus are cotranscribed and processed (3–5). Moreover, many miRNAs contain the same seed sequences and, by definition, belong to functionally related miRNA families (6, 7). For example, the miR-449 miRNA cluster encodes three miRNAs (miR-449a, miR-449b, and miR-449c), and the miR-34b/c cluster encodes two (miR-34b and miR-34c) (8–11). All five miRNAs have the same seed sequence, which is also shared by another miRNA, miR-34a (8, 9, 11). Therefore, these six miRNAs form a functionally related miRNA family. Single KO mice deficient of miR-34a, miR-34b/c, or miR-449 display no discernible phenotype, however (8, 11, 12).
Given the overlapping spatiotemporal expression patterns between miR-34b/c and miR-449 in the testis (8), we generated double KO (dKO) mice lacking both miRNA clusters. Here we report that the miR-34b/c and miR-449 clusters are functionally redundant and, importantly, that simultaneous inactivation of these two miRNA clusters disrupts their target genes involved in cell fate control, brain development, and microtubule dynamics, leading to underdeveloped basal forebrain structures, absence of motile cilia in trachea and oviducts, and severely disrupted spermatogenesis.
Results and Discussion
Expression of One miRNA Cluster Increases When the Other Cluster Is Inactivated.
Using miRNA qPCR analyses, we examined the expression of all five miRNAs in 11 murine organs (Fig. 1A). Consistent with previous data (8), the testis displayed the most abundant expression of all five miRNAs (Fig. 1A). Other organs with detectable levels of more than one of the five miRNAs included ovary, brain, and lung. Inactivation of either the miR-34b/c or the miR-449 cluster does not cause any discernible phenotype (8, 11, 12). Given the functional redundancy, it is likely that a lack of one of the two miRNA clusters could have been compensated for by the other cluster. To investigate the physiological roles of this miRNA family, we generated miR-34b/c and miR-449 dKO mice (SI Appendix, Fig. S1). All five miRNAs in four organs of the dKO mice, including brain, testis, ovary, and lung, were absent, confirming complete inactivation of the two miRNA clusters (Fig. 1 B–E).
Fig. 1.

Expression profiles of the five miRNAs (miR-34b, miR-34c, miR-449a, miR-449b, and miR-449c) encoded by the miR-34b/c and miR-449 clusters in multiple organs of WT and KO mice. (A) Relative expression levels of the five miRNAs in 11 organs of WT mice. Expression levels of the five miRNAs were first determined using TaqMan-based qPCR analyses. Relative levels are represented by fold changes, which were calculated by designating the levels in lung as 1. Undetectable Ct values were considered no expression. (B–E) Fold changes in expression levels of the five miRNAs in single-KO (miR-34b/c−/− or miR-449−/−) and double-KO (miR-34−/−; miR-449−/−) mice compared with the WT controls. Expression levels of the five miRNAs were first determined using TaqMan-based qPCR analyses, and fold changes were then calculated by designating the WT levels as 1. Four organs expressing the five miRNAs (A), including brain (B), testis (C), ovary (D), and lung (E), were analyzed. In miRNA qPCR analyses, U6 was used as a loading control, and values were calculated based on the relative quantification (ΔΔCt) method. All qPCR assays were performed in biological triplicates.
Intriguingly, levels of miR-449a and miR-449c were significantly increased in miR-34b/c–null brain, whereas levels of miR-34b and miR-34c were elevated in miR-449–null brain (Fig. 1B). Similar changes, but to a lesser extent, were observed in the testis of single KO mice (Fig. 1C). Increased expression of miR-449a/b/c, however, was observed in miR-34b/c–null ovaries and lungs, but there was no concomitant increase of miR-34b/c in miR-449–null ovaries and lungs (Fig. 1 D and E). This inverse relationship between the expression of one of the two miRNA clusters when the other is inactivated may reflect a compensatory effect owing to their functional redundancy.
Sexually Dimorphic Partial Perinatal Lethality and Growth Retardation in dKO mice.
Although single KO of either miR-34b/c or miR-449 does not cause any abnormalities (8, 12), dKO mice tended to die at ∼postnatal day 7 (P7), and these dKO pups were grossly smaller than their double-heterozygous (miR-34b/c+/−; miR-449+/−) or “triple-negative” (miR-34b/c−/−; miR-449+/− or miR-34b/c+/−; miR-449−/−) littermates (SI Appendix, Fig. S2). Analyzing the birth record of a total of 383 pups from the triple-negative breeding pairs (SI Appendix, Fig. S1), we found an average lethality rate of ∼46% for dKO mice (Fig. 2A). Notably, sexual dimorphism was observed between the dKO pups, with ∼57% of the male and ∼31% of the female dKO pups dying by ∼P7 (Fig. 2A). The lethality rate described above could have been greater had dKO pups not been transferred to foster mothers or had their normal littermates not been removed to improve the chance for dKO pups to feed. Therefore, the abnormal feeding behavior in dKO pups appeared to have contributed to the perinatal lethality phenotype. The dKO pups that survived beyond P7 did develop but generally were smaller than their double heterozygous or triple-negative littermates (SI Appendix, Fig. S2). Growth retardation was observed in dKO mice from P1 to P20, apparently more severe in the males than the females (Fig. 2B and SI Appendix, Table S1). However, the sexual dimorphism in growth retardation became less obvious after the dKO mice reached adulthood (Fig. 2C and SI Appendix, Fig. S2).
Fig. 2.

Partial perinatal lethality and growth retardation in miR-34b/c and miR-449 dKO mice. (A) Lethality rate of double heterozygous and “triple negative” (miR-34b/c−/−; miR-449+/− or miR-34b/c+/−; miR-449−/−) littermate control (con) and miR-34b/c–miR-449 dKO male (M) and female (F) pups around P7. P values < 0.01 are statistically significant. Data were based on 383 pups produced by triple-negative breeding pairs. (B) Growth curves showing the changes in body weight of double-heterozygous and triple-negative littermate control (con) and dKO male (M) and female (F) mice over the first 20 d of postnatal development (P1–P20). The number of pups (n) measured is indicated. Mean values are presented. Original mean values, SD, and P values are presented in SI Appendix, Table S1. (C) Body weight of control (con) and dKO male and dKO female mice at age 4 and 8 wk. Data are presented as mean ± SEM (n = 6). P values < 0.01 are statistically significant.
Brain Developmental Defects in dKO Mice.
Given the abundant expression of the five miRNAs in brain, it is possible that complete ablation of these miRNAs led to defective brain development, which in turn caused the feeding defects, perinatal lethality, and growth retardation in dKO mice. Because the male dKO mice appeared to be more severe in the brain-related phenotype, we examined male dKO and control (double-heterozygous littermate) brains at embryonic day 18.5 (E18.5). In coronal and sagittal sections, the dKO basal forebrain structures appeared to be smaller compared with controls. In particular, sagittal sections of the E18.5 brains showed that the area of the olfactory tubercle (OT) was significantly smaller in dKO males compared with controls (55.8 ± 6.1% vs. 100%; P < 0.005, t test) (Fig. 3). The perinatal lethality phenotype in dKO mice is most likely caused by the brain defects, because the dKO mice all have smaller basal forebrain structures, including the caudate putamen (CPu) and the OT. The CPu and OT compose a large sector of the basal forebrain, broadly interconnected with many other brain regions, and are implicated in many functions, including reward pathways, feeding, and social behaviors (13). The OT receives direct input from the olfactory bulb and also indirect input from the vomeronasal system accessory olfactory, which senses pheromone signals (13). The OT is also involved in dopamine signaling and the reward system, thereby linking odors with positive or negative emotions and motivations (13). Thus, the smaller olfactory tubercle may explain, as least in part, the feeding defects and the perinatal lethality phenotype in dKO mice.
Fig. 3.

Defects in basal forebrain structures in dKO mice. (A and B) Schematic diagram of the male basal forebrain at E18.5 showing differences in the area of the CPu and the OT between control and dKO brains. The dKO CPu area is ∼89.7% of the control, and the dKO OT is ∼55.8% of the control. (C and D) DAPI labeling of sagittal sections of the CPu at E18.5 showing that the dKO brains (n = 4) display narrow CPu regions and smaller OTs compared with control (n = 4). (Scale bars: 200 μm.) (E–H) High-magnification images of the control and dKO CPu and OT regions labeled with DAPI (E–H), βIII tubulin (E′–H′), and Nissl (E′′–H′′) in sagittal sections showing reduced size in the dKO brains compared with control. (Scale bars: 200 μm.) Pir, piriform cortex; Acb, accumbens nucleus.
Oligoasthenoteratozoospermia and Sterility in Male dKO Mice.
Male dKO mice that survived to adulthood never produced pups when bred with fertility-proven WT adult females for 6 mo, suggesting that the dKO males are sterile. We performed gross and microscopic examination of the male reproductive organs of dKO mice (Fig. 4 and SI Appendix, Fig. S3). Significant differences were observed in the weight of the epididymis, but not of the testis or seminal vesicles (SI Appendix, Fig. S4). Testicular histological examination revealed that the adult (10 wk old) dKO seminiferous epithelia were severely atrophic and disorganized, with only one or two layers of spermatogenic cells lining the basal membrane of the seminiferous tubules (Fig. 4 A–D). A smaller number of sperm (∼5–10% of that in WT) were recovered from the dKO epididymides (Fig. 4E), and these dKO sperm displayed minimal motility. Only ∼2% of the dKO epididymal sperm showed normal morphology, compared with ∼80% of sperm of normal morphology in WT males (Fig. 4 F–H). Resembling human oligoasthenoteratozoospermia (14), the dKO male mice displayed low sperm counts, low or no motility, and deformed sperm, which are most likely responsible for the male sterility phenotype. Defective meiotic progression can lead to severe germ cell depletion and thus low sperm counts, and spermiogenic disruptions usually lead to motility defects and/or sperm deformation (15). Considered together, the testicular disruptions closely correlate with the localization of the five miRNAs and likely represent the direct effects of the lack of the five miRNAs.
Fig. 4.

Disrupted spermatogenesis and oligoasthenoteratozoospermia in male dKO mice, and oviduct defects in female dKO mice. (A–D) Testicular histology of 10-wk-old WT mice (A and B) and dKO mice (C and D). (Scale bar: 20 μm.) (E) Sperm counts of WT and dKO male mice. Data are presented as mean ± SEM (n = 6). (F) Deformed sperm in dKO male mice. (Scale bar: 20 μm.) (G and H) Pie charts showing the proportional distribution of normal and deformed sperm in WT (G) and dKO (H) male mice. (I) Normal ovarian histology of dKO female mice at P60. (Scale bar: 50 μm.) (J) Number of MII oocytes retrieved from the oviducts of adult WT and dKO female mice after superovulation. Data are presented as mean ± SEM (n = 6). (K) Number of germinal vesicle (GV)-stage oocytes retrieved from the PMSG-primed ovaries of adult WT and adult dKO female mice. Data are presented as mean ± SEM (n = 6). (L) Maturation rate of WT and dKO oocytes from GV to meiosis I (MI) and meiosis II (MII) stages during a 20-h culture in vitro. Data are presented as mean ± SEM (n = 6).
Infertility Due To Cilia-Less Oviducts in dKO Females.
All dKO females were also infertile after breeding with fertility-proven WT males for 6 mo. Although follicular development appeared to be delayed between P10 and P30, likely arising from overall growth retardation, the number of developing follicles and corpora lutea in P60 dKO ovaries was comparable to that found in age-matched WT ovaries (Fig. 4I and SI Appendix, Fig. S4). Therefore, the delayed folliculogenesis might not be responsible for the infertility phenotype in dKO females. Further supporting this notion, superovulation experiments revealed that only 2–5 MII oocytes were retrieved from the oviducts of each of the dKO females after pregnant mare's serum gonadotropin (PMSG) and human chorionic gonadotropin stimulation, whereas ∼50 MII oocytes were obtained from each of the age-matched WT females at P21, P35, or P56 (Fig. 4J). Examination of the postsuperovulation ovaries detected no discernible abnormalities in dKO vs. WT control ovaries (SI Appendix, Fig. S4), suggesting no defects in folliculogenesis and ovulation. Intriguingly, when we collected germinal vesicle (GV)-stage oocytes directly from dKO ovaries primed with PMSG, the number of GV-stage oocytes collected from dKO ovaries was similar to that collected from WT ovaries (Fig. 4K), and a 20-h culture in vitro led to a similar maturation rate from GV to meiosis I (MI) and meiosis II (MII) stages in WT and dKO oocytes (Fig. 4L). These findings strongly suggest that dKO ovaries can produce normal number of oocytes, and that ovulation can occur normally, but the ovulated oocytes cannot reach the ampulla region of the oviducts.
Given that the miR-449 and miR-34 miRNA clusters have been shown to be involved in ciliogenesis in Xenopus and zebrafish (16, 17), it is possible that the oviducts of the dKO females have defective cilia, resulting in failure to capture oocytes during ovulation or transport of ovulated oocytes to the ampulla region. Indeed, histological examination revealed that ciliated cells were rarely seen in the epithelia of the dKO oviducts, and that cilia were largely absent in dKO oviducts (Fig. 5 A–D). Thus, the lack of cilia in dKO oviduct epithelia is likely responsible for the female infertility phenotype, because ovulated oocytes fail to be captured, transported, or both to the ampulla region of the oviduct.
Fig. 5.
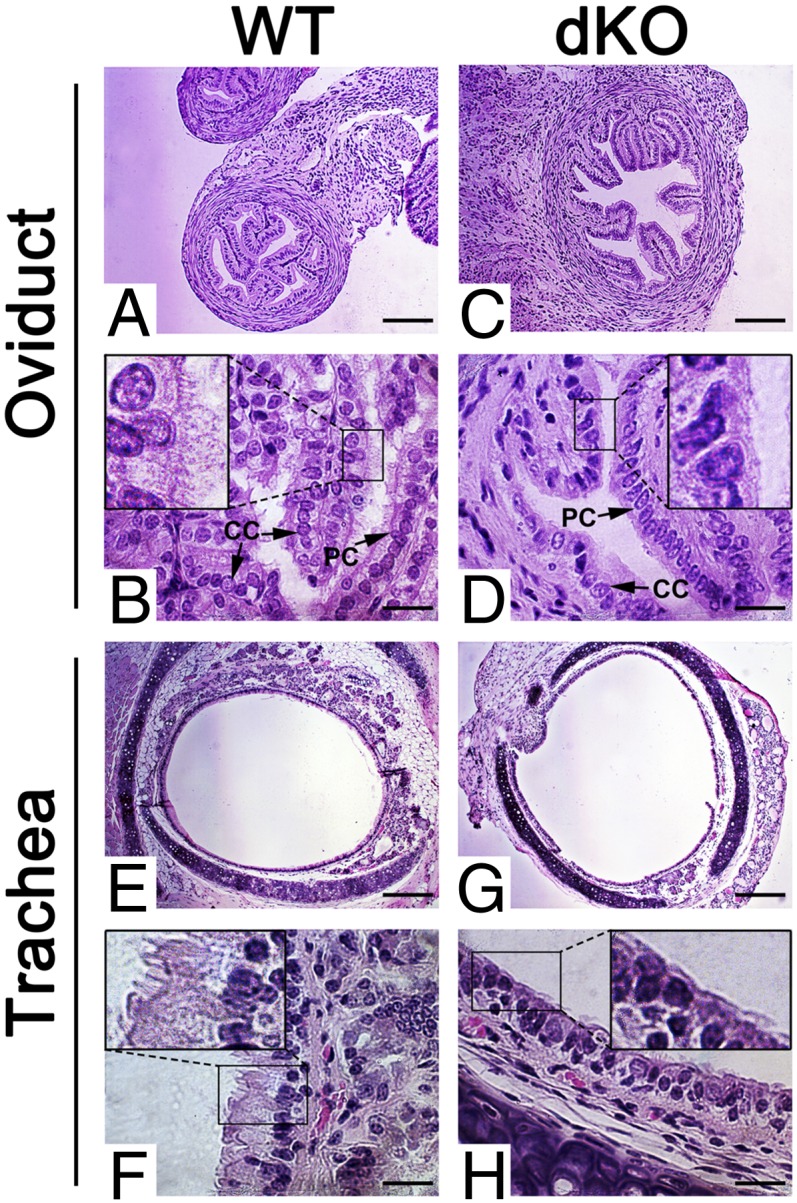
Deficiency in motile ciliogenesis in dKO mice. (A–D) Although the WT oviduct epithelia consist of both Peg cells (PC) and ciliated cells (CC) with abundant cilia pointing to the lumen (A and B), CCs and cilia are rarely seen despite the presence of PCs in the epithelia of dKO oviducts (C and D). (Insets) Digitally enlarged, framed areas in B and D. (Scale bars: 200 μm in A and C, 20 μm in B and D.) Five WT and dKO mice were analyzed, and representative images are shown. (E–H) The pseudostratified columnar epithelia of the WT trachea contain abundant cilia pointing to the lumen (E and F), whereas cilia are largely lacking in the epithelia of the dKO trachea (G and H). (Insets) Digitally enlarged and framed areas in F and H. (Scale bars: 200 μm in E and G, 20 μm in F and H). Five WT and dKO mice were analyzed, and representative images are shown.
Underdeveloped Motile Cilia in Tracheal Epithelia.
Motile cilia exist in the epithelia of two organs in mammals, the trachea and oviduct (18). Given the lack of cilia in dKO oviduct epithelia, we examined the dKO trachea. We found that cilia were largely absent in the pseudostratified epithelia of the adult dKO trachea (Fig. 5 E–H). Motile cilia in the trachea are essential for cleansing mucus from the airway, and a lack of tracheal cilia should lead to obstruction of the airway (19). Thus, we examined the histology of the lung in more detail (SI Appendix, Fig. S5). The alveolar sacs in the lungs appeared to be drastically enlarged at P5 and P11 in dKO mice (SI Appendix, Fig. S5). Although this pathology appeared to persist into adulthood, the enlargement of the alveolar sacs became less obvious in dKO lungs compared with WT control lungs (SI Appendix, Fig. S5). Because mucus cleansing is critical for the respiratory functions in perinatal development, the lack of cilia in the trachea may contribute to perinatal lethality, as well as to feeding defects related to aberrant basal forebrain development.
Dysregulation of 239 Genes Directly Targeted by the Five miRNAs Are Responsible for the Developmental Defects in dKO Mice.
Because miRNAs function mainly by affecting mRNA stability (20), we attempted to identify the target genes for the five miRNAs using an unbiased approach, RNA-Seq–based transcriptomic analyses followed by Sylamer analyses (21). A total of 2,863, 3,427, and 4,123 genes were dysregulated in dKO male brains, female brains, and testes, respectively (SI Appendix, Table S2). We performed Sylamer analyses to identify the miRNAs responsible for the dysregulated mRNAs (21). In general, the enriched seed sequences (“words with the highest peak”) were not that of the five miRNAs (SI Appendix, Figs. S6 and S7).
These data imply that the transcriptomic changes observed in those dKO organs most likely represent secondary effects. This idea is plausible, given that the organs were analyzed at P10, after the developmental defects apparently had persisted for quite some time; for example, the brain defects in dKO mice became obvious as early as E18.5 (Fig. 3). Therefore, we adopted an alternative approach by analyzing miRNA targets predicted by TargetScan (22–25) among dysregulated genes in the RNA-Seq data. Among the dysregulated mRNAs, the majority of target genes were up-regulated in male brain and testis samples (83–88%; SI Appendix, Table S3), suggesting a direct effect on target mRNA stability in the absence of the five miRNAs.
The RNA-Seq data were further validated by qPCR analyses, which demonstrated that most of the 44 representative genes displayed similar up- or down-regulation between qPCR and RNA-Seq analyses (SI Appendix, Fig. S8). GO term enrichment analyses classified the dysregulated genes into three major functional groups: cell fate control, brain development, and cytoskeleton organization (Fig. 6). Notably, 239 (SI Appendix, Table S2) out of 439 targets (SI Appendix, Table S4), including both predicted and validated, for the five miRNAs were mostly up-regulated in dKO brain and testis (SI Appendix, Table S3). GO term enrichment analyses of the dysregulated mRNAs targeted by the five miRNAs revealed that these mRNAs were also classified into the same three major functional groups as the globally dysregulated mRNAs (SI Appendix, Fig. S9). These data indicate that the transcriptomic changes detected by RNA-Seq analyses result from dysregulation of the direct targets of the five miRNAs as well as their downstream genes involved in three major cellular functions: cell fate control, brain development, and cytoskeleton organization.
Fig. 6.

GO term enrichment analyses. Analyses of dysregulated genes in dKO brains and testes reveal that the five miRNAs control 239 target mRNAs involved in three major cellular functions, including brain development, cell fate control, and cytoskeleton dynamics. Disrupted brain development, motile ciliogenesis, and spermatogenesis in dKO mice result from both the primary and secondary effects of dysregulated target genes, owing to ablation of the five miRNAs.
Among the dysregulated genes enriched in the three major GO terms, ∼4–5% were identified as direct targets of the five miRNAs (Fig. 6 and SI Appendix, Tables S2 and S3 and Datasets S1–S3), further supporting that the phenotypes observed mostly represent the effects secondary to the primary defects caused by ablation of the five miRNAs during early development. Moreover, disrupted cellular processes identified by GO term enrichment analyses appear to correlate closely with the phenotypes observed in dKO mice; for example, genes involved in cytoskeletal organization/microtubule dynamics were enriched among the dysregulated genes (Fig. 6 and SI Appendix, Table S2 and Datasets S1–S3), correlating closely with the impaired motile ciliogenesis. Overall, our unbiased mRNA profiling and GO term enrichment analyses support our tenet that the majority of the predicated target genes are truly the targets for the five miRNAs under physiological conditions, and that all of the multiple phenotypes observed—including aberrant brain development, defective motile ciliogenesis, and disrupted spermatogenesis—result from dysregulation of their direct targets as well as their downstream genes.
In summary, our work reveals an essential role of two miRNA clusters, miR-34b/c and miR-449, in normal brain development, motile ciliogenesis, and spermatogenesis. Further characterization may reveal more subtle defects, and detailed molecular analyses will define gene networks responsible for the critical developmental processes controlled by the two miRNA clusters.
Materials and Methods
Generation of miR-34b/c and miR-449 dKO Mice.
miRNA dKO mice were generated by breeding miR-34b/c−/− mice with miR-449−/− mice (8, 12). Details are provided in SI Appendix, Materials and Methods.
Small RNA Isolation and qPCR Analyses.
Small RNAs were isolated from different murine organs using the mirVana miRNA isolation kit (Ambion) according to the manufacturer’s instructions. Details are provided in SI Appendix, Materials and Methods.
mRNA Isolation and qPCR Analyses.
Total RNA was isolated using TRIzol reagent (Invitrogen) according to the manufacturer's instructions. qPCR analyses were performed as described previously (26).
Histology and Immunohistochemistry.
Histological analyses were performed as described previously (26). Preparation of the brain samples and immunofluorescent staining of βIII tubulin and NISSL were done as described previously (27, 28).
RNA-Seq and Bioinformatic Analyses.
RNA-Seq was performed using an Illumina HiSEq. 2000 sequencer (100-bp paired-end reads). RNA-Seq data were processed using Tophat (29) and Cufflinks (30) following a published protocol (31). Ingenuity (Qiagen) was used to analyze Gene Ontology terms. miRNA target genes were determined using TargetScan (22–25), and only predictions with conserved sites were considered. Sylamer analyses were also performed as described previously (21). Details are provided in SI Appendix, Materials and Methods.
Statistics.
For bioinformatic analyses, pipeline-specific statistical methods were used as described previously (21, 29–31). χ2-test was used for analyzing the data on perinatal lethality rate. Student t test was adopted for the rest of statistic analyses.
Supplementary Material
Acknowledgments
We thank Dr. Lin He, University of California Berkeley, for providing the miR-34b/c KO mice. This work was supported in part by National Institutes of Health (NIH) Grants HD060858, HD071736, and HD074573 (to W.Y.) and NS077169 (to G.S.M.); National Natural Science Foundation of China Grants 30771139 (to C.X.) and 31270029 (to J.W.); and Shanghai Natural Science Foundation Grant 12JC1405500 (to C.X.). All KO mouse lines were generated and maintained in the University of Nevada Genetic Engineering Center, supported by NIH COBRE Grant P20-RR18751. Further support for core facilities was provided by NIH Grants P20-RR016464, P20-GM103440, P20-GM103554, and P20-GM103650.
Footnotes
The authors declare no conflict of interest.
This article is a PNAS Direct Submission.
This article contains supporting information online at www.pnas.org/lookup/suppl/doi:10.1073/pnas.1407777111/-/DCSupplemental.
References
- 1.Bartel DP. MicroRNAs: Target recognition and regulatory functions. Cell. 2009;136(2):215–233. doi: 10.1016/j.cell.2009.01.002. [DOI] [PMC free article] [PubMed] [Google Scholar]
- 2.Bartel DP. MicroRNAs: Genomics, biogenesis, mechanism, and function. Cell. 2004;116(2):281–297. doi: 10.1016/s0092-8674(04)00045-5. [DOI] [PubMed] [Google Scholar]
- 3.Loh YH, Yi SV, Streelman JT. Evolution of microRNAs and the diversification of species. Genome Biol Evol. 2011;3:55–65. doi: 10.1093/gbe/evq085. [DOI] [PMC free article] [PubMed] [Google Scholar]
- 4.Janga SC, Vallabhaneni S. MicroRNAs as post-transcriptional machines and their interplay with cellular networks. Adv Exp Med Biol. 2011;722:59–74. doi: 10.1007/978-1-4614-0332-6_4. [DOI] [PubMed] [Google Scholar]
- 5.Peters J, Robson JE. Imprinted noncoding RNAs. Mamm Genome. 2008;19(7-8):493–502. doi: 10.1007/s00335-008-9139-4. [DOI] [PubMed] [Google Scholar]
- 6.Schmitt MJ, Margue C, Behrmann I, Kreis S. MiRNA-29: A microRNA family with tumor-suppressing and immune-modulating properties. Curr Mol Med. 2013;13(4):572–585. doi: 10.2174/1566524011313040009. [DOI] [PubMed] [Google Scholar]
- 7.Wong KY, Yu L, Chim CS. DNA methylation of tumor suppressor miRNA genes: A lesson from the miR-34 family. Epigenomics. 2011;3(1):83–92. doi: 10.2217/epi.10.74. [DOI] [PubMed] [Google Scholar]
- 8.Bao J, et al. MicroRNA-449 and microRNA-34b/c function redundantly in murine testes by targeting E2F transcription factor-retinoblastoma protein (E2F-pRb) pathway. J Biol Chem. 2012;287(26):21686–21698. doi: 10.1074/jbc.M111.328054. [DOI] [PMC free article] [PubMed] [Google Scholar]
- 9.Lizé M, Klimke A, Dobbelstein M. MicroRNA-449 in cell fate determination. Cell Cycle. 2011;10(17):2874–2882. doi: 10.4161/cc.10.17.17181. [DOI] [PubMed] [Google Scholar]
- 10.Lizé M, Pilarski S, Dobbelstein M. E2F1-inducible microRNA 449a/b suppresses cell proliferation and promotes apoptosis. Cell Death Differ. 2010;17(3):452–458. doi: 10.1038/cdd.2009.188. [DOI] [PubMed] [Google Scholar]
- 11.Concepcion CP, et al. Intact p53-dependent responses in miR-34–deficient mice. PLoS Genet. 2012;8(7):e1002797. doi: 10.1371/journal.pgen.1002797. [DOI] [PMC free article] [PubMed] [Google Scholar]
- 12.Choi YJ, et al. miR-34 miRNAs provide a barrier for somatic cell reprogramming. Nat Cell Biol. 2011;13(11):1353–1360. doi: 10.1038/ncb2366. [DOI] [PMC free article] [PubMed] [Google Scholar]
- 13.Wesson DW, Wilson DA. Sniffing out the contributions of the olfactory tubercle to the sense of smell: Hedonics, sensory integration, and more? Neurosci Biobehav Rev. 2011;35(3):655–668. doi: 10.1016/j.neubiorev.2010.08.004. [DOI] [PMC free article] [PubMed] [Google Scholar]
- 14.Cavallini G. Male idiopathic oligoasthenoteratozoospermia. Asian J Androl. 2006;8(2):143–157. doi: 10.1111/j.1745-7262.2006.00123.x. [DOI] [PubMed] [Google Scholar]
- 15.Yan W. Male infertility caused by spermiogenic defects: Lessons from gene knockouts. Mol Cell Endocrinol. 2009;306(1-2):24–32. doi: 10.1016/j.mce.2009.03.003. [DOI] [PMC free article] [PubMed] [Google Scholar]
- 16.Marcet B, et al. Control of vertebrate multiciliogenesis by miR-449 through direct repression of the Delta/Notch pathway. Nat Cell Biol. 2011;13(6):693–699. doi: 10.1038/ncb2241. [DOI] [PubMed] [Google Scholar]
- 17.Wang L, et al. miR-34b regulates multiciliogenesis during organ formation in zebrafish. Development. 2013;140(13):2755–2764. doi: 10.1242/dev.092825. [DOI] [PubMed] [Google Scholar]
- 18.Mitchell DR. The evolution of eukaryotic cilia and flagella as motile and sensory organelles. Adv Exp Med Biol. 2007;607:130–140. doi: 10.1007/978-0-387-74021-8_11. [DOI] [PMC free article] [PubMed] [Google Scholar]
- 19.Marshall WF, Nonaka S. Cilia: Tuning in to the cell's antenna. Curr Biol. 2006;16(15):R604–614. doi: 10.1016/j.cub.2006.07.012. [DOI] [PubMed] [Google Scholar]
- 20.Guo H, Ingolia NT, Weissman JS, Bartel DP. Mammalian microRNAs predominantly act to decrease target mRNA levels. Nature. 2010;466(7308):835–840. doi: 10.1038/nature09267. [DOI] [PMC free article] [PubMed] [Google Scholar]
- 21.van Dongen S, Abreu-Goodger C, Enright AJ. Detecting microRNA binding and siRNA off-target effects from expression data. Nat Methods. 2008;5(12):1023–1025. doi: 10.1038/nmeth.1267. [DOI] [PMC free article] [PubMed] [Google Scholar]
- 22.Friedman RC, Farh KK, Burge CB, Bartel DP. Most mammalian mRNAs are conserved targets of microRNAs. Genome Res. 2009;19(1):92–105. doi: 10.1101/gr.082701.108. [DOI] [PMC free article] [PubMed] [Google Scholar]
- 23.Garcia DM, et al. Weak seed-pairing stability and high target-site abundance decrease the proficiency of lsy-6 and other microRNAs. Nat Struct Mol Biol. 2011;18(10):1139–1146. doi: 10.1038/nsmb.2115. [DOI] [PMC free article] [PubMed] [Google Scholar]
- 24.Grimson A, et al. MicroRNA targeting specificity in mammals: Determinants beyond seed pairing. Mol Cell. 2007;27(1):91–105. doi: 10.1016/j.molcel.2007.06.017. [DOI] [PMC free article] [PubMed] [Google Scholar]
- 25.Lewis BP, Burge CB, Bartel DP. Conserved seed pairing, often flanked by adenosines, indicates that thousands of human genes are microRNA targets. Cell. 2005;120(1):15–20. doi: 10.1016/j.cell.2004.12.035. [DOI] [PubMed] [Google Scholar]
- 26.Wu Q, et al. The RNase III enzyme DROSHA is essential for microRNA production and spermatogenesis. J Biol Chem. 2012;287(30):25173–25190. doi: 10.1074/jbc.M112.362053. [DOI] [PMC free article] [PubMed] [Google Scholar]
- 27.Dugan JP, Stratton A, Riley HP, Farmer WT, Mastick GS. Midbrain dopaminergic axons are guided longitudinally through the diencephalon by Slit/Robo signals. Mol Cell Neurosci. 2011;46(1):347–356. doi: 10.1016/j.mcn.2010.11.003. [DOI] [PMC free article] [PubMed] [Google Scholar]
- 28.Nural HF, Mastick GS. Pax6 guides a relay of pioneer longitudinal axons in the embryonic mouse forebrain. J Comp Neurol. 2004;479(4):399–409. doi: 10.1002/cne.20317. [DOI] [PMC free article] [PubMed] [Google Scholar]
- 29.Trapnell C, Pachter L, Salzberg SL. TopHat: Discovering splice junctions with RNA-Seq. Bioinformatics. 2009;25(9):1105–1111. doi: 10.1093/bioinformatics/btp120. [DOI] [PMC free article] [PubMed] [Google Scholar]
- 30.Trapnell C, et al. Transcript assembly and quantification by RNA-Seq reveals unannotated transcripts and isoform switching during cell differentiation. Nat Biotechnol. 2010;28(5):511–515. doi: 10.1038/nbt.1621. [DOI] [PMC free article] [PubMed] [Google Scholar]
- 31.Trapnell C, et al. Differential analysis of gene regulation at transcript resolution with RNA-seq. Nat Biotechnol. 2013;31(1):46–53. doi: 10.1038/nbt.2450. [DOI] [PMC free article] [PubMed] [Google Scholar]
Associated Data
This section collects any data citations, data availability statements, or supplementary materials included in this article.