Abstract
The method of continuous variation in conjunction with 1H and 19F NMR spectroscopies was used to characterize lithium and sodium enolates solvated by N,N,N′,N′-tetramethylethyldiamine (TMEDA) and tetrahydrofuran (THF). A strategy developed using lithium enolates was then applied to the more challenging sodium enolates. A number of sodium enolates solvated by TMEDA or THF afford exclusively tetramers. Evidence suggests that TMEDA chelates sodium on cubic tetramers.
Introduction
Carbon–carbon bond formations using metal enolates are ubiquitous. A recent survey of large-scale procedures carried out over several decades at Pfizer revealed that 44% of these C–C bond formations involved metal enolates.1 Although lithium enolates dominate the field, metal enolates bearing a wide range of counterions proliferate.2 Sodium enolates, for example, are suggested to be decidedly more reactive than their lithium counterparts.2f However, they are less commonly used in synthesis for several reasons. The lower stability and solubility of n-butylsodium3 (n-BuNa) and sodium amides4 when compared with n-butyllithium and lithium amides make sodium enolates less accessible. Only weakly basic sodium hexamethyldisilazide,5 sodium alkoxides,6 and sodium hydride are used routinely. Moreover, empirical studies have suggested that, with few exceptions,7 the putative greater reactivity imparted by sodium relative to lithium frequently comes at the cost of lower selectivity. Nonetheless, sodium enolates maintain an important niche.8,9
We became interested in studying the influence of aggregation and solvation on the reactivity of sodium enolates with the aim of providing structural and mechanistic support to synthetic applications. Although few sodium enolates have been characterized crystallographically,10 there is no reason to doubt that further progress can be made. X-ray structures of sodium phenolates (isostructural analogues of enolates) reveal a dominance of cubic tetramers,11 although other forms have occasionally appeared.12 The challenge of determining solution structures is acute, however. The absence of detectable M–O scalar coupling that plagues all NMR spectroscopic studies of metal enolates is exacerbated by the highly quadrupolar 23Na nucleus,13 rendering the broad sodium resonances of little or no diagnostic value.14,15 In what were ambitious and pioneering studies by Zook16 and Hauser,17 colligative measurements of relatively stable sodium enolates suggested that they aggregate in solution, but the measured aggregation numbers are noninteger values spanning a wide range. In general, colligative measurements are poorly suited for mixtures and can be highly suspect owing to potentially undetectable impurities.18,19 Diffusion-ordered NMR spectroscopy (DOSY) explored extensively by Williard20 in organolithium chemistry could be brought to bear on organosodium chemistry, but no such studies have been reported to date. Of course, computational chemists have attempted to fill in the experimentally elusive details,21 but computational data offer only a complement to, not a substitute for, experimental data.22
We wondered whether the method of continuous variation (MCV)23 could be used to characterize sodium enolates. The idea is simple: mixing two salts of unknown aggregation states denoted as An and Bn (eq 1) affords an ensemble of homo- and heteroaggregates manifesting spectroscopic fingerprints and concentration dependencies that are highly characteristic of the overall aggregation number, n. We have used such a strategy in conjunction with 6Li NMR spectroscopy to characterize more than 100 enolate–solvent combinations.24
| 1 |
Can this same strategy be used with sodium enolates? Certainly not using 23Na NMR spectroscopy but possibly with a more NMR-friendly nucleus. We took a cue from the seminal study of Gagne and co-workers in which 1H NMR spectroscopy was used to characterize an ensemble of tetrameric aggregates derived from sodium tert-butoxide and sodium phenolates (Scheme 1; Ar = 4-tert-butylphenyl).25 This strategy, combined with detailed studies of their concentration dependencies with the application of MCV, could be used to characterize sodium enolates.
Scheme 1.
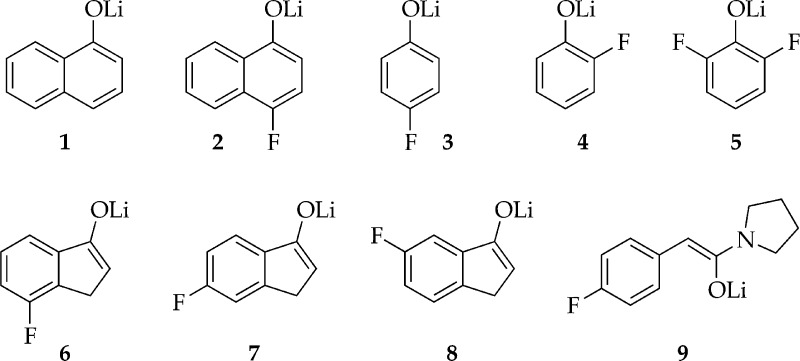
We describe herein the use of MCV in conjunction with 1H and 19F NMR spectroscopies to determine the aggregation state of alkali metal enolates. To develop tactics and strategies, we examined lithium enolates (Chart 1) with well-documented solution structures and behaviors demonstrated in previous studies.24 We then applied the same methods to characterize the sodium enolates in Chart 2, focusing on synthetically important N,N,N′,N′-tetramethylethylenediamine (TMEDA) and tetrahydrofuran (THF) solvates. Several sodium phenolates are included owing to their ease of preparation and convenient tagging with fluoro moieties as well as their central roles in pharmaceutically important O-alkylations.261H NMR spectroscopy proves more effective than 19F NMR spectroscopy in most instances.27 Despite an emphasis in this study on methods, even the preliminary results revealed that the least stable sodium enolates 15 and 16 are structurally complex in THF, and TMEDA-solvated enolates are quite different for sodium and lithium.28
Chart 1.
Chart 2.
Results
Sodium Bases
We sought sodium bases with optimal solubilities and reactivities. Highly reactive sodium bases such as n-BuNa3 and sodium diisopropylamide (NDA)4 present challenging technical problems. NDA can be prepared directly from sodium metal29 but is most often prepared from n-BuLi/t-BuONa metal exchange.3c,30 The solubility properties of solvated or ligand-free NDA rendered recrystallization difficult, and the potential complexity arising from the mixed-salt protocol was especially troubling. Sodium tetramethylpiperidide reported by Mulvey may work well but was not tested.4,31 We settled on two bases. The highly soluble NaHMDS is easily prepared and purified.2,4 It is often the base of choice, but it is insufficiently basic for some applications (especially cycloalkanone-derived enolates). Sodium isopropylcyclohexylamide (NaICA)3b has been prepared as a crystalline TMEDA solvate32 (which we consider too restrictive). We found, however, that unsolvated NaICA can be prepared as a powder and recrystallized to >90% purity. NMR spectra of NaICA solubilized with TMEDA show two forms, which we presume to be cis and trans cyclic dimers based on analogy to lithium isopropylcyclohexylamide.33 The only contaminant is the protic amine (<5%), which may be generated during NMR sample preparation. The protocols that we used for preparing ligand-free NaICA and NaHMDS as well as an improved procedure to prepare LiHMDS are described in the Experimental Section.
General Strategy
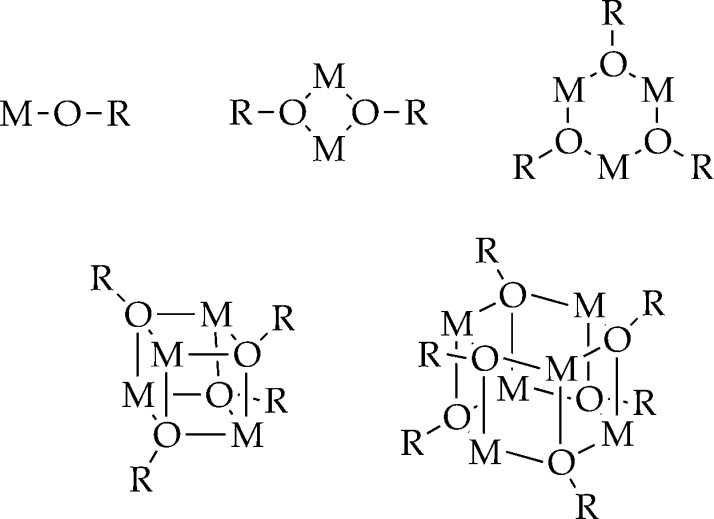
Alkali metal enolates are prone to aggregate as illustrated generically in Chart 3.34 The oppressively high symmetry, which causes these structural forms to appear deceptively simple and indistinguishable by NMR spectroscopy, is exacerbated when scalar coupling (such as 6Li–15N and 6Li–13C) cannot be used to show metal–ligand connectivities. We break the high symmetry by generating ensembles of homo- and heteroaggregates from enolate subunits A and B as illustrated in eq 1. Monitoring the homo- and heteroaggregates versus mole fraction of subunits A and B (XA and XB) reveals a distribution in which the number, symmetries, and mole fraction dependencies are characteristic of the aggregation state. Application of MCV affords what is referred to colloquially as a Job plot.23 Subsequent examples are illustrative.
Chart 3.
The prominent technical challenge is to obtain adequate spectroscopic resolution of the enolate ensembles. 6Li NMR spectroscopy suffices for lithium enolates and has been exploited extensively.24 Sodium enolates, by contrast, require the monitoring of resonances emanating from organic fragments using 1H or 19F NMR spectroscopies (19) rather than the monitoring of a nucleus within the O–M aggregate core. The obvious advantage of monitoring the vinyl proton (19; red) is that it requires no explicit tag. We were concerned at the outset (albeit incorrectly) that resolution might be inadequate and, in some cases, that complex splitting by other protons would be problematic. 19F NMR spectroscopy offered the potential for high resolution but required that at least one enolate contains a fluoro moiety (19; blue).
19F NMR Spectroscopy
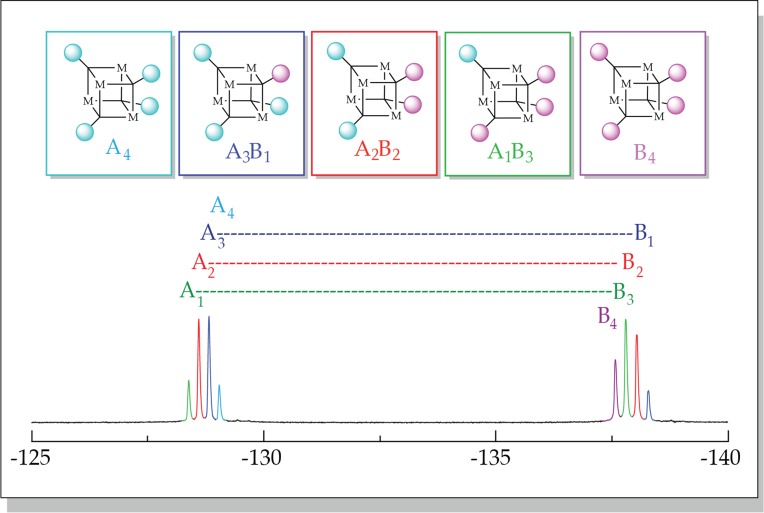
The methods for determining aggregation states are identical for 1H or 19F NMR spectroscopy. We illustrate them with 19F NMR spectroscopy using an ensemble generated from phenolates 2 and 3 that both contain a fluorine tag. Having tags on both enolates is by no means necessary, but this starting point is pedagogically useful. Lithium phenolates 2 and 3 prove to be tetrameric and well behaved. Figure 1 shows the 19F NMR spectrum of an approximate 1:1 mixture of 2 and 3. We refer to groups of resonances stemming from a single subunit (A or B) as envelopes. The two discrete envelopes of four resonances correspond to four of the five tetrameric aggregates containing that particular 19F tag in each envelope; one complementary homoaggregate is missing from each envelope. Accounting for the number of 19F nuclei per aggregate affords the relative aggregate concentrations and reveals that the aggregate distribution reflected by Figure 1 is nearly statistical. The slight difference between the two envelopes results in part from a minor deviation from the intended 1:1 stoichiometry. Seemingly systematic changes in the chemical shifts in Figure 1 with the shifting composition are common but somewhat deceptive; the chemical shift orderings of the resonances vary with different enolate pairings.
Figure 1.
19F NMR spectra of a 1:1 mixture of tetrameric lithium phenolates 2 (A) and 3 (B) at 0.10 M total phenolate concentration in 0.50 M THF/toluene. The envelope of resonances corresponds to subunit A (left) and subunit B (right). The color code indicates affiliation with the five homo- and heteroaggregates shown above.
Monitoring the ensemble of aggregates represented in Figure 1 versus enolate mole fractions (XA or XB) at a fixed total enolate concentration reveals the changing aggregate proportions (Figure 2). Plotting the relative aggregate concentrations versus XA affords the Job plot in Figure 3.35 The relative concentrations are determined by accounting for the differential number of 19F nuclei per aggregate. When, as in this case, both subunits contain visible and well-resolved envelopes of resonances, simply adding the integrations for each aggregate from the two envelopes of resonances is expedient. The parametric fits shown have been described previously.24 The mole fraction, XA, is what we call the measured mole fraction—the mole fraction derived from the relative integrations rather than the intended mole fractions. Ascertaining the mole fraction from the integrations renders the method robust by providing more accurate values for XA as well as eliminating problems arising from unwanted impurities, standard experimental error, and multiple aggregation states. Using the measured mole fraction is optional in this application but becomes imperative when one of the subunits is NMR-silent (vide infra).
Figure 2.
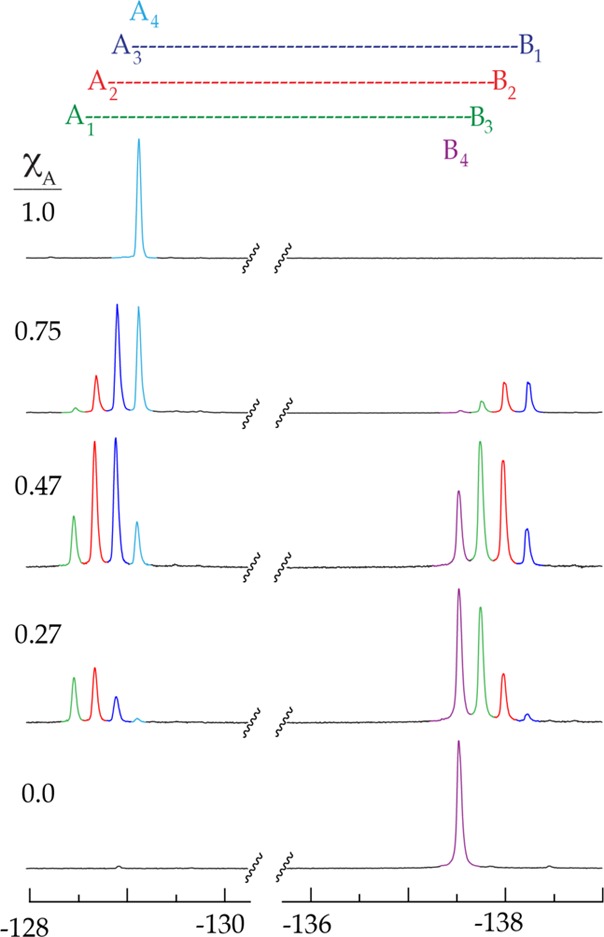
19F NMR spectra of mixtures of tetrameric lithium phenolates 2 (A) and 3 (B) at 0.10 M total phenolate concentration in 0.50 M THF/toluene. The envelopes of resonances correspond to subunit A (left) and subunit B (right). The color code indicates affiliation with the five homo- and heteroaggregates shown above. XA corresponds to the measured mole fraction ascertained from the relative integrations.
Figure 3.
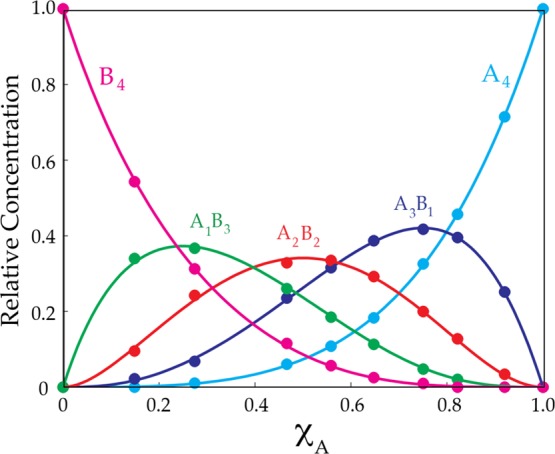
Job plot showing the relative concentrations of tetrameric homo- and heteroaggregates versus measured mole fractions of 2 (XA) for 0.10 M mixtures of lithium phenolates 2 (A) and 3 (B) in 0.50 M THF/toluene at −80 °C. (See Figure 2.) All aggregates are represented by summing the integrations of each aggregate within the two envelopes of resonances.
The example above exploits two envelopes of resonances to view a single ensemble of aggregates, but this degeneracy is neither required nor necessarily desirable. Often only one of two envelopes is well-resolved. More important, we envisioned the potential of using 19F NMR spectroscopy to probe the structures of unfluorinated enolates. Using a single envelope of resonances, however, markedly impacts how the data are processed in ways that demand careful elaboration. We illustrate the point using a mixture of phenolates 1 and 3 in which only 3 has a fluorine tag. Monitoring the ensemble illustrated in Figure 4 versus mole fraction affords the Job plot in Figure 5. The logic is described as follows.
Figure 4.

19F NMR spectra of lithium phenolates 1 (A) and 3 (B) at 0.10 M total concentration in 0.50 M propylamine/toluene at −80 °C. Only B contains a fluorine, rendering A4 spectroscopically invisible.
Figure 5.
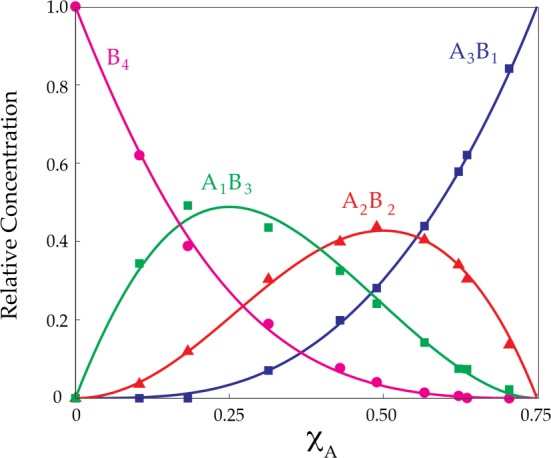
Job plot showing the relative integrations of tetrameric homo- and heteroaggregates versus measured mole fractions of 1 (XA) for 0.10 M mixtures of lithium phenolates 1 (A) and 3 (B) in 0.50 M propylamine/toluene at −80 °C. (See Figure 4.) The relative concentrations include corrections for the number of 19F nuclei in each aggregate. The curves result from a parametric fit.
Given any aggregation state, n, there will be a total of n + 1 homo- and heteroaggregates but only n of them will be visible owing to the NMR silence of one homoaggregate. The left-hand y-intercept in Figure 4 corresponds to the measured mole fraction XA = 0; enolate A is absent. In the limit of high A, however, the Job plot becomes more abstract. As XA approaches unity and the spectroscopically silent A4 homoaggregate becomes dominant, the only remaining observable species is the A3B1 heteroaggregate. As the real mole fraction of A approaches unity—as the added B becomes very low—the concentration of A3B1 approaches zero in the limit, but the relative concentration of A3B1 among the observable aggregates approaches unity. Moreover, the measured mole fraction XA in Figure 4 necessarily approaches only 0.75 because it represents the measured mole fraction of A among the spectroscopically observable aggregates.
Admittedly, the treatment in Figure 5 has some abstraction. The good news is that the Job plot of a tetrameric enolate missing one homotetramer is visually and mathematically similar to a Job plot corresponding to that of a trimer24,36 and that pattern holds true for all aggregates: n-mers take on the visual appearance and are mathematically treated as (n – 1)-mers. The mathematical treatment for all aggregates is fully developed.24 The asymmetry in Figure 5 is caused by a minor deviation from statistical behavior. The maxima in Figure 5 are all found at the appropriate measured mole fraction corresponding to their stoichiometries, consistent with standard Job plots.23
1H NMR spectroscopy
Ensembles monitored using 1H NMR spectroscopy are treated as described above. We illustrate the point using sodium enolates, for which 1H NMR spectroscopy proved especially successful. Figure 6 shows representative spectra in which envelopes of resonances derived from sodium enolates 11 and 13 are well-resolved. Although unnecessary in this case, single-frequency decoupling is occasionally needed to sharpen the resonances. The Job plot derived from the two pairs of sodium enolates is shown in Figure 7.
Figure 6.
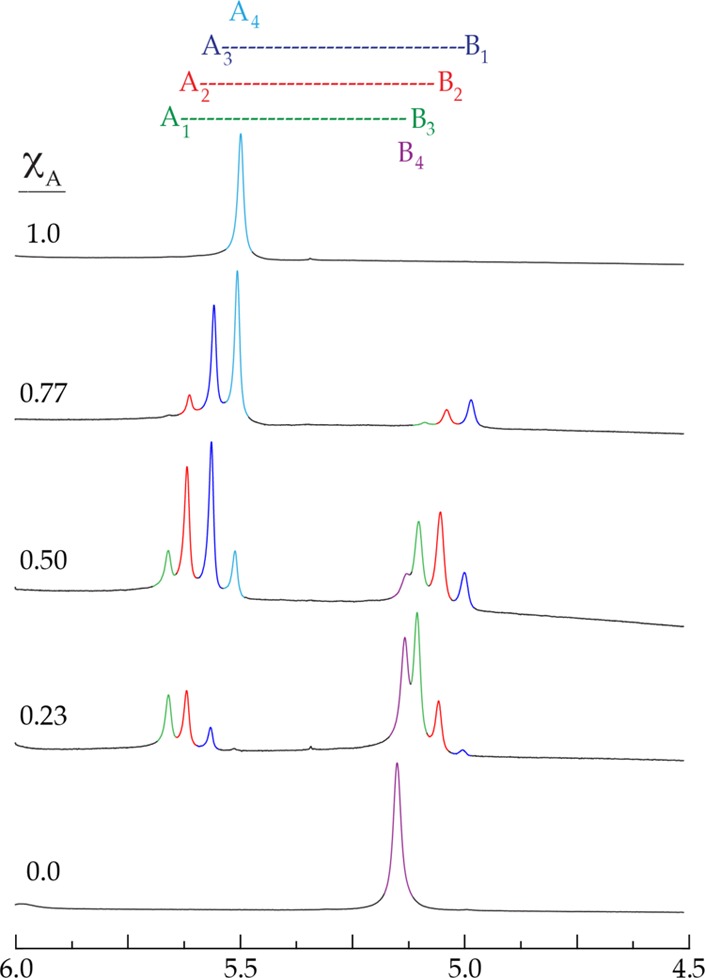
1H NMR spectra of sodium enolates 11 (A) and 13 (B) at 0.10 M total concentration in 0.50 M TMEDA/toluene-d8 at varying XA recorded at −80 °C.
Figure 7.
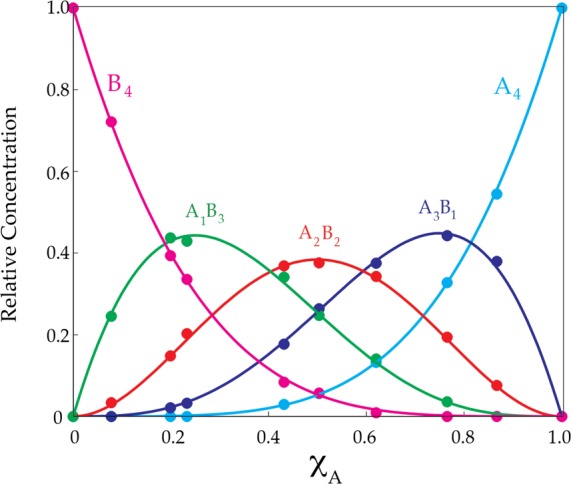
Job plot showing the relative concentrations of tetrameric homo- and heteroaggregates versus measured mole fractions of 11 (XA) for 0.10 M mixtures of sodium enolates 11 (A) and 13 (B) in 0.50 M TMEDA/toluene-d8 at −80 °C. The relative concentrations are obtained by simply summing the integrations of each aggregate represented in the two envelopes of resonances. (See Figure 6.).
Lithium Enolates and Phenolates
The results for the lithium enolates and phenolates used to develop the protocols are listed in Table 1. The spectra and affiliated Job plots are archived in Supporting Information. Previous studies using 6Li NMR spectroscopy in conjunction with MCV have revealed the structures of the enolates in Chart 1 (except 6 and 9). In several instances, the high sensitivity of 19F NMR spectroscopy allowed us to detect a previously undetected minor ensemble. Despite the large chemical shift window, the 19F resonances broaden at low temperature and do not resolve. For cases in which one of the two envelopes of resonances did not resolve, the unresolved envelope could be integrated, and the contribution from the second homoaggregate was extracted to provide a standard Job plot showing all species. In practice, this trick works for dimers but is challenging for tetramers.
Table 1. Characterization of Lithium Phenolates and Enolates in Solution Using 19F and 1H NMR Spectroscopies.

Typically recorded using 5.0 equiv of ligand in toluene as the bulk solvent.
Only 3 was visible in the 19F NMR spectrum, resulting in singly tagged Job plots. In all other instances, both substrates were visible, affording Job plots showing all aggregates.
Sodium Enolates and Phenolates
We used exclusively 1H NMR spectroscopy to characterize sodium enolates solvated by TMEDA and THF (Table 2) owing to the surprisingly poor resolution using 19F NMR spectroscopy. A representative example is shown in Figures 6 and 7 above.
Table 2. Sodium Enolate Tetramers Characterized Using the Method of Continuous Variation and 1H NMR Spectroscopy.
| substrate pairs An/Bn | liganda |
|---|---|
| 10/16 | TMEDA |
| 11/13 | |
| 12/15 | |
| 13/14 | |
| 10/11 | THF |
| 11/12 | |
| 11/13 | |
| 11/14 | |
| 17/18 |
Typically recorded using 5.0 equiv of ligand in toluene as the bulk solvent.
TMEDA-solvated enolates showed a penchant for forming tetramers rather than the anticipated dimers (although in some cases an additional aggregate could be detected).37 We demonstrated that TMEDA was bound as an η2 (chelated) rather than η1 (unchelated) ligand by showing that Me2NEt and Me2N-n-Bu, which are nonchelating TMEDA surrogates, failed to mimic TMEDA by affording intractable structures. Whether all sodium nuclei within a cube are chelated by TMEDA is discussed below.
The results for simple cycloalkanones were confusing at the outset. Enolization of cyclohexanone and cyclopentanone using either NaHMDS/TMEDA or NaICA/TMEDA afforded enolates 15 and 16 (Figure 8a). By contrast, enolization with NaHMDS/THF afforded no detectable enolate, and enolization with more basic NaICA/THF yielded broad mounds in the 1H NMR spectra (Figure 8b). Treating the cycloalkanones with NaICA/THF and subsequently adding TMEDA, however, afforded the TMEDA solvates cleanly (Figure 8c), showing that enolizations in THF are adequate, but structural control is poor. The origins of the structural complexity are unknown at this point.
Figure 8.
1H NMR spectra recorded on 0.10 M 15 generated from 1.0 equiv NaICA in ligand/toluene-d8 solution. The ligands are as follows: (a) 5.0 equiv TMEDA, (b) 5.0 equiv THF, and (c) 5.0 equiv THF with addition of 5.0 equiv TMEDA subsequent to enolization.
Discussion
Summary
We undertook a series of structural studies of alkali metal enolates using MCV in conjunction with 1H and 19F NMR spectroscopies. Lithium enolates known from previous studies to give high structural control were used to develop the methods (Chart 1) and distinguish failed strategies from failed chemistry. We then directed our attention to the more challenging sodium enolates (Chart 2), which are emblematic of metal salts bearing metal nuclei that resist NMR spectroscopic examination.
By example, a 1:1 mixture of two fluorine-tagged enolates afford two envelopes of 19F resonances highly characteristic of an ensemble of enolate tetramers (Figure 1). Each envelope shows four of the five homo- and heteroaggregates; the fifth is unobservable because it lacks that particular tag. Monitoring the relative aggregate concentrations versus mole fraction (X) affords a series of spectra (Figure 2) and an affiliated Job plot showing the relative concentrations of all five tetrameric forms (Figure 3). Using 1H NMR spectroscopy to monitor the enolate vinyl resonance affords analogous envelopes of resonances (Figure 6) and Job plots (Figure 7). The implicit assumption in all studies is that the formation of a near-statistical distribution of homo- and heteroaggregates reflects the structures of the homoaggregates from which the ensemble derives. Previous studies of lithium enolates have shown that two homoaggregated enolates with different aggregation (dimer and tetramer, for example) either resist forming heteroaggregates altogether or form heteroaggregates nonstatistically, which leads to the maxim “like aggregates with like.″
Although the clearest examples stem from enolate pairs in which both subunits can be monitored spectroscopically, this is neither required nor our intent. Our long-term goal is to develop a library of enolates that either are tagged with fluoro moieties or have vinyl proton resonances that afford well-resolved envelopes of resonances when paired with any enolate regardless of how spectroscopically unfriendly it might be. Indeed, monitoring one envelope showing four of the five tetrameric aggregates—one homoaggregate is spectroscopically invisible—affords an accompanying Job plot showing the four visible forms versus mole fraction (Figure 5). Although the Job plot in Figure 5 is that of a tetrameric ensemble of lithium phenolates 1 and 3, the missing aggregate renders it visually comparable to an ensemble of trimers, and it is treated as such mathematically. The nuances of the analysis are described in the Results section.
1H versus 19F NMR Spectroscopy
We examined 19F NMR spectroscopy assuming that we might achieve superior spectroscopic resolution. 1H NMR spectroscopy, by contrast, requires no explicit tagging of the substrates and ironically offers better resolution to that of 19F NMR spectroscopy. In fact, sodium enolates could only be characterized using 1H NMR spectroscopy. The comparison of the enolates herein is by no means comprehensive; the fluorine tags, admittedly positioned in relatively remote locations, have offered few advantages so far.
TMEDA-Solvated Sodium Enolates
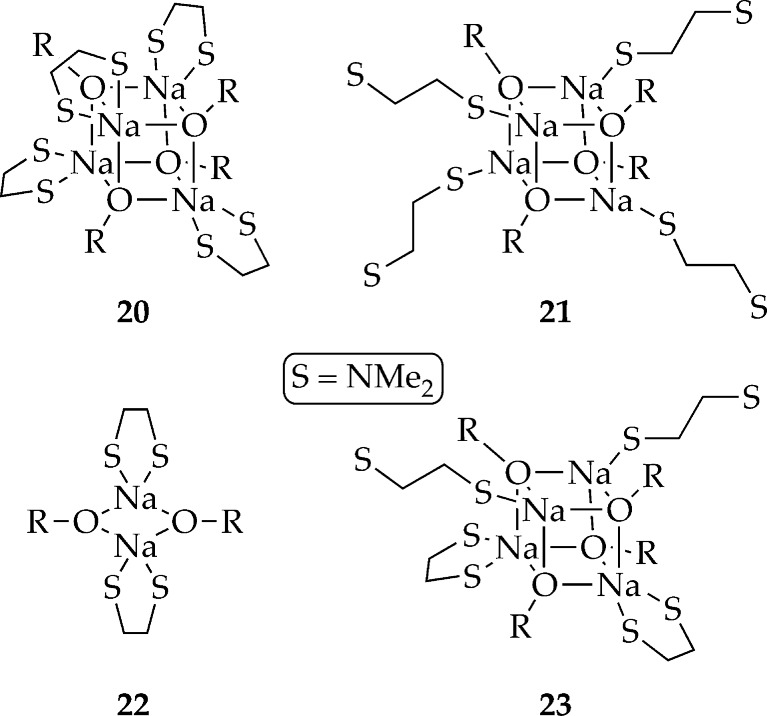
In contrast to lithium enolates in which TMEDA invariably affords chelated dimers from a wide range of enolates,24,38 the corresponding sodium enolates in Chart 2 proved to be tetrameric without exception. Putative unchelated (η1) and chelated (η2) enolates are illustrated in Chart 4. The small lithium nucleus forces the choice of η2-solvated dimers (akin to 22) over the only sterically accessible tetrameric form, η1-solvated cubic Li–X tetramers (akin to 21).39 By contrast, the much larger sodium nucleus appears to support a chelated TMEDA on cubic Na–X tetramers (20) as evidenced in crystal structures.40 The chelate is further evidenced by complete failures of Me2NEt or Me2N-n-Bu–TMEDA analogues lacking the capacity to chelate—to afford anything tractable. The plot seemed to thicken when (1R,2R)-N,N,N′,N′-tetramethyl-1,2-cyclohexanediamine (TMCDA), a TMEDA analogue that appears to be incapable of forming η1 complexes, afforded intractable results. Either TMEDA serves a dual role as an η1 and η2 ligand (23) or TMCDA suffers from other problems related to bite angle or steric demands.41
Chart 4.
THF-Solvated Sodium Enolates
Characterizations of the sodium indenolates solvated by THF proceeded smoothly. By contrast, the two generic homoaggregates of sodium enolates derived from cyclohexanone (15) and cyclopentanone (16) afforded broad mounds corresponding to the enolate vinyl protons. Although we initially thought that the enolization by sodium bases in THF had gone afoul, enolizations in THF/toluene with subsequent addition of TMEDA afforded TMEDA-solvated tetramers indistinguishable from samples prepared in TMEDA/toluene. Therefore, the broad mounds attest to structural complexity—oligomerizations via enolate laddering12,42 or cube stacking may be occurring12—rather than decomposition during enolization. The consequences in synthesis are unknowable but possibly substantial.9 These results also attest to (albeit only qualitatively) the relative efficacy of TMEDA to coordinate to sodium.
Conclusions
We have shown that by monitoring NMR-friendly nuclei in the organic fragment, we can use MCV to characterize sodium enolates. Those characterized to date illustrate primarily proof of principle. Nevertheless, the results suggest that the putative high reactivities of sodium enolates have structural foundations distinct from their lithium counterparts. After years of studying organolithium chemistry, we have to extrapolate the principles derived from lithium to sodium with caution. Fundamental issues such as rigorously determined solvation numbers have yet to be addressed. Most important, we do not have a clue how many principles of structure and reactivity are shared by lithium and sodium salts. Are the synthetically less central sodium salts worth the effort and resources? Can principles of aggregation and solvation unlock potential applications of sodium enolates? We shall see.
Experimental Section
Reagents and Solvents
All substrates are commercially available. TMEDA, THF, and toluene were distilled from blue or purple solutions containing sodium benzophenone ketyl. Owing to the appearance of vinyl ethers from tetraglyme degradation in the 1H NMR spectra, no tetraglyme was added to dissolve the ketyl in toluene, resulting in a lighter blue color. Liquid substrates were distilled from 4 Å molecular sieves. (Some ketones decompose on exposure to molecular sieves for extended times.) NaHMDS,4 NaICA,4,32 and [6Li]LiHMDS43 were prepared and recrystallized from modified literature procedures as described below. Air- and moisture-sensitive materials were manipulated under argon using standard glovebox, vacuum line, and syringe techniques.
[6Li]LiHMDS
Isoprene (8.0 mL, 0.080 mol) was dissolved in 30 mL dry dimethylethylamine (DMEA) and added over 1–2 h via syringe pump to a solution of lithium metal (1.11 g, 0.16 mol) and hexamethyldisilazane (HMDS, 25.8 g, 33.4 mL, 0.16 mol) in 80 mL DMEA at room temperature. The reaction was run in the bottom of an apparatus with 250 mL round-bottom flasks and a fine frit attached directly to a Schlenk line (inset). The temperature was maintained below 30 °C to avoid darkening. If the solution turned yellow at low temperature, the HMDS was consumed, and isoprene addition was stopped immediately to avoid further darkening. After the addition of isoprene, the mixture was stirred until the lithium metal was nearly consumed (up to 1 h). The apparatus was inverted to filter the solution, and then the solution was evaporated to dryness under vacuum for 6 h. DMEA had to be removed completely because it provides the LiHMDS with too much added solubility in the subsequent pentane recrystallization. The white solid was transferred to an analogous coarse frit setup in a glovebox and returned to the Schlenk line. LiHMDS was dissolved in a minimum amount of pentane, crystallized slowly at −78 °C, and filtered to remove the residual liquid. This procedure was repeated three times or until the solid was completely white. The solid was spectroscopically pure as described previously.43
NaHMDS
Isoprene (8.0 mL, 80 mmol) was dissolved in 30 mL of dry DMEA and added over 1–2 h via syringe pump to a solution of sliced sodium metal (3.7 g, 160 mmol) and HMDS (25.8 g, 33.4 mL, 160 mmol) in 80 mL DMEA at room temperature. The reaction was run in the bottom of a swivel fine frit apparatus with 250 mL round-bottom flasks, attached directly to a Schlenk line (picture). The temperature was maintained below 30 °C to avoid darkening. If the cold solution turned yellow, then HMDS had been consumed, and the addition of isoprene addition was stopped immediately to avoid further darkening. After addition of isoprene a significant amount of sodium remained; the reaction was stirred for an additional 2–3 h. The apparatus was flipped, the solution was slowly filtered, and the solution was evaporated to dryness under vacuum for 6 h. The white solid was transferred to a coarse frit setup under inert atmosphere. NaHMDS was recrystallized from a minimum amount of DMEA (∼30–50 mL), crystallized by cooling slowly in dry ice/acetone, and filtered to remove the residual liquid. This procedure was repeated three times or until the solid was completely white and spectroscopically pure.5
NaICA
Isoprene (16 mL, 160 mmol) was dissolved in 30 mL dry DMEA and added over 1–2 h via syringe pump to a solution of finely sliced sodium metal (7.36 g, 320 mmol) and cyclohexylisopropylamine (45.2 g, 320 mmol) in 80 mL DMEA at room temperature. Sodium dispersion is reportedly necessary to acquire a reasonable yield;4 we sliced the sodium thinly under inert atmosphere and obtained an acceptable amount of NaICA. The reaction was run in a 250 mL round-bottom flask attached directly to a Schlenk line. Addition of isoprene resulted in a yellow solution and precipitation of the product. After the addition of isoprene was complete, the reaction was stirred for an additional 6–8 h and evaporated to dryness. A portion of the solid was transferred under an inert atmosphere to a fine-frit swivel apparatus (see LiHMDS synthesis figure) and dissolved in DMEA. The apparatus was flipped, and the solution was slowly filtered, then the solution was evaporated to dryness. In a glovebox, approximately 3 g of the off-white solid was added to each of two centrifuge tubes fitted with a stopcock for eventual compaction of a very fine powder. (Substantial crude solid remained for future crystallization.) Under continuous argon flow, the solid was dissolved in DMEA and concentrated to the point of turbidity. Cyclopentane (25 mL) was added, and the vessel cooled with dry ice/acetone. The resulting suspension was centrifuged to form a white cake, and the supernatant was removed via syringe. This procedure was repeated until the supernatant was colorless. The resulting white solid was dried under vacuum. Full NMR spectroscopic characterization included COSY, TOCSY, HSQC, HMBC, and ROESY spectroscopies (Supporting Information). 13C{1H} NMR (125 MHz, 0.50 M TMEDA/toluene-d8) δ (isomer 1) 23.36, 27.08, 28.33, 39.04, 49.08, 80.92; (isomer 2) 25.73, 26.52, 28.05, 34.13, 43.72, 52.81 ppm.
NMR Sample Preparation
Individual stock solutions of substrates and base were prepared at room temperature. An NMR tube under vacuum was flame-dried on a Schlenk line and allowed to return to room temperature. It was then backfilled with argon and placed in a −78 °C dry ice/acetone bath. The appropriate amounts of base and substrate were added sequentially via syringe. The tube was sealed under partial vacuum, stored in a −86 °C freezer, and carefully mixed before placement into the spectrometer. Each NMR sample contained 0.10 M total phenol and 0.10 M base. (Excess base appears to form mixed aggregates with the resulting enolates.)
NMR Spectroscopy
1H and 19F NMR spectra were typically recorded at −80 °C (unless stated otherwise) on a 500 MHz spectrometer with the delay between scans set to >5 × T1 to ensure accurate integrations. Chemical shifts are reported relative to the toluene CH3 moiety (1H, 2.10 ppm) and fluorobenzene (19F, −112 ppm). The resonances were integrated using the standard software accompanying the spectrometers. After weighted Fourier transform with 64,000 points and phasing, line broadening was set between 0 and 0.30, and a baseline correction was applied when appropriate. Deconvolution was performed in the absolute intensity mode, with application of a drift correction using default parameters for contributions from Lorentzian and Gaussian line shapes. The mathematics underlying the parametric fits have been described in detail,24 with minor modifications appearing in the Supporting Information of this paper.
Acknowledgments
We thank the National Institutes of Health (GM077167) and Sanofi–Aventis for direct support of this work.
Supporting Information Available
Spectral data and Job plots. This material is available free of charge via the Internet at http://pubs.acs.org.
The authors declare no competing financial interest.
Funding Statement
National Institutes of Health, United States
Supplementary Material
References
- Dugger R. W.; Ragan J. A.; Ripin D. H. B. Org. Process Res. Dev. 2005, 9, 253. [Google Scholar]
- a Green J. R. In Science of Synthesis; Georg Thieme Verlag: New York, 2005; Vol. 8a, pp 427–486. [Google Scholar]; b Schetter B.; Mahrwald R. Angew. Chem., Int. Ed. 2006, 45, 7506. [DOI] [PubMed] [Google Scholar]; c Arya P.; Qin H. Tetrahedron 2000, 56, 917. [Google Scholar]; d Caine D. In Comprehensive Organic Synthesis; Trost B. M., Fleming I., Eds.; Pergamon: New York, 1989, Vol. 1, p 1. [Google Scholar]; e Plaquevent J.-C.; Cahard D.; Guillen F.; Green J. R. In Science of Synthesis; Georg Thieme Verlag: New York, 2005; Vol. 26, pp 463–511. [Google Scholar]; f Comprehensive Organic Functional Group Transformations II; Katritzky A. R., Taylor R. J. K., Eds.; Elsevier: Oxford, U.K., 1995; pp 834–835. [Google Scholar]; g Cativiela C.; Diaz-de-Villegas M. D. Tetrahedron: Asymmetry 2007, 18, 569. [Google Scholar]; h Woltermann C. J.; Hall R. W.; Rathman T. PharmaChem 2003, 2, 4. [Google Scholar]; i Seebach D. Angew. Chem., Int. Ed. Engl. 1988, 27, 1624. [Google Scholar]; j Williard P. G. In Comprehensive Organic Synthesis; Pergamon: New York, 1991; Vol. 1, p 1. [Google Scholar]
- a Sott R.; Granander J.; Williamson C.; Hilmersson G. A Eur. J. 2005, 11, 4785. [DOI] [PubMed] [Google Scholar]; Owen D. W.; Puller P. C. J. Organomet. Chem. 1983, 255, 173. [Google Scholar]; b Lochmann L.; Trekoval J. J. Organomet. Chem. 1979, 179, 123. [Google Scholar]; c Lochmann L.; Pospisil J.; Lim D. Tetrahedron Lett. 1966, 7, 257. [Google Scholar]; d Schade C.; Bauer W.; Schleyer P.v.R. J. Organomet. Chem. 1985, 295, C25. [Google Scholar]
- Mulvey R. E.; Robertson S. D. Angew. Chem., Int. Ed. 2013, 52, 11470. [DOI] [PubMed] [Google Scholar]
- Wannagat U.; Niederprüm H. Chem. Ber. 1961, 94, 1540. [Google Scholar]
- Msayib K. J.; Watt C. I. F. Chem. Soc. Rev. 1992, 21, 237. [Google Scholar]
- a Laguf B. R.; Liotta D. C. Tetrahedron Lett. 1994, 35, 4485. [Google Scholar]; b Boeckman R. K. Jr.; Boehmler D. J.; Musselman R. A. Org. Lett. 2001, 3, 3777. [DOI] [PubMed] [Google Scholar]; c Goh J. B.; Lagu B. R.; Wurster J.; Liotta D. C. Tetrahedron Lett. 1994, 35, 6029. [Google Scholar]; d Davis F. A.; Sheppard A. C.; Chen B.-C.; Haque M. S. J. Am. Chem. Soc. 1990, 112, 6679. [Google Scholar]
- a Khiar N.; Fernandez I.; Alcudia A.; Garcia M. V.; Recio R.. Carbohydrates: Tools for Stereoselective Synthesis; Boysen M., Martin K., Eds.; Wiley: New York, 2013; pp 47–63. [Google Scholar]; b Dénès F.; Pérez-Luna A.; Chemla F. Chem. Rev. 2010, 110, 2366. [DOI] [PubMed] [Google Scholar]; c Alexander K.; Cook S.; Gibson C. L.; Kennedy A. R. J. Chem. Soc., Perkin Trans. 1 2001, 1538. [Google Scholar]; d Evans D. A.; Wu L. D.; Wiener J. J. M.; Johnson J. S.; Ripin D. H. B.; Tedrow J. S. J. Org. Chem. 1999, 64, 6411. [Google Scholar]; e Konigsberger K.; Prasad K.; Repic O.; Blacklock T. J. Tetrahedron: Asymm. 1997, 8, 2347. [Google Scholar]; f Harwood L. M.; Houminer Y.; Manage A.; Seeman J. I. Tetrahedron Lett. 1994, 35, 8027. [Google Scholar]; g Cahard D.; Duhamel P. Eur. J. Org. Chem. 2001, 1023. [Google Scholar]; h Anaya de Parrodi C.; Clara-Sosa A.; Pérez L.; Quintero L.; Maran V.; Toscano R. A.; Avin J. A.; Rojas-Limae S.; Juaristi E. Tetrahedron: Asymmetry 2001, 12, 69. [Google Scholar]; i Chuna C. C.; Leea C.-J.; Kimb J. N.; Kima T. H. Tetrahedron: Asymmetry 2005, 16, 2989. [Google Scholar]; j Takuwa T.; Minowa T.; Onishi J. Y.; Mukaiyama T. Bull. Chem. Soc. Jpn. 2004, 77, 1717. [Google Scholar]; k Reyes-Rangel G.; Jiménez-González E.; Olivares-Romero J. L.; Juaristi E. Tetrahedron: Asymm. 2008, 19, 2839. [Google Scholar]; l Reyes-Rangel G.; Maranon V.; Avila-Ortiz C. G.; Anaya de Parrodi C.; Quintero L.; Juaristi E. Tetrahedron 2006, 62, 8404. [Google Scholar]; m Hama T.; Hartwig J. F. Org. Lett. 2008, 10, 1549. [DOI] [PubMed] [Google Scholar]; n Xu Z. Q.; DesMarteau D. D.; Gotoh Y. J. Fluorine Chem. 1992, 58, 71. [Google Scholar]
- a Linney I. D.; Tye H.; Wills M.; Butlin R. J. Tetrahedron Lett. 1994, 35, 1785. [Google Scholar]; b Novikova Z. S.; Kurkin A. N.; Lutsenko I. F. Z. Obsh Khim. 1978, 48, 305. [Google Scholar]
- a Fryzuk M. D.; Gao X.; Rettig S. J. Can. J. Chem. 1995, 73, 1175. [Google Scholar]; b Williard P. G.; Carpenter G. B. J. Am. Chem. Soc. 1986, 108, 462. [DOI] [PubMed] [Google Scholar]; c Cambillau C.; Bram G.; Corset J.; Riche C. Can. J. Chem. 1982, 60, 2554. [Google Scholar]; d Hevia E.; Henderson K. W.; Kennedy A. R.; Mulvey R. E. Organometallics 2006, 25, 1778. [Google Scholar]; e Henderson K. W.; Williard P. G.; Bernstein P. R. Angew. Chem., Int. Ed. Engl. 1995, 34, 1117. [Google Scholar]; f Chi Y.; Ranjan S.; Chung P.-W.; Liu C.-S.; Peng S.-M.; Lee G.-H. Dalton Trans. 2000, 343. [Google Scholar]; g Solladie-Cavallo A.; Simon-Wermeister M. C.; Schwarz J. Organometallics 1993, 12, 3743. [Google Scholar]; h Garden J. A.; Kennedy A. R.; Mulvey R. E.; Robertson S. D. Chem. Commun. 2012, 48, 5265. [DOI] [PubMed] [Google Scholar]; i Salmon L.; Thuery P.; Ephritikhine M. Acta Crystallogr., Section E 2006, 62, m1250. [Google Scholar]
- a Boyle T. J.; Velazquez A. T.; Yonemoto D. T.; Alam T. M.; Moore C.; Rheingold A. L. Inorg. Chim. Acta 2013, 405, 374. [Google Scholar]; b Evans W. J.; Golden R. E.; Ziller J. W. Inorg. Chem. 1993, 32, 3041. [Google Scholar]; c Czado W.; Muller U. Z. Kristallogr. – New Cryst. Struct. 1999, 214, 63. [Google Scholar]; d Walther D.; Ritter U.; Gessler S.; Sieler J.; Kunert M. Z. Anorg. Allg. Chem. 1994, 620, 101. [Google Scholar]; e Kunert M.; Dinjus E.; Nauck M.; Sieler J. Chem. Ber. 1997, 130, 1461. [Google Scholar]; f Cole M. L.; Junk P. C.; Proctor K. M.; Scott J. L.; Strauss C. R. Dalton Trans. 2006, 3338. [DOI] [PubMed] [Google Scholar]
- a Ladder: Hsueh M.-L.; Ko B.-T.; Athar T.; Lin C.-C.; Wu T.-M.; Hsu S.-F. Organometallics 2006, 25, 4144. [Google Scholar]; b Stacked cubes: MacDougall D. J.; Noll B. C.; Henderson K. W. Inorg. Chem. 2005, 44, 1181. [DOI] [PubMed] [Google Scholar]; c TMEDA-solvated cyclic dimer: Clegg W.; Fleming B. J.; Garcia-Alvarez P.; Hogg L. M.; Kennedy A. R.; Klett J.; Martinez-Martinez A. J.; Mulvey R. E.; Russo L.; O’Hara C. T. Dalton Trans. 2013, 42, 2512. [DOI] [PubMed] [Google Scholar]; d Cousins D. M.; Davidson M. G.; Garcia-Vivo D. Chem. Commun. 2013, 49, 11809. [DOI] [PubMed] [Google Scholar]; e Zhang J.; Wang C.; Lu M.; Yao Y.-M.; Zhang Y.; Shen Q. Polyhedron 2011, 30, 1876. [Google Scholar]; f Yuan F.; Yang J.; Xiong L. J. Organomet. Chem. 2006, 691, 2534. [Google Scholar]
- a Laszlo P.Encyclopedia of NMR; Wiley: New York, Vol. 5, 1996. [Google Scholar]; b Kemp-Harper R.; Brown S. P.; Hughes C. E.; Styles P.; Wimperis S. Nuclear Magn. Reson. Spectr. 1997, 30, 157. [Google Scholar]; c Laszlo P. In NMR Spectroscopy: New Methods and Applications; ACS Symposium Series; American Chemical Society: Washington, DC, Vol. 191, 1982. [Google Scholar]
- Cornelius A.; Laszlo P.; Cambillau C. J. Chem. Res. (S) 1978, 462. [Google Scholar]
- a Jackman L. M.; Lange B. C. Tetrahedron 1977, 33, 2737. [Google Scholar]; b Vogt H. H.; Gompper R. Chem. Ber. 1981, 114, 2884. [Google Scholar]; c Kiyooka S.; Suzuki K. Bull. Chem. Soc. Jpn. 1981, 54, 623. [Google Scholar]; d Kiyooka S.; Ueda Y.; Suzuki K. Bull. Chem. Soc. Jpn. 1980, 53, 1656. [Google Scholar]; e Howden M. E. H.; Tyler M. Tetrahedron Lett. 1975, 1979. [Google Scholar]
- a Zook H. D.; Rellahan W. L. J. Am. Chem. Soc. 1957, 79, 881. [Google Scholar]; b Greene J. L.; Zook H. D. J. Am. Chem. Soc. 1958, 80, 3629. [Google Scholar]; c Zook H. D.; Gumby W. L. J. Am. Chem. Soc. 1960, 82, 1386. [Google Scholar]; d Zook H. D.; Russo T. J. J. Am. Chem. Soc. 1960, 82, 1258. [Google Scholar]; e Zook H. D.; Russo T. J.; Ferrand E. F.; Stotz D. S. J. Org. Chem. 1968, 33, 2222. [Google Scholar]; f Zook H. D.; Kelly W. L.; Posey I. Y. J. Org. Chem. 1968, 33, 3477. [Google Scholar]
- Hill D. G.; Burkus J.; Luck S. M.; Hauser C. R. J. Am. Chem. Soc. 1959, 81, 2787. [Google Scholar]
- For examples of colligative measurements on lithium enolates, see:; a Seebach D.; Bauer W. Helv. Chim. Acta 1984, 67, 1972. [Google Scholar]; b Arnett E. M.; Moe K. D. J. Am. Chem. Soc. 1991, 113, 7288. [Google Scholar]; c Arnett E. M.; Fisher F. J.; Nichols M. A.; Ribeiro A. A. J. Am. Chem. Soc. 1990, 112, 801. [Google Scholar]
- For examples of colligative measurements of other organolithiums, see:; a Davidson M. G.; Snaith R.; Stalke D.; Wright D. S. J. Org. Chem. 1993, 58, 2810–2816. [Google Scholar]; b Kallman N.; Collum D. B. J. Am. Chem. Soc. 1987, 109, 7466–7472. [Google Scholar]; c Wanat R. A.; Collum D. B.; Van Duyne G.; Clardy J.; DePue R. T. J. Am. Chem. Soc. 1986, 108, 3415–3422. [Google Scholar]; d West P.; Waack R. J. Am. Chem. Soc. 1967, 89, 4395–4399. [Google Scholar]; e Davidson M. G.; Snaith R.; Stalke D.; Wright D. S. J. Org. Chem. 1993, 58, 2810. [Google Scholar]
- Li D.; Keresztes I.; Hopson R.; Williard P. G. Acc. Chem. Res. 2009, 42, 270. [DOI] [PMC free article] [PubMed] [Google Scholar]
- a Sini G.; Tessier A.; Pytkowicz J.; Brigaud T. A Eur. J. 2008, 14, 3363. [DOI] [PubMed] [Google Scholar]; b Wang Y.-G.; Sun C.-J.; Deng C.-H. J. Phys. Chem. A 1998, 102, 5816. [Google Scholar]; c Nonella M.; Suter H. U. J. Phys. Chem. A 1999, 103, 7867. [DOI] [PubMed] [Google Scholar]
- Arnett E. M.; Maroldo S. G.; Schriver G. W.; Schilling S. L.; Troughton E. B. J. Am. Chem. Soc. 1985, 107, 2091. [Google Scholar]
- a Renny J. S.; Tomasevich L. L.; Tallmadge E. H.; Collum D. B. Angew. Chem., Int. Ed. 2013, 52, 11998. [DOI] [PMC free article] [PubMed] [Google Scholar]; b Huang C. Y. Methods Enzymol. 1982, 87, 509. [DOI] [PubMed] [Google Scholar]; c Hubbard R. D.; Horner S. R.; Miller B. L. J. Am. Chem. Soc. 2001, 123, 5810. [DOI] [PubMed] [Google Scholar]; d Olson E. J.; Bühlmann P. J. Org. Chem. 2011, 76, 8406. [DOI] [PubMed] [Google Scholar]
- a Liou L. R.; McNeil A. J.; Ramirez A.; Toombes G. E. S.; Gruver J. M.; Collum D. B. J. Am. Chem. Soc. 2008, 130, 4859. [DOI] [PMC free article] [PubMed] [Google Scholar]; b Gruver J. M.; Liou L. R.; McNeil A. J.; Ramirez A.; Collum D. B. J. Org. Chem. 2008, 73, 7743. [DOI] [PMC free article] [PubMed] [Google Scholar]; c Liou L. R.; McNeil A. J.; Toombes G. E. S.; Collum D. B. J. Am. Chem. Soc. 2008, 130, 17334. [DOI] [PMC free article] [PubMed] [Google Scholar]; d De Vries T. S.; Goswami A.; Liou L. R.; Gruver J. M.; Jayne E.; Collum D. B. J. Am. Chem. Soc. 2009, 131, 13142. [DOI] [PMC free article] [PubMed] [Google Scholar]; e Tomasevich L. L.; Collum D. B. J. Org. Chem. 2013, 78, 7498. [DOI] [PMC free article] [PubMed] [Google Scholar]
- Kissling R. M.; Gagne M. R. J. Org. Chem. 2001, 66, 9005. [DOI] [PubMed] [Google Scholar]
- Pharmaceuticals and Intermediates 1986–1997 Update; Becker A., Ed.; Becker Associates: Washington, DC, 1997. [Google Scholar]
- Reviews of 19F NMR spectroscopy; a Gakh Y. G.; Gakh A. A.; Gronenborn A. M. Magn. Reson. Chem. 2000, 38, 551. [Google Scholar]; b McGill C. A.; Nordon A.; Littlejohn D. J. Process Anal. Chem. 2001, 6, 36. [DOI] [PubMed] [Google Scholar]; c Espinet P.; Albeniz A. C.; Casares J. A.; Martinez-Ilarduya J. M. Coord. Chem. Rev. 2008, 252, 2180. [Google Scholar]
- Collum D. B. Acc. Chem. Res. 1992, 25, 448. [Google Scholar]
- a Ward L.; Barr D.. Br. U.K. Pat. Appl. GB 2280671 A 19950208.; b Barr D.; Dawson A. J.; Wakefield B. J. J. Chem. Soc., Chem. Commun. 1992, 204. [Google Scholar]
- a Munguia T.; Bakir Z. A.; Cervantes-Lee F.; Metta-Magana A.; Pannell K. H. Organometallics 2009, 28, 5777. [Google Scholar]; b See also ref (3b)
- a Sodium tetramethylpiperidide-TMEDA: Armstrong D. R.; Graham D. V.; Kennedy A. R.; Mulvey R. E.; O’Hara C. T. Chem.–Eur.J. 2008, 14, 8025. [DOI] [PubMed] [Google Scholar]; b Sodium tetramethylpiperidide-THF: Armstrong D. R.; Garcia-Alvarez P.; Kennedy A. R.; Mulvey R. E.; Robertson S. D. Chem.–Eur.J. 2011, 17, 6725. [DOI] [PubMed] [Google Scholar]
- Andrews P. C.; Barnett N. D. R.; Mulvey R. E.; Clegg W.; O’Neil P. A.; Barr D.; Cowton L.; Dawson A. J.; Wakefield B. J. J. Organomet. Chem. 1996, 518, 85. [Google Scholar]
- Galiano-Roth A. S.; Michaelides E. M.; Collum D. B. J. Am. Chem. Soc. 1988, 110, 2658. [Google Scholar]
- Hsieh H. L.; Quirk R. P.. Anionic Polymerization: Principles and Practical Applications; Marcel Dekker: New York, 1996. [Google Scholar]
- Job P. Ann. Chim. 1928, 9, 113. [Google Scholar]
- By example, a statistical distribution of tetramers missing one homoaggregate takes on the appearance of a 1:3:3:1 trimer.
- For example, a mixture of 10 and 11 in THF/toluene-d8 show an additional aggregate, suspected to be a dimer.
- The crystallographic literature of lithium enolates reveals a prevalence of chelated dimers for TMEDA solvates:; a Nichols M. A.; Leposa C. M.; Hunter A. D.; Zeller M. J. Chem. Crystallogr. 2007, 37, 825. [Google Scholar]; b Seebach D.; Amstutz R.; Laube T.; Schweizer W. B.; Dunitz J. D. J. Am. Chem. Soc. 1985, 107, 5403. [Google Scholar]; c Meyers A. I.; Seefeld M. A.; Lefker B. A.; Blake J. F.; Williard P. G. J. Am. Chem. Soc. 1998, 120, 7429. [Google Scholar]; d Boche G.; Langlotz I.; Marsch M.; Harms K. Chem. Ber. 1994, 127, 2059. [Google Scholar]; e Hahn E.; Maetzke T.; Plattner D. A.; Seebach D. Chem. Ber. 1990, 123, 2059. [Google Scholar]; f Henderson K. W.; Dorigo A. E.; Williard P. G.; Bernstein P. R. Angew. Chem., Int. Ed. 1996, 35, 1322. [Google Scholar]
- a Bauer W.; Klusener P. A. A.; Harder S.; Kanters J. A.; Duisenberg A. J. M.; Brandsma L.; Schleyer P. v. R. Organometallics 1988, 7, 552. [Google Scholar]; b Köster H.; Thoennes D.; Weiss E. J. Organomet. Chem. 1978, 160, 1. [Google Scholar]; c Harder S.; Boersma J.; Brandsma L.; Kanters J. A. J. Organomet. Chem. 1988, 339, 7. [Google Scholar]; d Ball S. C.; Cragg-Hine I.; Davidson M. G.; Davies R. P.; Lopez-Solera M. I.; Raithby P. R.; Reed D.; Snaith R.; Vogl E. M. J. Chem. Soc., Chem. Commun. 1995, 2147. [Google Scholar]
- a Armstrong D. R.; Clegg W.; Dale S. H.; Garcia-Alvarez J.; Harrington R. W.; Hevia E.; Honeyman G. W.; Kennedy A. R.; Mulvey R. E.; O’Hara C. T. Chem. Commun. 2008, 187. [DOI] [PubMed] [Google Scholar]; b Clegg W.; Conway B.; Kennedy A. R.; Klett J.; Mulvey R. E.; Russo L. Eur. J. Inorg. Chem. 2011, 721. [Google Scholar]; c Barker J.; Barnett N. D. R.; Barr D.; Clegg W.; Mulvey R. E.; O’Neil P. A. Angew. Chem., Int. Ed. 1993, 32, 1366. [Google Scholar]
- Differences between TMEDA and TMCDA as ligands have also been attributed to the fixed bite angle of TMCDA:Heuger G.; Kalsow S.; Göttlich R. Eur. J. Org. Chem. 2002, 1848. [Google Scholar]
- Mulvey R. E. Chem. Soc. Rev. 1998, 27, 339. [Google Scholar]
- Romesberg F. E.; Bernstein M. P.; Gilchrist J. H.; Harrison A. T.; Fuller D. J.; Collum D. B. J. Am. Chem. Soc. 1993, 115, 3475. [Google Scholar]
Associated Data
This section collects any data citations, data availability statements, or supplementary materials included in this article.


