

Abstract
To investigate why responses of mast cells to antigen-induced IgE receptor (FcεRI) aggregation depend nonlinearly on antigen dose, we characterized a new artificial ligand, DF3, through complementary modeling and experimentation. This ligand is a stable trimer of peptides derived from bacteriophage T4 fibritin, each conjugated to a hapten (DNP). We found low and high doses of DF3 at which degranulation of mast cells sensitized with DNP-specific IgE is minimal, but ligand-induced receptor aggregation is comparable to aggregation at an intermediate dose, optimal for degranulation. This finding makes DF3 an ideal reagent for studying the balance of negative and positive signaling in the FcεRI pathway. We find that the lipid phosphatase SHIP and the protein tyrosine phosphatase SHP-1 negatively regulate mast cell degranulation over all doses considered. In contrast, SHP-2 promotes degranulation. With high DF3 doses, relatively rapid recruitment of SHIP to the plasma membrane may explain the reduced degranulation response. Our results demonstrate that optimal secretory responses of mast cells depend on the formation of receptor aggregates that promote sufficient positive signaling by Syk to override phosphatase-mediated negative regulatory signals.
Mast cells and basophils trigger allergic reactions when polyvalent antigens cross-link IgE–FcεRI complexes on the cell surface. Signaling begins with phosphorylation of FcεRIβ and FcεRIγ subunit ITAMs (immunoreceptor tyrosine-based activation motifs), which in turn recruit downstream regulatory proteins for signal propagation and regulation. FcεRI signaling is a function of the properties of receptor aggregates formed on the cell surface, including the size, spacing, and rate of internalization.1−3 Valency is a particularly important factor controlling signaling efficiency, as summarized in recent reviews.4,5 Important questions remain to be resolved about these relationships, particularly regarding the links between signal regulation and the spatial arrangements of receptor aggregates after cross-linking. The RBL-2H3 tumor mast cell is commonly used as a model system, typically by priming cells with monoclonal IgE specific for a hapten. The best characterized hapten is 2,4-dinitrophenyl (DNP),6 where cells sensitized with anti-DNP IgE are activated with ligands such as DNP-conjugated bovine serum albumin (DNP–BSA) or ovalbumin. With as many as 25 DNPs per protein carrier, these multivalent ligands stimulate robust FcεRI signaling. However, their structural heterogeneity, which arises from random coupling of DNP to lysine residues, prevents high-precision control of receptor aggregation. In addition, the unbound hapten groups of a DNP-conjugated protein are not equivalent for binding IgE–FcεRI complexes on cell surfaces because of steric constraints.7,8 Another unknown factor is the variability in affinity of IgE for haptens arising from the influence of the hapten’s peptide environment.
To address critical questions regarding the influence of the aggregation state on FcεRI activation, our first step was the design of a new DNP-based ligand with defined structure and valency. As a template, we chose the foldon domain of fibritin from enterobacteria phage T4, which spontaneously self-assembles into a stable trimer.9,10 Fibritin trimerization occurs through β-hairpins in the foldon domain; the foldon trimer is stabilized by hydrophobic amino acid interactions, intermolecular salt bridges, and hydrogen bonds. We synthesized a stable trivalent DNP ligand by attaching DNP to the N-terminus of a peptide comprising the foldon domain via a flexible linker and allowing the conjugated peptide to self-assemble. Structural analysis predicts that each DNP in the trimer is available to engage with IgEDNP–FcεRI complexes on the mast cell surface. Optimal doses elicit robust mast cell responses that are comparable to those achieved with DNP–BSA and other commonly used DNP-conjugated carrier proteins. Moreover, degranulation responses of RBL-2H3 cells to DF3 stimulation are characterized by a dose-dependent bell-shaped curve.
Because bell-shaped secretory response curves are characteristic of primary mast cells and basophils,11 we focused on the link between the receptor aggregation state and signaling outcome. Dose-dependent differences in the DF3–IgE–FcεRI aggregation state were characterized by equilibrium binding assays and diffusion measurements. These data provided parameters for mathematical predictions of receptor aggregate size in cells stimulated over a range of ligand doses. Fundamental predictions of the model are the presence of receptor aggregates at inhibitory doses and dose-dependent differences in receptor aggregation kinetics. These predictions were validated by fluorescence-based receptor cluster analysis and transmission electron microscopy (TEM) imaging. In addition to characterization of Syk, Lyn, and FcεRI ITAM phosphorylation, receptor internalization, and calcium mobilization, we focused on phosphatases implicated in FcεRI signal regulation. We show that the inositol phosphatase SHIP, previously coined the “gatekeeper” of mast cell degranulation,12 colocalizes with receptors to hold the system in check at both suboptimal and inhibitory ligand doses. Two closely related tyrosine phosphatases, SHP-1 and SHP-2, have opposing effects on mast cell degranulation, suggesting that they act on distinct substrates. We propose that the ligand-induced aggregation state is a critical factor for tipping the balance between positive and negative signaling in the control of mast cell degranulation.
Results and Discussion
Design of a Trivalent Ligand for Cross-Linking DNP-Specific IgE–FcεRI Complexes
A large body of preexisting literature supports the concept that antigen–IgE–FcεRI aggregate size is somehow a key component of mast cell activation.13 Previous studies characterizing low-valency ligands have depended on biochemistry techniques, such as gel filtration chromatography and chemical cross-linking, to estimate the extent of cross-linking and the size distributions of ligand–receptor complexes.1,14 Our goal was to reexamine these questions through use of a new structurally defined ligand, computation, and experimental measures of aggregation and signaling.
To create a structurally defined trivalent ligand for inducing IgEDNP–FcεRI aggregation, a peptide representing the C-terminus of the T4 fibritin foldon domain was synthesized with a short peptide linker and DNP conjugated at the N-terminus (Figure 1A of the Supporting Information). The foldon peptide self-assembles into a stable trimer in aqueous buffer.15,16 We refer to this cross-linking reagent as DF3. A fluorescent 5FAM tag was conjugated to the C-terminus for some applications (DF35FAM), and the stability of 5FAM-labeled DF3 was verified (Figure 1B,C of the Supporting Information).
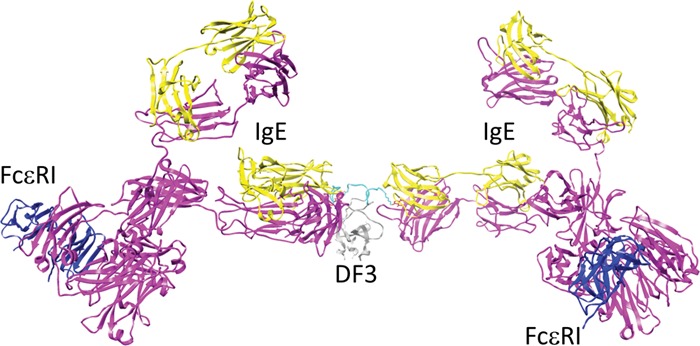
Figure 1A presents a model for the three-dimensional (3D) atomic structure of DF3. Structural models of IgEDNP–FcεRI aggregates that may be induced by DF3 (Figure 1B,C) were constructed on the basis of available structural knowledge, such as information about the molecular basis for the high-affinity interaction of IgE with the FcεRIα ectodomain.17 The distance between two DNP haptens on neighboring arms of DF3 is ∼3.4 nm, although the nine-amino acid linker has sufficient flexibility such that the center-to-center distance between the two DNPs may vary between 2.7 and 6.2 nm. Configurations of antigen–IgE–FcεRI aggregates can become increasingly complex, because each of the three DNP haptens can engage one arm of an IgE–FcεRI complex (Figure 1C). The variability in the distances between Fabs would be expected to increase with the complexity of the aggregate geometry. We speculate that there may be a narrow range of distances that allow Lyn, when anchored on the β subunit ITAM, to mediate trans phosphorylation of ITAMs in adjacent FcεRI subunits. Differential spacing may also influence the recruitment or composition of signaling protein complexes that bind to phospho-ITAMs, including the enzymes Syk, SHIP, SHP-1, SHP-2, PI3K, and PLCγ.18,19 These considerations raise the intriguing possibility that individual receptors within a complex aggregate may make unequal contributions to FcεRI signaling. The structural model predicts that bivalent binding of DF3 to both Fab arms of the same IgE is not possible, which is a desirable feature shared with other recently developed trivalent DNP ligands and tetravalent ligands.20 By comparison, DF3 is more symmetric than published DNA-based ligands14 and more rigid than PEG-based ligands.21 It is noteworthy that structural modeling indicates DF3 also is capable of forming cyclic receptor dimers (Figure 1C,D of the Supporting Information). Although cyclic dimers can have limited signaling potential when engaged by bivalent ligands,22 DF3 may not have the same limitations because such dimers can be extended to form larger aggregates.
Figure 1.
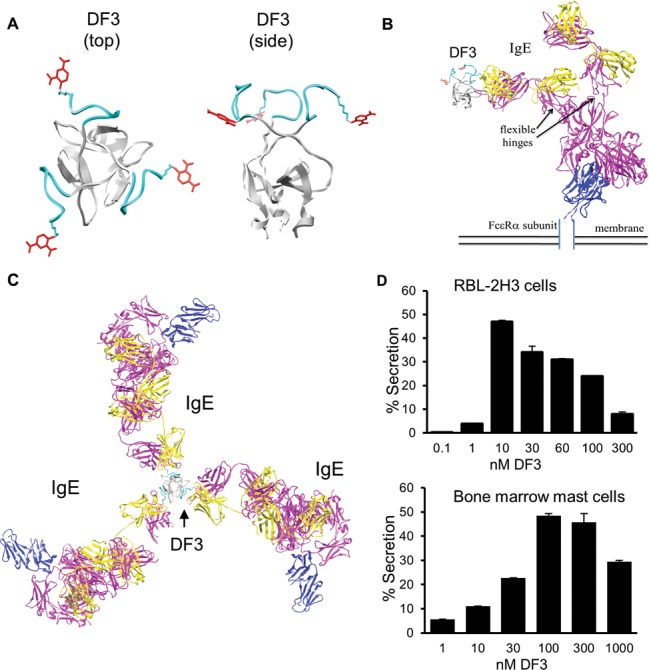
DF3, a new trivalent ligand for mast cell secretion. (A) Three monomers self-assemble to produce DF3, in which three DNP groups (red) attached to the foldon peptide via a flexible linker (cyan) are symmetrically arrayed. Top and side views are shown. On the basis of this model, the linker length is ∼10 Å, the distance between any two DNP groups is ∼34 Å, and the distance between any DNP group and the center of the trimer is ∼17 Å. (B) Side view of DF3 binding to one Fab arm (yellow and magenta for light and heavy chains, respectively) of an IgE–FcεRI α (extracellular domain, blue) complex. (C) Overhead view of one DF3 bound to three IgE–FcεRI complexes. (D) Degranulation response in either RBL-2H3 or bone marrow-derived mast cells, based on the percent of total β-hexosaminidase released from cells after DF3 stimulation for 30 min. Error bars represent the standard deviation. Data are representative of three separate experiments each performed in duplicate.
DF3 Stimulates Mast Cell Secretion
Figure 1D reports the secretory response of adherent RBL-2H3 cells (hereafter “RBL cells”) stimulated with DF3 over a wide range of doses. This ligand induces ∼50% maximal degranulation, a response that is more robust than the 20–30% responses observed with DNA- and PEG-based trivalent ligands previously reported.14,21 DF3-stimulated secretion exhibits a bell-shaped curve, which is also seen for primary cells stimulated with antigen or anti-IgE.23 Murine bone marrow-derived mast cells (BMMCs) also exhibit dose-dependent secretory responses when challenged with DF3 (Figure 1D), thus establishing the applicability of DF3 to studying physiologically relevant mechanisms. The shift in optimal DF3 concentration for BMMC secretion is likely due to ∼8-fold differences in the ligand to receptor ratio utilized in the BMMC suspension assay.
Modeling DF3 Binding
In addition to molecular scale computations for estimating ligand–receptor docking, we adapted the Goldstein–Perelson model24 for FcεRI cross-linking to provide further insight into aggregation states of complexes formed after DF3 binding. We obtained a model that reproduces the dose-dependent binding characteristics of DF35FAM, measured at equilibrium by flow cytometry (Figure 2A). According to the model, the shape of the binding curve in Figure 2A is a consequence of the interplay between the capture of free ligand and receptor cross-linking. At low DF3 concentrations, bound ligands engage multiple receptors, but most receptors are unbound. At sufficiently high concentrations, ligands engage fewer receptors to the detriment of cross-linking, and receptor binding approaches saturation. Parameters of the model were determined through fitting.
Figure 2.

Computational modeling and experimental characterization of DF3 binding and FcεRI cross-linking. (A) Quality of fit. The solid line is derived from the model in which each point along the curve corresponds to the calculated number of bound ligands divided by the total number of IgE antigen-combining sites (two per antibody) at equilibrium for the indicated total ligand concentration. The filled circles correspond to data from flow cytometric assays of the mean fluorescence of cell-associated DF35FAM. Mean fluorescence measurements (arbitrary units) have each been divided by a factor F of 227 (arbitrary units). (B) Cumulative probability analysis (CPA) plots of diffusion coefficients derived from SPT experiments. The mobility is largest for resting receptors (—), whereas that of FcεRI cross-linked by 10 nM DF3 (···) is smallest. (C) Computer simulations predict the fraction of FcεRI in aggregates of specific sizes, determined at steady state after exposure to doses of DF3 ranging from 0.01 to 300 nM. (D) Computer simulations for the kinetics of mean aggregate size over time for 1, 10, and 300 nM DF3. (E) Mean fluorescence intensity of receptor clusters in cells stimulated with DF35FAM for different time periods. Bars represent the standard error of the mean of two independent experiments.
The structure of our model corresponds closely to that of the equilibrium continuum model of Goldstein and Perelson24 for the interaction of a trivalent ligand with a bivalent cell-surface receptor. The Goldstein–Perelson model, as well as our model, accounts for all possible acyclic receptor aggregates, but as a simplification, it omits cyclic aggregates, such as those illustrated in panels D and E of Figure 1 of the Supporting Information. Because the quality of fit is excellent (Figure 2A), extending the model to incorporate cyclic aggregates is not justified by the available data. However, we did find it necessary to extend the structure of the Goldstein–Perelson model to include immobilization of receptor aggregates above a threshold size (see the Supporting Information). This extension is consistent with the observed reduction in receptor mobility upon ligand addition (Figure 2B). It also eliminates the formation of a gel-like superaggregate, comparable to a “cap” (i.e., a coalescence of immobile receptors into a localized region of the cell surface),8 which was not detected experimentally. This supports the simplifying model assumption that aggregates containing more than five receptors are not allowed to interact with each other; free monomers and smaller aggregates may join by diffusion.
The histograms in Figure 2C show the predicted fractions of receptors in monomeric and various aggregated states for different DF3 doses at steady state. As can be seen, for a dose of either 1 or 300 nM, at which secretory responses are poor (Figure 1D), at least 90% of the receptors are predicted to be in clusters. The distribution of receptor aggregate sizes at 1 nM is similar to that at 10 nM, the optimal DF3 dose for degranulation. At the supraoptimal dose of 300 nM, aggregates are smaller on average, but the model still predicts the presence of aggregates containing more than nine receptors. These results, which were subsequently confirmed experimentally in EM experiments (Figure 3), suggest that mast cell activation does not strictly correlate with receptor aggregation and that the dose–response curves of Figure 1D are likely shaped by a balance of positive and negative signaling.
Figure 3.

DF3 induces dose-dependent FcεRI clusters on the cell surface. (A–C) TEM images of membrane sheets prepared from cells after the FcεRI had been cross-linked for 5 min with 0, 10, or 300 nM DF3 and immunogold labeling (6 nm gold) for FcεRI β. Arrows point to signaling patches, typical after addition of antigen. The bar is 0.1 μm. (D) Plot of mean Hopkins test statistic values. The bar indicates the group mean, while whiskers represent the entire range of each group.
Our model, which was formulated through a rule-based approach that allows kinetic Monte Carlo simulations (Supporting Information), can make predictions about the kinetics of ligand-induced receptor aggregation (Figure 2D of the Supporting Information). The model predicts that the initial rate of receptor aggregate formation increases with ligand dose. However, at sufficiently high doses, receptor aggregation is transient. This qualitative behavior was confirmed experimentally in fluorescence microscopy experiments (Figure 2E). Thus, high-dose stimulation of mast cells entails significant receptor aggregation, even though the level of aggregation at equilibrium is low. This behavior further suggests that there is not a simple relationship between aggregation and cell activation.
Single-Particle Tracking Indicates That DF3 Induces a Reduction in Receptor Mobility
Previous observations indicate that diffusion of antigen–IgE–FcεRI complexes is progressively slowed as receptor aggregates grow in size.25 Aggregates of two or three receptors have been shown to be nearly as mobile as receptor monomers, whereas larger aggregates slow and ultimately reach an essentially immobile state. For DF3, we also observed this deceleration (Figure 2B) via established single-particle tracking methods.25,26 Quantum dot (QD)-labeled IgE–FcεRI complexes aggregated with 10 nM DF3 exhibited a marked shift in mobility (Figure 2B). Cross-linking of QD-labeled IgE–FcεRI complexes with a supraoptimal concentration of DF3 (300 nM) led to enhanced receptor slowing. The less dramatic deceleration at the higher ligand dose suggests a smaller average aggregate size, which is consistent with model predictions (Figure 2C).
Fluorescence Imaging Reveals DF3 Dose-Dependent Kinetics of IgE–FcεRI Aggregation
Our model predicts dose-dependent differences in receptor aggregation kinetics (Figure 2D), which may correlate with mast cell outcomes. We sought to experimentally validate the computational results using quantitative fluorescence analysis of receptor clustering (Figure 2E). Cells were grown on glass coverslips, sensitized with DNP-specific IgE, and incubated at 37 °C with a fluorescent ligand (DF35FAM). At defined time intervals, cells were fixed, mounted on glass slides, and imaged by wide field microscopy. 3D images were deconvolved to minimize out-of-focus fluorescence emission and spot intensities analyzed. In good agreement with model predictions, a high DF3 dose (300 nM) led to a rapid increase in average cluster intensity, which was followed by a decrease in intensity. The dose optimal for degranulation (10 nM) elicited a slightly slower increase in average cluster intensity, which reached a relatively higher level and then persisted. The suboptimal dose of 1 nM elicited a markedly slower increase in average cluster intensity, eventually approaching the maximal intensity stimulated by the optimal dose. These data are in qualitative agreement with our simulation results (compare Figure 2D,E; see also Supporting Information). We note that the experimental time courses for the 10 and 300 nM cases are closer to each other than the simulated time courses. Simulations (not shown) indicate that this observation is to be expected if small aggregates (e.g., receptor monomers and dimers) do not contribute to the measured mean cluster intensity (i.e., are below the threshold of detection). Taken together, it is clear that the antigen dose strongly influences the kinetics of aggregate formation, as well as aggregate size. Rapid but transient aggregate formation at high doses or delayed formation of large aggregates seen in both simulations and experiments could potentially lead to distinct patterns of recruitment of both signaling and endocytic adaptors to FcεRI.
High-Resolution EM Imaging Confirms DF3 Induces the Formation of FcεRI Signaling Patches
Steady-state simulations predict that most of the cell’s complement of 300000 receptors could be cross-linked into small and large aggregates at low or high doses of trivalent ligand that restrict degranulation. We next used immunoelectron microscopy methods to characterize the redistribution of FcεRI after exposure to DF3 at all doses considered. Native membrane sheets were prepared from resting or stimulated RBL cells, immunogold-labeled for FcεRIβ, and imaged by TEM.4,27 As expected on the basis of earlier studies, we observed FcεRI to be non-randomly distributed in the resting state (Figure 3A). For resting receptors, clustering is modest, an indicator of FcεRI proximity, and not indicative of preformed aggregates. Rather, these small clusters are thought to reflect transient co-confinement of diffusing receptors in rafts and islands or corrals.4,25 Images in panels B and C of Figure 3 show that receptors accumulate in electron-dense regions of the membrane at both the optimal (10 nM) and inhibitory (300 nM) doses of DF3. An increase in the level of clustering at all doses of DF3 was confirmed by applying the Hopkins spatial statistic test to a minimum of 10 images per data set. These results are summarized in Figure 3D, which indicates that an increase in the level of receptor clustering is statistically significant for both optimal (10 nM) and suboptimal (1 and 300 nM) doses.
It is important to emphasize that both fluorescence (Figure 2E) and electron microscopy (Figure 3) methods do not provide direct measures of aggregation, because increases in receptor density after activation are likely to reflect nearby aggregates of various sizes that have coalesced into a “signaling patch”.4 Thus, the computational model provides complementary information and arguably a more precise estimate of the size distribution of receptor aggregates.
DF3 Triggers a Differential, Dose-Dependent Signal Initiating Phosphorylation Events
Dose-dependent differences in phosphorylation of proteins that trigger signal initiation in response to DF3 were evaluated. Lysates were prepared from RBL cells challenged with either 1, 10, or 300 nM DF3. In Figure 4A, receptor complexes were isolated by immunoprecipitation using anti-FcεRI γ and β subunit antibodies, followed by sodium dodecyl sulfate–polyacrylamide gel electrophoresis (SDS–PAGE) and Western blotting with pan-reactive anti-phosphotyrosine antibodies or antibodies against ITAM-bearing β and γ subunits. To evaluate Syk and Lyn phosphorylation, Western blots were probed with phospho-specific antibodies. Results are plotted in Figure 4B, expressed as values normalized to either total protein or β-actin. Phosphorylation of FcεRI subunits and Syk continues to increase during stimulation for up to 5 min with the optimal dose of DF3 (10 nM). Although phosphorylation of both FcεRI subunits was markedly lower at low (1 nM) and high DF3 doses (300 nM), when compared to that at the optimal dose, the decrease in γ phosphorylation was significantly greater (∼2–3-fold) than that in β phosphorylation. Elevated β phosphorylation at inhibitory doses most likely is linked to negative signaling, based on previous studies that show its increased phosphorylation during inhibitory signaling and association with negative signaling molecules SHP-1 and SHIP.28,29 Compared to that at an optimal dose stimulus, Syk phosphorylation was reduced only ∼2-fold at a high dose but was ∼7-fold lower after stimulation for 5 min at a low dose. Lyn dephosphorylation at the inhibitory site Y507 was significantly reduced upon low-dose stimulation, whereas high-dose stimulation led to a dephosphorylation rate similar to that seen with the optimal dose.
Figure 4.

Characterization of upstream and downstream events in response to DF3. (A) Tyrosine phosphorylation kinetics of FcεRI β and γ subunits measured in anti-FcεRIγ and anti-FcεRIβ immunoprecipitates and Syk346 and Lyn507 phosphorylation kinetics measured in whole cell lysates. (B) Quantification of blots shown in panel A, where normalized band intensities are plotted vs stimulation time. (C) Fura-2-loaded individual cells were stimulated with DF3. Ratio intensities (360/385) were measured and converted to [Ca2+] as described in Methods. (D) Internalization of FcεRI measured by acid stripping of cells sensitized with fluorescent IgE and stimulated with DF3. Confocal images show the increase in internalized pools of fluorescent IgE over time. The plot illustrates the kinetics of fluorescent IgE–FcεRI endocytosis, as measured by flow cytometry. All data are representative of at least two independent experiments.
Inhibition of Degranulation at Low and High DF3 Doses Correlates with Calcium Responses and Is Not Due to Enhanced Clearance of Surface Receptors
Results in Figure 4C show that high and low doses of DF3 induce Ca2+ responses weaker than that elicited by the optimal dose of DF3. In these experiments, IgE-primed RBL cells were preloaded with Fura-2 AM, followed by single-cell, ratio imaging microscopy during antigen challenge. A typical response to 10 nM DF3 is a rapid spike in the intracellular calcium concentration followed by an oscillatory sustained phase. By comparison, calcium responses to 1 or 300 nM DF3 typically exhibited a weak or absent initial spike, followed by oscillations that return almost to baseline in the intervals. Because mast cell secretion is calcium-dependent, these results are consistent with poor degranulation at suboptimal ligand doses.
Finally, Figure 4D reports results of experiments designed to test the possibility that low and/or high doses of DF3 might result in more extensive clearance of receptors from the cell surface, which could theoretically limit sustained signaling. The assay is illustrated in the images in Figure 4D, where cells were sensitized with IgE-Alexa647, incubated with the DF3 ligand at 37 °C to permit internalization, and then briefly exposed to an acidic wash at 4 °C to strip off surface IgE. The image at the top left reports levels of red fluorescent IgE bound to resting cells in the absence of an acid wash. For quantification, identical samples were processed for flow cytometry, with and without acid stripping. The results show that, contrary to the possibility of a greater level of endocytosis at high doses, only ∼15% of receptors are endocytosed after incubation with 300 nM ligand. This endocytosis occurs within the first 2 min, followed by cessation of further internalization. This is consistent with the model predictions in Figure 2, where continued binding of excess ligand reduces the size of aggregates but does not ablate them. By comparison, endocytosis does not slow dramatically until 10 min at the optimal dose of the trivalent ligand (10 nM DF3). The lowest dose (1 nM) of the ligand supports endocytosis for up to 20 min, achieving the highest total level of internalization at ∼50%. Thus, the lowest dose of ligand, which is a poor degranulating stimulus, clearly triggers the post-translational modifications (phosphorylation and ubiquitination) that are associated with immunoreceptor endocytosis.30
It is notable that other trivalent and bivalent ligands fail to cause measurable internalization upon FcεRI cross-linking.14,31 This suggests that, in addition to aggregate size, structural aspects of antigens other than valency are important factors in endocytosis. These factors remain unknown but could include the distance between antigen binding sites or the flexibility of the carrier.
SHIP Colocalizes with Resting and Activated FcεRI, with Enhanced Kinetics at Inhibitory Doses
The persistence of substantially sized receptor clusters (which likely represent groups of aggregates) at inhibitory doses is confirmed by our EM studies. On the basis of this observation, we hypothesized that positive signaling is being counteracted by negative signaling at these doses, perhaps by the recruitment of phosphatases. The inositol phosphatase SHIP has been previously shown to downregulate FcεRI signaling at supraoptimal antigen concentrations.32 Therefore, we next evaluated its colocalization with FcεRI under resting and stimulated conditions. Images in Figure 5 illustrate this protocol, where membrane sheets were immunogold-labeled using antibodies to phospho-SHIP (5 nm gold) and FcεRI (10 nm gold) and imaged by TEM. This high-resolution imaging method reveals dose-dependent coclustering of phospho-SHIP with FcεRI β. We found that, although the label for phospho-SHIP is relatively sparse in resting cells, where it is found it is consistently colocalized with resting FcεRI (arrows, Figure 5A, left). As the stimulus proceeds, additional phospho-SHIP accumulates on cell membranes, where it largely colocalizes with receptor signaling patches (small gold particles, Figure 5A). Remarkably, as shown, the extent of phospho-SHIP colocalization with FcεRI showed different kinetics for three doses of DF3. Treatment groups were found to be statistically different using a one-way analysis of variance (ANOVA) test (p = 4.54 × 10⁻⁸). For both suboptimal (1 nM) and supraoptimal (300 nM) doses, accumulation of phospho-SHIP was most notable at 2 min. In contrast, phospho-SHIP colocalization with receptors at 2 min at the optimal dose was low [10 nM (Figure 5B)], increasing to more significant levels at 5 min.
Figure 5.

Dose-dependent role of SHIP in FcεRI signaling. (A) TEM images of membrane sheets prepared from cells after the FcεRI had been cross-linked for 2 min with indicated doses of DF3 and immunogold labeling for SHIP (6 nm gold) and FcεRI β (12 nm gold). Arrows point to coclusters of SHIP and FcεRI β. The bar is 0.1 μm. Images are accompanied by their Ripley’s bivariate test results. (B) Gold particles marking SHIP were scored for coclustering with FcεRI β in membrane sheets from resting cells and cells stimulated for 2 and 5 min. At least 2000 gold particles were counted for each experimental condition. The asterisk indicates clustering is statistically different between any two doses at 2 min. (C) Membrane recruitment of phospho-SHIP with the DF3 stimulus. Cells were stimulated, followed by fractionation to yield crude membrane fractions. Samples were separated by SDS–PAGE and immunoblotted with the anti-phospho-SHIP antibody. (D) Proximity ligation assay confirming the interaction of phospho-SHIP with the β subunit of FcεRI. The fluorescent signal was measured in RBL-2H3 cells overexpressing chimeric FceRI β either under basal conditions or by cross-linking the chimeric receptor, and basal or stimulated (10 nM DF3) wild-type RBL-2H3 cells. Results are representative of two independent experiments. (E) Western blot confirming 60% knockdown of Lyn or 10-fold overexpression of Lyn in RBL-2H3 cells. (F) Proximity ligation assay measuring phospho-SHIP and β interaction in either Lyn knockdown (KD) or Lyn overexpression (O/X) cells stimulated with 10 nM DF3. Results are representative of two independent experiments. (G) Degranulation response in RBL-2H3 cells with Lyn KD, based on the percent of total β-hexosaminidase released from cells after stimulation with indicated doses of DF3 for 30 min. Error bars represent the standard deviation. Results are representative of at least two independent experiments.
Biochemical experiments were performed to confirm the rapid recruitment of phospho-SHIP to the membrane with sub- and supraoptimal doses of DF3 (Figure 5C). A simple cell fractionation experiment revealed the presence of phospho-SHIP at the membrane upon the DF3 stimulus for 2 min with inhibitory doses, but not with the optimal dose.
It is important to note that both the EM and membrane fractionation methods strongly indicate the recruitment of SHIP to receptor signaling patches but do not report the direct interaction of proteins. In addition to FcεRI subunits,33 SHIP has several other potential docking partners, including adaptor proteins such as Shc, Grb2, and Dok.34,35 SHIP can also be recruited to PI(3,4)P2 via its C2 domain.36 We next used the proximity ligation assay (PLA) in RBL cells transfected with a chimeric receptor composed of the extracellular and transmembrane domains of the IL-2 α subunit (Tac antigen) joined to the cytoplasmic domain of the FcεRI β subunit;37 this construct is termed TTβ. Transfected cells were fixed before or after TTβ had been cross-linked with anti-Tac antibodies, permeabilized, and incubated with primary antibodies against SHIP and FcεRI β that were conjugated with the paired PLA probes. Following ligation and amplification, fluorescent oligonucleotide probes were imaged and quantified as spots by confocal imaging. Results in Figure 5D show that TTβ cross-linking led to the significant recruitment of SHIP to the chimeric β receptor, providing evidence that SHIP and β likely interact or are part of a complex, given their proximity (<40 nm) as detected by PLA.
Figure 5D also shows results of the PLA after cross-linking of IgE–FcεRI complexes with DF3 in RBL cells. Like the isolated chimeric β, phospho-SHIP is recruited to the intact receptor after cross-linking (compare images in basal and simulated wild-type RBL cells). Because Lyn is principally responsible for β ITAM phosphorylation37 and also a potential binding partner for SHIP,34 we also compared results of the PLA in cells overexpressing Lyn (Lyn O/X in Figure 5F) to results in cells treated with siRNA to knock down Lyn (Lyn KD in Figure 5F). Results show that the recruitment of phospho-SHIP to FcεRI β is strongly dependent on Lyn: the level is dramatically increased upon Lyn overexpression and significantly reduced upon Lyn knockdown in RBL cells. Western blots in Figure 5E show the comparative levels of Lyn in wild-type (WT), Lyn KD, and Lyn O/X cells. Finally, the link between Lyn and negative regulation of secretion is illustrated in Figure 5G, where Lyn knockdown (60%) results in a significant increase in the level of DF3-stimulated degranulation over a wide range of doses.
It is intriguing to speculate that incomplete ITAM phosphorylation may be the reason that aggregates induced at low or supraoptimal doses favor faster SHIP recruitment, but reduced Syk activity. This hypothesis is based upon the recent study by Cambier and colleagues, who showed that monophosphorylation of Igα and Igβ ITAMs drive the activation of SHIP-Dok circuitry to cause anergy in B cells.38 SHIP, with its single SH2 domain, is favored for recruitment to monophosphorylated ITAMs over Syk, which has two SH2 domains that interact with dually phosphorylated FcεRI γ ITAM. New reagents are needed to evaluate the mono- and biphosphorylation status of FcεRI β/γ ITAMs after the DF3 stimulus. This is an important future direction, because monophosphorylation is a reasonable mechanism for the conversion of a positive signaling ITAM to an inhibitory one (ITAMi). The phenomenon of inhibitory signaling from other FcR has been described recently, including the formation of “inhibisome” clusters that also recruit protein phosphatase SHP-1.39
The Dose–Response Curve for Degranulation Is Differentially Regulated by Protein/Inositol Phosphatases
FcεRI signal initiation, including activation of SHIP and Syk, is regulated by protein tyrosine phosphatases. The closely related protein tyrosine phosphatases, SHP-1 and SHP-2, have been described as negative and positive effectors of FcεRI activation. Although both bind to FcεRI and affect phosphorylation events downstream, no significant changes in mast cell degranulation have been previously reported.40,41 We assessed the effect of SHIP, SHP-1, and SHP-2 knockdown on degranulation responses to a wide range of DF3 doses. The Western blot in Figure 6A shows that treatment with specific siRNA for 24 h was optimal for lowering endogenous levels of SHIP, SHP-1, and SHP-2 by 70–90%. The knockdown of both SHIP and SHP-1 produced a marked increase in the level of mast cell degranulation across all doses of DF3 (Figure 6B). With a 30 min stimulus, results show that the most dramatic enhancement of degranulation was at the suboptimal dose of 1 nM, with a >6-fold increase in response seen with SHIP KD and an ∼3-fold increase in response to SHP-1 KD after stimulation for 30 min.
Figure 6.

Positive and negative regulators of mast cell signaling. (A) Western blot confirming the 75, 90, and 71% knockdown of SHIP, SHP-1, and SHP-2, respectively. (B) Degranulation response after DF3 stimulation for 30 min in RBL-2H3 cells knocked down for SHIP and SHP-1. (C) Degranulation response or fold change in secretion in RBL-2H3 cells knocked down for SHIP after stimulation for 10 or 30 min. (D) Degranulation response after stimulation for 30 min in RBL-2H3 cells knocked down for SHP-2 (C). Degranulation values in panels B–D are based on the percent of total β-hexosaminidase released from cells after stimulation with the indicated doses of DF3. Error bars represent the standard deviation. Results are representative of three independent experiments. (E and F) Tyrosine phosphorylation kinetics of Syk346 measured in whole cell lysates from WT, SHP-1, and SHP-2 KD cells stimulated with 10 nM DF3. Results are representative of three independent experiments. (G) Quantification of the fluorescent signal from PLA for the Lyn–FcεRI β interaction in WT and SHP-2 KD cells. Bars represent the standard deviation of mean fluorescent spots counted from at least 80 cells (n), from seven fields of view. Results are representative of two independent experiments.
The kinetics of clustering and internalization were shown above to differ markedly across suboptimal and supraoptimal doses. Thus, dose-dependent differences in the kinetics of degranulation were also evaluated by measuring degranulation responses after SHIP knockdown and shorter exposures to DF3 (Figure 6C). The fold increase in secretion at 300 nM was marked in SHIP KD cells with a 10 min stimulus, consistent with the rapid rise in the recruitment of SHIP to FcεRI signaling patches at this high dose (Figure 5B).
Inhibition of calcium responses and degranulation by SHIP has been shown previously,32 consistent with a role for its substrate PIP3 (phosphatidylinositol-3,4,5-P3) as an allosteric activator of PLCγ isoforms in mast cells.42 The regulation of SHIP’s own activity is somewhat ambiguous. We found that changes in SHIP phosphorylation were modest over all doses of DF3 (data not shown). This suggests that membrane recruitment, measured here by TEM and by PLAs, is a critical readout of SHIP activation. Allosteric regulation of SHIP36 during this recruitment may also play an important role.
Contrary to SHP-1, knockdown of SHP-2 significantly decreases the degranulation response across all doses (Figure 6D), thus demonstrating its opposing role as a positive regulator of mast cell responses. Lowering SHP-2 levels led to a sustained reduction in the level of Syk phosphorylation (Figure 6E,F) as well as a modest but statistically significant (p < 0.03) reduction in the level of interaction of Lyn with FcεRI β (Figure 6G). As discussed further below, these data underscore the dual roles for Lyn in FcεRI signaling. Lyn is required to accelerate ITAM phosphorylation for the recruitment and activation of Syk, a step that is influenced by SHP-2. As a negative regulator, Lyn is critical for recruiting SHIP to FcεRI and likely linked to SHP-1.
Summary and Conclusions
In this study, we have characterized a novel trivalent ligand, DF3, which triggers robust and dose-dependent mast cell responses by efficiently cross-linking the IgE–FcεRI complexes. The variability in distance between cross-linked receptors predicted by structural modeling suggests increased complexity in aggregate geometry could influence the recruitment of downstream signaling proteins. Using both experimental and computational approaches, we characterized dose-dependent receptor aggregate properties and observed the persistence of large receptor aggregates even at inhibitory doses. Furthermore, we observe dose-dependent differences in the kinetics of receptor aggregation that lead to the equilibrium state. On the basis of these observations, we hypothesized that reduced mast cell responses with suboptimal dose stimulation are caused by a shift in the activation of positive and negative signaling, causing preferential recruitment of phosphatases over Syk to FcεRI. At the optimal dose, receptor clusters are capable of overriding negative signaling by primarily recruiting Syk. Support for this hypothesis comes from the observation that Syk is weakly phosphorylated, whereas the inositol phosphatase SHIP is more rapidly recruited to the receptor, at inhibitory doses of 1 and 300 nM. This is potentially caused by ITAM monophosphorylation.38
RNAi-mediated studies were performed to characterize the role of phosphatases SHIP, SHP-1, and SHP-2 in regulating mast cell responses. Interestingly, in our study, both SHIP and SHP-1 were shown to negatively regulate degranulation across all doses. Knockdown of SHP-1 leads to increased Syk phosphorylation over time. On the other hand, SHP-2 knockdown causes significant reduction in both the degranulation response and Syk phosphorylation. Thus, SHP-1 and SHP-2 are key phosphatases that tune the secretory response, potentially by regulating SHIP and Syk signaling loops, respectively. Our results demonstrate that optimal secretory responses of mast cells and basophils depend on the formation of receptor aggregates capable of overriding negative regulatory signals. Future studies are required to better understand how different aggregate sizes tip the balance of positive and negative signaling.
Methods
Additional details about the experimental and computational methods may be found in the Supporting Information.
DF3 Synthesis and Purification
The trivalent ligand was synthesized by AnaSpec. Briefly, Fmoc-Lys(5-Mtt)-OH was loaded onto HMP resin, followed by treatment with 20% piperidine in DMF to generate H-Lys(Mtt)-HMP resin. Peptide assembly was completed by sequentially coupling each designated Fmoc-AA(xx)-OH in an HCTU/NMM/DMF mixture and de-Fmoc using 20% piperdine in DMF. The resin was split into two portions to produce either the unmodified (dark) peptide or a variant with a fluorescent (5FAM) tag at the COOH terminus. After the last Fmoc-Lys(DNP)-OH coupling, the Mtt protecting group of Lys(Mtt) was removed with a 1% TFA cocktail and N-teminal Fmoc was removed with 20% piperidine in DMF. Treatment with cleavage cocktail released the crude peptide, which was purified by preparative reversed phase high-performance liquid chromatography and lyophilized.
Degranulation, Western Blotting, Internalization, Membrane Fractionation, and EM Assays
Cell monolayers were grown in 24-well tissue culture plates for 24 h and sensitized with 5 nM IgEDNP. Measurement of β-hexosaminidase release and immunoblotting were performed as described previously.43 Internalization of IgE–FcεRI complexes was measured by a previously described acid stripping protocol and flow cytometry.25 Fluorescent images of cells stimulated with DF35FAM were taken on an inverted Olympus IX71 microscope using a 150× objective lens. Membrane fractionation was performed as previously described.44 Methods for the preparation of mast cell membrane sheets and immunogold labeling FcεRI have been described.27 Digital images were acquired using a Hitachi H600 transmission electron microscope, followed by image processing to capture the FcεRI gold particle distribution and use of published methods for statistical analysis of clustering.45 Statistical differences were also computed using a one-way ANOVA test in MATLAB (version 8.0.0, The MathWorks).
Flow Cytometry-Based Binding Assays
Suspensions of sensitized RBL cells (2 × 10⁶ cells/mL) were incubated at room temperature with DF35FAM at doses ranging from 0.01 to 1000 nM while the mixture was gently shaken. After 1 h, the mean fluorescence (520 nm) was measured on a Becton Dickinson FACScan flow cytometer, controlled with Cell Quest software. The fluorescence of nonsensitized cells, incubated with a fluorescent ligand under identical conditions, served as a baseline control for nonspecific binding.
Single-Particle Tracking
Experiments were performed using functionally monovalent QD-IgE,26,46 and analysis of single-quantum dot tracking was performed as previously described.46 Diffusion coefficients (D1–3) were determined by fitting the first three points of the mean squared displacement (MSD) plots to the equation MSD = offset + 4D1–3Δt;47 the median D for all trajectories under each treatment condition is reported, and the distribution of values can be seen in the cumulative probability analysis plot.
Calcium Measurements
Cells were loaded with Fura-2 AM for 30 min before being washed and observed on an inverted Olympus IX71 microscope, equipped with a Til Monochromator (TILL Photonics). Excitation light alternately passed through 10 nm band-pass filters centered at 350 and 380 nm; emission was collected with a 510 nm WB 40 filter (Omega Optical). Images were acquired with an Andor iXon EM-CCD camera and reagents added by manual micropipet. Ratio values for each cell in a field were calculated for user-defined regions after background subtraction and converted to [Ca2+] using the Fura-2 calcium imaging calibration kit. Analysis was performed using ImageJ48 and Prism (GraphPad Software).
Clustering Analysis
Stimulated cells were fixed and imaged with an inverted Olympus 1X71 instrument (Mercury fluorescence lamp), with a 150× oil objective. Images were deconvolved using Huygens Essential software, and the top few slices of each cell were used for analysis. Roughly 20 cells per treatment group were used for analysis. Image analysis was performed using a custom script written in MATLAB (version 8.0.0, The MathWorks).
Proximity Ligation Assays
Cells grown on coverslips were stimulated with DF3, fixed with 2% PFA, and permeabilized with 0.1% Triton-X in PBS. Cells were blocked in 3% BSA (in PBS) and incubated with primary antibodies at a 1:100 dilution in blocking buffer for 1 h. To detect the proximity between two proteins, complementary secondary probes (PLUS and MINUS) binding the primaries raised in different species were added to cells at a 1:5 dilution in blocking buffer for 60 min at 37 °C. Subsequent detection of the proximity of bound probes was performed with an in situ PLA detection kit (Olink), as per the manufacturer’s instructions. Cells were imaged with an LSM510 META confocal microscope. PLA signals represented by individual punctas were quantified using Omero.49 Statistical differences were computed using a Student’s t test.
Nucleofection of siRNAs
RBL-2H3 cells were transfected with Qiagen Flexi Tube siRNA for rat SHIP, SHP-1, and SHP-2 or Lyn SmartPool siRNA from Dharmacon. The Amaxa Nucleofector and Cell Line Nucleofector kit T (Lonza Cologne GmbH) were utilized according to the manufacturer’s protocol. Cells were transfected with 0.25–0.5 μg of siRNA per 1 million cells and plated in regular growth medium. The cultures were allowed to rest for 24 h before experiments were performed and the efficiency of knockdown was determined via immunoblot analyses.
Computational Modeling of Structures and Ligand–Receptor Binding
Structural models of ligand-induced receptor aggregates were built using the motif binding geometry method,50 homology modeling, and molecular dynamics. A model for IgE bound simultaneously to FcεRIα and DNP was constructed on the basis of available structures [Protein Data Bank (PDB) entries 1OAU, 2VWE, 1O0V, and 1F6A] and knowledge of how these molecules interact. The structure of the trimeric foldon is known (PDB entry 1RFO). The structure of the linker peptide used to connect the foldon to DNP was determined using an algorithm for modeling protein loops with fixed ends.51 Our model for the interaction of DF3 with cell-surface IgE was formulated in terms of local rules and simulated as described previously.8 A novel aspect of the model is a negative application condition that prohibits interactions between aggregates containing more than a threshold number of receptors. Additional details about the model and a description of how parameters were estimated on the basis of equilibrium binding data are given in the Supporting Information.
Acknowledgments
Use of the University of New Mexico (UNM) Electron Microscopy, Fluorescence Microscopy, and Flow Cytometry Shared Resource Centers at the UNM School of Medicine and Cancer Center, and National Institutes of Health support for these cores, is gratefully acknowledged. We thank G. Zwartz (UNM) and J. Schmidt (Los Alamos National Laboratory) for technical assistance.
Supporting Information Available
Supplemental methods, Figures 1–4, and references. This material is available free of charge via the Internet at http://pubs.acs.org.
Author Present Address
@ F.A.E.: Department of Mathematics and Statistics, Kennesaw State University, Kennesaw, GA 30144.
This work was supported by National Institutes of Health Grants P50 GM085273 and R01 AI051575.
The authors declare that they have no conflict of interest.
Funding Statement
National Institutes of Health, United States
Supplementary Material
References
- Fewtrell C.; Metzger H. (1980) Larger oligomers of IgE are more effective than dimers in stimulating rat basophilic leukemia cells. J. Immunol. 125, 701–710. [PubMed] [Google Scholar]
- Baird E. J.; Holowka D.; Coates G. W.; Baird B. (2003) Highly effective poly(ethylene glycol) architectures for specific inhibition of immune receptor activation. Biochemistry 42, 12739–12748. [DOI] [PubMed] [Google Scholar]
- Segal D. M.; Taurog J. D.; Metzger H. (1977) Dimeric immunoglobin E serves as a unit signal for mast cell degranulation. Proc. Natl. Acad. Sci. U.S.A. 74, 2993–2997. [DOI] [PMC free article] [PubMed] [Google Scholar]
- Wilson B. S.; Oliver J. M.; Lidke D. S. (2011) Spatio-temporal signaling in mast cells. Adv. Exp. Med. Biol. 716, 91–106. [DOI] [PMC free article] [PubMed] [Google Scholar]
- Halowka D.; Sil D.; Torigoe C.; Baird B. (2007) Insights into immunoglubulin E receptor signaling from structurally defined ligands. Immunol. Rev. 217, 269–279. [DOI] [PubMed] [Google Scholar]
- Liu F. T.; Bohn J. W.; Ferry E. L.; Yamamoto H.; Molinaro C.; Sherman L.; Klinman N.; Katz D. (1980) Monoclonal dinitrophenylspecific murine IgE antibody: Preparation, isolation, and characterization. J. Immunol. 124, 2728–2737. [PubMed] [Google Scholar]
- Hlavacek W. S.; Perelson A. S.; Sulzer B.; Bold J.; Paar J.; Gorman W.; Posner R. G. (1999) Quantifying aggregation of IgE-FcεRI by multivalent antigen. Biophys. J. 76, 2421–2431. [DOI] [PMC free article] [PubMed] [Google Scholar]
- Monine M. I.; Posner R. G.; Savage P. B.; Faeder J. R.; Hlacacek W. S. (2010) Modeling multivalent ligand-receptor interactions with steric constraints on configurations of cell-surface receptor aggregates. Biophys. J. 96, 2604–2623. [DOI] [PMC free article] [PubMed] [Google Scholar]
- Letarov A. V.; Londer Y. Y.; Boudko S. P.; Mesyanzhinov V. V. (1999) The carboxy-terminal domain initiates trimerization of bacteriophage T4 fibritin. Biochemistry (Moscow) 64, 817–823. [PubMed] [Google Scholar]
- Boudko S. P.; Londer Y. Y.; Letarov A. V.; Sernova N. V.; Engel J.; Mesyanzhinov V. V. (2002) Domain organization, folding and stability of bacteriophage T4 fibritin, a segmented coiled-coil protein. Eur. J. Biochem. 269, 833–841. [DOI] [PubMed] [Google Scholar]
- Gibbs B. F.; Rathling A.; Zillikens D.; Huber M.; Hass H. (2006) Initial FceRI-mediated signal strength plays a key role in regulating basophil signaling and deactivation. J. Allergy Clin. Immunol. 118, 1060–1067. [DOI] [PubMed] [Google Scholar]
- Huber M.; Helgason C. D.; Damen J. E.; Liu L.; Humphries R. K.; Krystal G. (1998) The src homology 2-containing inositol phosphatase (SHIP) is the gatekeeper of mast cell degranulation. Proc. Natl. Acad. Sci. U.S.A. 95, 11330–11335. [DOI] [PMC free article] [PubMed] [Google Scholar]
- Magro A.; Alexancer A. (1974) Histamine release: In vitro studies of the inhibitory region of the dose-response curve. J. Immunol. 112, 1762. [PubMed] [Google Scholar]
- Sil S.; Lee J. B.; Luo D.; Holowka D.; Baird B. (2007) Trivalent ligands with rigid DNA spacers reveal structural requirements for IgE receptor signaling in RBL mast cells. ACS Chem. Biol. 2, 674–684. [DOI] [PMC free article] [PubMed] [Google Scholar]
- Meier S.; Guthe S.; Kiefhaber T.; Grzesiek S. (2004) Foldon, the Natural Trimerization Domain of T4 Fibritin, Dissociates into a Monomeric A-state Form Containing a Stable b Hairpin: Atomic Details of Trimer Dissociation and Local b-Hairpin Stability from Residual Dipolar Couplings. J. Mol. Biol. 344, 1051–1069. [DOI] [PubMed] [Google Scholar]
- Guthe S.; Kapinos L.; Moglich A.; Meier S.; Gzresiek S.; Kiefhaber T. (2004) Very Fast Folding and Association of a Trimerization Domain from Bacteriophage T4 Fibritin. J. Mol. Biol. 337, 905–915. [DOI] [PubMed] [Google Scholar]
- Garman S. C.; Wurzburg B. A.; Tarchevskaya S. S.; Kinet J. P.; Jardetzky T. S. (2000) Structure of the Fc fragment of human IgE bound to its high affinity receptor FcεRI α. Nature 406, 259–266. [DOI] [PubMed] [Google Scholar]
- Benhamou M.; Siraganian R. P. (1992) Protein-tyrosine phosphorylation: An essential component of FcεRI signaling. Immunol. Today 13, 195–197. [DOI] [PubMed] [Google Scholar]
- Xiao W.; Kashiwakura J.; Hong H.; Yasudo H.; Ando T.; Maeda-Yamamoto M.; Wu D.; Kawakami Y.; Kawakami T. (2011) Phospholipase C-β3 regulates FcεRI-mediated mast cell activation by recruiting the protein phosphatase SHP-1. Immunity 34, 893–904. [DOI] [PMC free article] [PubMed] [Google Scholar]
- Handlogten M. W.; Kiziltepe T.; Bilgicer B. (2013) Design of a heterotetravalent synthetic allergen that reflects epitope heterogeneity and IgE antibody variability to study mast cell degranulation. Biochem. J. 449, 91–99. [DOI] [PMC free article] [PubMed] [Google Scholar]
- Posner R. G.; Geng D.; Haymore S.; Bogert J.; Pecht I.; Licht A.; Savage P. B. (2007) Trivalent Antigens for Degranulation of Mast Cells. Org. Lett. 9, 3551–3554. [DOI] [PMC free article] [PubMed] [Google Scholar]
- Schweitzer-Stenner R.; Licht A.; Luscher I.; Pecht I. (1987) Oligomerization and ring closure of immunoglobulin E class antibodies by divalent haptens. Biochemistry 26, 3602–3612. [DOI] [PubMed] [Google Scholar]
- Kepley C.; Cambier J.; Morel P.; Lujan D.; Ortega E.; Wilson B. S.; Oliver J. M. (2000) Negative regulation of FcεRI signaling by FcγRII costimulation in human blood basophils. J. Allergy Clin. Immunol. 106, 337–348. [DOI] [PubMed] [Google Scholar]
- Goldstein B.; Perelson A. S. (1984) Equilibrium theory for the clustering of bivalent cell surface receptors by trivalent ligands. Application to histamine release from basophils. Biophys. J. 45, 1109–1123. [DOI] [PMC free article] [PubMed] [Google Scholar]
- Andrews N. L.; Pfeiffer J. R.; Martinez A. M.; Haaland D. M.; Davis R. W.; Kawakami T.; Oliver J. M.; Wilson B. S.; Lidke D. S. (2009) Small, mobile FcεRI aggregates are signaling competent. Immunity 31, 469–479. [DOI] [PMC free article] [PubMed] [Google Scholar]
- Andrews N. L.; Lidke K. A.; Pfeiffer J. M.; Burns A. R.; Wilson B. S.; Oliver J. M.; Licht A. (2008) Actin restricts FcεRI diffusion and facilitates antigen-induced receptor immobilization. Nat. Cell Biol. 10, 955–963. [DOI] [PMC free article] [PubMed] [Google Scholar]
- Wilson B. S., Pfeiffer J. M., Raymond-Stintz M. A., Lidke D. S., Andrews N. L., Zhang J., Yin W., Steinberg S., and Oliver J. M. (2008) Exploring membrane domains using native membrane sheets and transmission electron microscopy. In Methods in Molecular Biology (McIntosh T., Ed.) pp 245–261, Humana Press, Totowa, NJ. [DOI] [PubMed] [Google Scholar]
- Andrasfalvy M.; Peterfy H.; Toth G.; Matko J.; Abramson J.; Kerekes K.; Vamosi G.; Pecht I.; Erdei A. (2005) The β subunit of the type I Fcε receptor is a target for peptides inhibting IgE-mediated secretory response of mast cells. J. Immunol. 175, 2801–2806. [DOI] [PubMed] [Google Scholar]
- Furumoto Y.; Nunomura S.; Terada T.; Rivera J.; Ra C. (2004) The FcεRIβ immunoreceptor tyrosine-based activation motif exerts inhibitory control on MAPK and IκB kinase phosphorylation and mast cell cytokine production. J. Biol. Chem. 279, 49177–49187. [DOI] [PubMed] [Google Scholar]
- Mao S.; Varin-Blank N.; Edidin M.; Metzger H. (1991) Immobilization and internalization of mutated IgE receptors in transfected cells. J. Immunol. 146, 958–966. [PubMed] [Google Scholar]
- Santini F.; Keen J. H. (1996) Endocytosis of activated receptors and clathrin-coated pit formation: Deciphering the chicken or egg relationship. J. Cell Biol. 132, 1025–1036. [DOI] [PMC free article] [PubMed] [Google Scholar]
- Gimborn K.; Lessmann E.; Kuppiq S.; Krystal G.; Huber M. (2005) SHIP down-regulates FcεR1-induced degranulation at supraoptimal IgE or antigen levels. J. Immunol. 174, 507–516. [DOI] [PubMed] [Google Scholar]
- Kimura T.; Sakamoto H.; Appella E.; Siraganian R. P. (1997) The negative signaling molecule SH2 domain-containing inositol-polyphosphate 5-phosphatase (SHIP) binds to the tyrosine-phosphorylated β subunit of the high affinity IgE receptor. J. Biol. Chem. 272, 13991–13996. [DOI] [PubMed] [Google Scholar]
- Rohrschneider L. R.; Fuller J. F.; Wolf I. (2000) Structure, function, and biology of SHIP proteins. Genes Dev. 14, 505–520. [PubMed] [Google Scholar]
- Roget K.; Malissen M.; Malbec O.; Maliseen B.; Daeron M. (2008) Non-T cell activation linker promotes mast cell survival by dampening the recruitment of SHIP1 by linker for activation of T cells. J. Immunol. 180, 3689–3698. [DOI] [PubMed] [Google Scholar]
- Ong C. J.; Ming-Lum A.; Nodwell M.; Ghanipour A.; Yang L.; Williams D. E.; Kim J.; Demirjian L.; Qasimi P.; Ruschmann J.; Cao L. P.; Ma K.; Chung S. W.; Duronio V.; Anderson R. J.; Krystal G.; Mui A. L. (2007) Small-molecule agonists of SHIP1 inhibit the phosphoinositide 3-kinase pathway in hematopoietic cells. Blood 110, 1942–1949. [DOI] [PubMed] [Google Scholar]
- Wilson B. S.; Kapp N.; Lee R. J.; Pfeiffer J. R.; Martinez A. M.; Platt Y.; Letourneur F.; Oliver J. M. (1995) Distinct functions of the FcεR1 γ and β subunits in the control of FcεR1-mediated tyrosine kinase activation and signaling responses in RBL-2H3 mast cells. J. Biol. Chem. 270, 4013–4022. [DOI] [PubMed] [Google Scholar]
- O’Neill S.; Getahun A.; Gauld S.; Merrell K.; Tamir I.; Smith M.; Dal Porto J.; Li Q.; Cambier J. (2011) Monophosphorylation of CD79a and CD79b ITAM motifs initiates a SHIP-1 phosphatase-mediated inhibitory signaling cascade required for B cell anergy. Immunity 35, 746–756. [DOI] [PMC free article] [PubMed] [Google Scholar]
- Pfirsch-Maisonnas S.; Aloulou M.; Xu T.; Claver J.; Kanamaru Y.; Tiwari M.; Launay P.; Monteiro R. C.; Blank U. (2011) Inhibitory ITAM signaling traps activating receptors with the phosphatase SHP-1 to form polarized “inhibisome” clusters. Sci. Signaling 4, ra24. [DOI] [PubMed] [Google Scholar]
- Kimura T.; Zhang J.; Sagawa K.; Sakaguchi K.; Appella E.; Siraganian R. P. (1997) Syk-independent tyrosine phosphorylation and association of the protein tyrosine phosphatases SHP-1 and SHP-2 with the high affinity IgE receptor. J. Immunol. 159, 4426–4434. [PubMed] [Google Scholar]
- McPherson V. A.; Sharma N.; Everingham S.; Smith J.; Zhu H. H.; Feng G. S.; Craig A. W. (2009) SH2 domain-containing phosphatase-2 protein-tyrosine phosphatase promotes FcεRI-induced activation of Fyn and Erk pathways leading to TNF α release from bone marrow-derived mast cells. J. Immunol. 183, 4940–4947. [DOI] [PubMed] [Google Scholar]
- Barker S. A.; Caldwell K. K.; Pfeiffer J. R.; Wilson B. S. (1998) Wortmannin-sensitive phosphorylation, translocation, and activation of PLCγ1, but not PLCγ2, in antigen-stimulated RBL-2H3 mast cells. Mol. Biol. Cell 9, 483–496. [DOI] [PMC free article] [PubMed] [Google Scholar]
- Hernandez-Hansen V.; Smith A. J.; Surviladze Z.; Chigaev A.; Mazel T.; Kalesnikoff J.; Lowell C. A.; Krystal G.; Sklar L. A.; Wilson B. S.; Oliver J. M. (2004) Dysregulated FceRI Signaling and Altered Fyn and SHIP Activities in Lyn-Deficient Mast Cells. J. Immunol. 174, 100–112. [DOI] [PubMed] [Google Scholar]
- Yang S.; Raymond-Stintz M. A.; Ying W.; Zhang J.; Lidke D. S.; Steinberg S. L.; Williams L.; Oliver J. M.; Wilson B. S. (2007) Mapping ErbB receptors on breast cancer cell membranes during signal transduction. J. Cell Sci. 120, 2763–2773. [DOI] [PubMed] [Google Scholar]
- Espinoza F. A.; Oliver J. M.; Wilson B. S.; Steinberg S. L. (2012) Using hierarchical clustering and dendrograms to quantify the clustering of membrane proteins. Bull. Math. Biol. 74, 190–211. [DOI] [PMC free article] [PubMed] [Google Scholar]
- Low-Nam S. T.; Lidke D. S.; Cutler P. J.; Roovers R. C.; van Bergen en Henegouwen P. M.; Wilson B. S.; Lidke D. S. (2011) ErbB1 dimerization is promoted by domain co-confinement and stabilized by ligand binding. Nat. Struct. Mol. Biol. 18, 1244–1249. [DOI] [PMC free article] [PubMed] [Google Scholar]
- Kusumi A.; Sako Y.; Yamamoto M. (1993) Confined lateral diffusion of membrane receptors as studied by single particle tracking (nanovid microscopy). Effects of calcium-induced differentiation in cultured epithelial cells. Biophys. J. 65, 2021–2040. [DOI] [PMC free article] [PubMed] [Google Scholar]
- Rasband W. (1997–2011) ImageJ, National Institutes of Health, Bethesda, MD.
- Allan C.; Burel J. M.; Moore J.; Blackburn C.; Linkert M.; Loynton S.; Macdonald D.; Moore W. J.; Neves C.; Patterson A.; Porter M.; Tarkowska A.; Loranger B.; Avondo J.; Lagerstedt I.; Lianas L.; Leo S.; Hands K.; Hay R. T.; Patwardhan A.; Best C.; Kleywegt G. J.; Zanetti G.; Swedlow J. R. (2012) OMERO: Flexible, model-driven data management for experimental biology. Nat. Methods 9, 245–253. [DOI] [PMC free article] [PubMed] [Google Scholar]
- Tung C.-S.; McMohan B. H. (2012) A Structural Model of the E. coli PhoB Dimer in the Transcription Initiation Complex. BMC Struct. Biol. 12, 3. [DOI] [PMC free article] [PubMed] [Google Scholar]
- Ryu K.; Gilchrist R. L.; Tung C.-S.; Ji I.; Ji T. H. (1998) High affinity hormone binding to the extracellular N-terminal extodomain of the follicle-stimulating hormone receptor is critically modulated by exoloop 3. J. Biol. Chem. 273, 28953–28958. [DOI] [PubMed] [Google Scholar]
Associated Data
This section collects any data citations, data availability statements, or supplementary materials included in this article.