

Abstract
Objective
To study the effect of BMI on the prevalence, severity, and 36-month progression of early degenerative changes in the knee by using 3T MRI in middle-aged subjects without radiographic osteoarthritis (OA).
Materials and methods
We examined baseline and 36-month follow-up MR studies from 137 middle-aged individuals (45–55 years old) with risk factors for knee OA but no radiographic OA from the Osteoarthritis Initiative. Subjects were grouped into three categories: normal BMI (BMI<25 kg/m2, n=38), overweight (BMI 25–29.9 kg/m2, n=37), and obese (BMI ≥ 30 kg/m2, n=62). Using 3T MRI, cartilage, meniscus, and bone marrow abnormalities were graded using the OA Whole-organ MR Imaging Score (WORMS). The statistical analysis was corrected as necessary for differences in age, sex, and OA risk factors other than BMI.
Results
The overall prevalence of lesions was 64% for meniscus and 79% for cartilage (including low grade lesions). At baseline, the prevalence and severity of knee lesions was positively associated with BMI, with a nearly fourfold increase in meniscal tears and more than twofold increase in high-grade cartilage defects in obese individuals relative to normal-weight subjects. Over the 36-month follow-up period, the number of new or worsening cartilage lesions of any grade was significantly higher in obese subjects (p=0.039), while there was no significant difference in meniscal lesion progression.
Conclusion
Obesity was associated with both higher prevalence and severity of early degenerative changes in the knee in middle-aged individuals without radiographic OA and with significantly increased cartilage lesion progression (of any grade) over 36 months.
Keywords: Osteoarthritis, Knee, BMI, Obesity, Meniscus, Cartilage
Introduction
Osteoarthritis (OA) affects almost three-quarters of the U.S. population over the age of 65 and commonly affects the knees in elderly individuals [1, 2]. OA inflicts considerable costs on society including decreased economic productivity and often requires total joint replacement [3–6]. Given that these costs will likely rise considerably over the coming years as the population ages and given the paucity of effective therapies, disease prevention is a major focus, and multiple key OA risk factors have been identified. In particular, multiple studies have demonstrated a strong association between obesity and radiographic knee OA [2, 7–9].
Obesity is increasingly being recognized as a major worldwide public health threat, and approximately 72 million Americans are presently considered obese. Beyond the potentially life-threatening co-morbidities associated with obesity, including diabetes, cardiovascular disease, and cancer [10], it is hypothesized that the growing obesity “epidemic” will dramatically increase the burden of OA on society. As such, establishing a link between obesity and early degenerative knee lesions in middle-aged patients would further underscore the need to address the obesity problem before it causes irreparable harm. MRI offers an ideal platform for studying the link between obesity and “early” OA [11, 12]. To date, however, the relationship between obesity and early findings of OA detectable on MRI has not been well established.
The Osteoarthritis Initiative (OAI) is a large ongoing nationwide longitudinal prospective study sponsored by the National Institutes of Health that combines clinical, serologic, and primarily knee joint imaging data obtained annually from 4,796 patients between 45 and 79 years old over a period of 8 years. Recently, the 36-month follow-up MRI studies were released, thereby providing a significant time interval over which to examine OA progression in relation to obesity.
The present study sought (1) to examine the influence of BMI on the prevalence and severity of early degenerative knee abnormalities (including meniscal and cartilage lesions) assessed with 3T MRI and (2) to determine the relative progression of these findings in relation to BMI over 36 months in a subgroup of middle-aged individuals from the OAI incidence cohort.
Materials and methods
Subjects
We studied the right knees of 137 individuals selected from the 4,796 participants in the OAI database (age range between 45 and 79 years old, with a skew towards older patients). The study protocol, amendments, and informed consent documentation were reviewed and approved by the local institutional review boards. Data used in the preparation of this article were obtained from the OAI database, which is available for public access (http://www.oai.ucsf.edu/). The following specific OAI datasets were used: baseline clinical (0.2.2), baseline image (0.E.1), 36-month follow-up clinical (5.2.1), and 36-month follow-up image (5.E.1).
The 137 individuals included in this study were highly selected from the OAI database. The following inclusion criteria were used: (1) individual assigned to the incidence cohort (as defined below; n=3,284), (2) age 45–55 years, (3) availability and acceptable quality of baseline and 36-month follow-up right knee MRIs (with coronal and sagittal FSE sequences), (4) Western Ontario and McMaster University (WOMAC) knee pain score of zero during the week prior to the baseline enrollment visit (approximately 1–2 days before the MRI). Thereafter, we interpreted the baseline visit right knee radiographs of these subselected individuals (n=174) and retained only subjects with Kellgren-Lawrence (KL) grade 0 or 1 at the baseline visit (n=137) [13, 14]. Therefore, our 137 study subjects were middle-aged (45–55 years old) and asymptomatic at baseline (based on WOMAC score) with OA risk factors but no radiographic OA. Of the 137, 38 had a normal BMI<25 kg/m2, 37 had BMI between 25 and 29.9 kg/m2 (overweight), and 62 had BMI ≥ 30 kg/m2 (obese).
Participants in the OAI incidence cohort did not have symptomatic OA in either knee at baseline. Symptomatic OA was defined as the presence of KL grade 2 or greater and, in the same knee, frequent symptoms during the past year. However, they had to have at least one of the following knee OA risk factors: (1) knee symptoms (“pain, aching, or stiffness in or around the knee” or “frequent use of pain medication” for at least 1 month but not on most days in the past 12 months), (2) overweight or obesity, (3) prior knee injury, (4) prior knee surgery, (5) history of knee replacement in a parent or sibling, (6) Heberden’s nodes, and (7) frequent knee bending activity (repetitive activities involving bending, squatting, kneeling, climbing, or lifting).
WOMAC questionnaires
The Western Ontario and McMasters (WOMAC) Osteoarthritis Index is a well-established clinical tool used to quantify OA symptoms in the knee, including pain, stiffness, and physical function [15]. Specifically, pain was assessed during walking, stair climbing, rest, nocturnal bedrest, and weight-bearing. In our study, participants were required to have a WOMAC pain score of 0 (i.e., no pain during any of these five activities) to exclude subjects with right knee pain in the 7 days prior to the baseline MRI.
Imaging
Radiographs
Baseline standing right knee radiographs were obtained using postero-anterior (PA) “fixed flexion” technique (20–30° of flexion and 10° of internal rotation). Two radiologists (W.V. and L.N.) analyzed baseline radiographs in consensus using the KL grading scale [13, 14].
MRI
Baseline and 36-month follow-up right knee MRIs were obtained using 3.0T scanners and standard knee coils (Siemens, Erlangen, Germany). The following four sequences were acquired and used for image analysis: fat-suppressed sagittal and coronal 2D intermediate-weighted (IW) fast spin-echo (FSE) sequences, sagittal 3D dual-echo in steady state (DESS) sequence (with axial reformations), and a 3D fast low angle shot (FLASH) sequence with selective water excitation (WE) [14].
MR image analysis
Following standard clinical radiology practice, paired readings (i.e., not blinded to time point) of baseline and follow-up MRIs were performed using PACS workstations (Agfa, Ridgefield Park, NJ). As part of a “training period,” three radiologists (M.A.L., 4th year radiology resident; W.V., board-certified radiologist with 1 year of MSK fellowship training; L.N., 4th year radiology resident) and a senior MSK radiologist (T.M.L., more than 20 years of experience in MSK radiology) analyzed 30 MRI studies to arrive at a consensus reading and calibrate thresholds for grading abnormalities. The remaining studies were then reviewed independently by the three radiologists. In those instances where scores were not identical, consensus readings were performed with the senior MSK radiologist (T.M.L.).
Degenerative knee abnormalities were semiquantitatively evaluated on all MR images using a modified Whole-organ MR Imaging Scoring (WORMS) method [16]. Given the small number of high-grade lesions expected in our cohort with no radiographic OA and as established in previous studies [17, 18], cartilage and subchondral bone marrow edema abnormalities were assessed separately using the following 6 rather than the original 15 WORMS regions: patella, trochlea, medial/lateral tibia, and medial/lateral femur. Cartilage lesions were graded using the standard WORMS 8-point scale [16]. Similarly, subchondral bone marrow lesions were defined as poorly marginated areas of increased T2 signal intensity and graded using a modified 4-point WORMS scale: 0, none; 1, diameter 0–5 mm; 2, 5–20 mm; 3, >20 mm.
Meniscal lesions were graded separately in six regions (medial/lateral and anterior/body/posterior) using the following 4-point scale: 0, normal; 1, intrasubstance abnormal signal; 2, nondisplaced tear; 3, displaced or complex tear; 4, complete destruction/maceration. As established in previous studies [17, 18], intrasubstance degeneration was added to the WORMS classification to permit the inclusion and quantification of early degenerative disease.
Summation (WORMS Sum) and maximum (WORMS Max) scores were calculated for each joint structure. For example, a patient with a WORMS grade of 3 in the anterior horn of the medial meniscus, and grade 1 lesions in the other five meniscus compartments, would have a meniscal WORMS Sum of 8 but only a WORMS Max of 3. As such, a WORMS Sum score greater than 0 in any joint structure indicated an abnormal knee. Similarly, a WORMS Max score greater than 1 in a patient’s meniscus indicated a small tear or worse, while in a patient’s cartilage, it identified at least a partial thickness defect. The WORMS Max score could be used to exclude lesions characterized only by signal abnormalities (i.e., grade “1” lesions without associated morphologic alteration).
In the 36-month longitudinal analysis, progression was defined as any change involving previously intact knees with new meniscal or cartilage lesions, or existing lesions that worsened. Progression of any grade (i.e., changes in signal only or more severe changes in morphology) was detected by identifying additional or worsening lesions from baseline to follow-up. Similarly, progression to higher grade (any change leading to at least partial meniscal tears or cartilage defects, excluding progression from WORMS grade 0 to 1) was detected using a WORMS Max “delta>0” analysis.
Statistical analysis
At baseline, one-way analysis of variance (ANOVA) was used to compare differences in clinical parameters such as age between categories, e.g., different weight categories defined using BMI ranges. Pearson chi-squared tests were used to compare differences in OA risk factors across the various groups. Finally, multivariate linear and logistic regression models compared the prevalence and severity of knee lesions between categories. Sex, age, and a history of prior knee surgery were identified as significant covariates and corrected for in the statistical analysis. The other five OA risk factors did not affect the p-values. Age was treated as a continuous variable.
In the longitudinal analysis, multivariate linear and logistic regression models were used to compare the change in WORMS scores over 36 months (WORMS Max delta>0) between BMI groups. The statistical model corrected for the only significant covariate in this analysis: a history of prior knee surgery. The level of statistical significance was defined as p<0.05 for all calculations. Statistical analysis was performed using SPSS version 17.0 for Windows (IBM, Chicago, IL).
Reproducibility analyses
Inter- and intra-observer reproducibility measurements were obtained using 10 randomly selected baseline patient image sets. Two radiologists (M.A.L., W.V.) independently analyzed each image set on two separate occasions. Intra-class correlation coefficients (ICC) for meniscus and cartilage lesions were used to compare the exact WORMS score in each compartment by treating the data as a continuous variable.
Results
Relationship among BMI, subject characteristics, and structural knee abnormalities
The entire patient cohort had a mean age of 50.9 ± 2.8 years and an average BMI of 29.0 ± 4.5 kg/m2. Table 1 outlines the baseline distribution of patient characteristics and OA risk factors according to BMI category. Among the various OA risk factors, only the prevalence of knee symptoms proved to be statistically different between BMI categories: 87% in normal BMI subjects, 97% in the overweight, and 71% in the obese (Table 1).
Table 1.
Baseline distribution of patient characteristics and risk factors vs. BMI
| BMI<25 | BMI 25–29.9 | BMI≥30 | p-value (ANOVA) | |
|---|---|---|---|---|
| Age (mean ± SD) (years) | 50.8 ± 3.1 | 49.6 ± 2.9 | 51.7 ± 2.4 | ns |
| Subjects (% of total 137) | 38 (28%) | 37 (27%) | 62 (45%) | 0.006 |
| Sex (male) | 19 (50%) | 30 (81%) | 32 (52%) | |
| Risk factors | ||||
| Knee symptoms (last 12 months) | 33 (87%) | 36 (97%) | 44 (71%) | 0.003 |
| Knee injury | 16 (42%) | 21 (57%) | 29 (47%) | 0.427 |
| Knee surgery | 9 (24%) | 6 (16%) | 7 (11%) | 0.261 |
| Family history (knee replacement) | 8 (21%) | 7 (19%) | 6 (10%) | 0.214 |
| Heberden’s nodes | 7 (18%) | 11 (30%) | 9 (15%) | 0.153 |
| Activity risk (knee bending) | 23 (61%) | 28 (76%) | 48 (77%) | 0.161 |
Unless otherwise noted, values are numbers and percentage of BMI cohort
Table 2 compares the location and severity of morphological knee abnormalities across the three BMI groups. Meniscus lesions were found more frequently in overweight (28/37; 76%) and obese (46/62; 74%) subjects than in normal BMI subjects (13/38; 34%; p=0.03), and findings were significant even after correcting for the significant covariates (sex and a history of knee surgery). Similarly, more severe lesions (WORMS Max>1) were more common in the overweight and obese subjects (38% and 31%, respectively) than in normal-BMI subjects (8%; p=0.014). Multiple lesions in different meniscus compartments also occurred more often in overweight and obese subjects. While obese and overweight subjects had a substantially higher number of lesions in the medial and lateral meniscal bodies, normal subjects had a higher percentage of lesions in the posterior horn of the medial meniscus (Table 2).
Table 2.
Baseline BMI analysis
| BMI < 25
|
BMI 25–29.9
|
BMI≥30
|
Statistic | ||||
|---|---|---|---|---|---|---|---|
| Number | Percentage | Number | Percentage | Number | Percentage | p-value (multi-regression) | |
| Meniscus lesions | |||||||
| Total no. of potential lesions (6 compartments x no. of patients) | 228 | 222 | 372 | ||||
| Number of actual lesions | 16/228 | 7% | 58/222 | 26% | 101/372 | 27% | |
| Medial anterior | 0/16 | 0% | 2/58 | 3% | 4/101 | 4% | |
| Medial body | 1 | 6% | 8 | 14% | 16 | 16% | |
| Medial posterior | 11 | 69% | 25 | 43% | 40 | 40% | |
| Lateral anterior | 1 | 6% | 3 | 5% | 11 | 11% | |
| Lateral body | 0 | 0% | 8 | 14% | 13 | 13% | |
| Lateral posterior | 3 | 19% | 12 | 21% | 17 | 17% | |
| WORMS Sum >0 | 13/38 | 34% | 28/37 | 76% | 46/62 | 74% | <0.001 |
| WORMS Max >1 | 3 | 8% | 14 | 38% | 19 | 31% | 0.014a |
| Cartilage lesions | |||||||
| Total no. of potential lesions (6 compartments x no. of subjects) | 228 | 222 | 372 | ||||
| Number of actual lesions | 33/228 | 14% | 83/222 | 37% | 145/372 | 39% | |
| Patella | 18/33 | 55% | 24/83 | 29% | 47/145 | 32% | |
| Trochlea | 6 | 18% | 16 | 19% | 32 | 22% | |
| MFC | 3 | 9% | 11 | 13% | 19 | 13% | |
| LFC | 1 | 3% | 8 | 10% | 10 | 7% | |
| MT | 2 | 6% | 5 | 6% | 4 | 3% | |
| LT | 3 | 9% | 19 | 23% | 33 | 23% | |
| WORMS Sum >0 | 21/38 | 55% | 30/37 | 81% | 57/62 | 92% | 0.001 |
| WORMS Max >1 | 11 | 29% | 19 | 51% | 41 | 66% | 0.004b |
| Bone marrow edema | |||||||
| WORMS Sum >0 | 11 | 29% | 18 | 49% | 35 | 56% | 0.047 |
| Meniscus WORMS Sum (mean ± SD) | 0.5 ± 0.8 | 2.9 ± 3.5 | 2.5 ± 3.0 | <0.001c | |||
| Meniscus WORMS Max (mean ± SD) | 0.4 ± 0.6 | 1.5 ± 1.4 | 1.3 ± 1.2 | <0.001c | |||
| Cartilage WORMS Sum (mean ± SD) | 1.3 ± 1.5 | 4.1 ± 3.5 | 4.3 ± 3.3 | <0.001 | |||
| Cartilage WORMS Max (mean ± SD) | 1.0 ± 1.1 | 2.0 ± 1.6 | 2.3 ± 1.4 | <0.001 | |||
MFC medial femoral condyle, LFC lateral femoral condyle, MT medial tibia, LT lateral tibia
P-value corrected for the significant covariate(s):
history of knee surgery,
age,
sex and history of prior knee surgery. Otherwise, no correction was required for age, sex, or the six OA risk factors
A similar analysis demonstrated that subjects with higher BMI also had a higher prevalence of cartilage defects (both mild and severe) and bone marrow abnormalities than normal BMI subjects (p<0.05) (Table 2). The patellar cartilage was the compartment most frequently involved in all BMI categories. While cartilage lesions were relatively more prevalent in the lateral tibia in overweight and obese subjects, patellar lesions were found with relatively greater frequency in patients with normal weight. Comparing actual meniscus and cartilage WORMS Sum and Max average scores (as opposed to lesion prevalence) highlighted the same strong positive relationship between the number and severity of lesions and BMI (p<0.001). Of the potential adjustment parameters, only age was identified as a significant covariate in the WORMS Max>1 analysis, and it was corrected for.
Very obese subjects and structural knee abnormalities
The 62 obese patients were further divided into mildly obese (52 patients with BMI 30–35 kg/m2) and severely obese (10 patients with BMI > 35 kg/m2) subgroups. The average cartilage WORMS Sum score was inversely related to BMI: 4.5 ± 3.4 (BMI 30–35 kg/m2) vs. 3.2 ± 3.1 (BMI > 35 kg/m2). The average meniscus WORMS Sum score suggested a similar relationship. Given the small sample size of severely obese subjects (10 patients), however, these differences were not statistically significant (p=0.35).
Longitudinal analysis and OA progression
To evaluate the progression of early degenerative changes in meniscus and cartilage over the 36-month follow-up period, knees with changes of “any grade” and “higher grade” (as described above) were compared across the three BMI categories. A statistically significant progression in the number of knees with cartilage lesions of “any grade” was identified in the obese group (p=0.039): normal BMI 10/38 (26%), and obese 29/62 (47%). Progression was also detected with respect to “higher grade” cartilage defects and meniscal lesions of “any grade”; however results did not reach statistical significance due to the relatively small number of changes (Table 3). No significant progression was identified for bone marrow abnormalities. The relative distribution of cartilage and meniscus lesions by anatomic location appeared unchanged at baseline and follow-up. Examples of degenerative disease progression are provided for the meniscus (Fig. 1) and for cartilage (Fig. 2).
Table 3.
Progression analysis—36-month interval change (delta) in WORMS scores according to BMI
| BMI < 25 (n = 38)
|
BMI 25–29.9 (n = 37)
|
BMI≥30 (n = 62)
|
p-value | ||||
|---|---|---|---|---|---|---|---|
| Numbera | Percentage | Numbera | Percentage | Numbera | Percentage | ||
| Meniscus | |||||||
| Knees with changesb (any grade) | 6 | 16% | 11 | 30% | 16 | 26% | 0.399 |
| New meniscal tearsc | 4 | 11% | 3 | 8% | 7 | 11% | 0.709 |
| Change in one subregion | 4 | 11% | 8 | 22% | 5 | 8% | |
| Change in two subregions | 1 | 3% | 3 | 8% | 9 | 15% | |
| Change in three subregions | 1 | 3% | 0 | 0% | 2 | 3% | |
| Cartilage | |||||||
| Knees with changes (any grade) | 10 | 26% | 9 | 24% | 29 | 47% | 0.039 |
| New higher-grade lesions (≥2)c | 3 | 8% | 3 | 8% | 2 | 3% | 0.321 |
| Change in one subregion | 9 | 24% | 7 | 19% | 24 | 39% | |
| Change in two subregions | 1 | 3% | 2 | 5% | 2 | 3% | |
| Change in three subregions | 0 | 0% | 0 | 0% | 3 | 5% | |
| Bone marrow edema | |||||||
| Knees with changes (any grade) | 8 | 21% | 10 | 27% | 17 | 27% | 0.279 |
Number (and %) of subjects whose WORMS score progressed (i.e., increased) in each BMI category
Statistics corrected for the significant covariate: history of prior knee surgery
Calculated using WORMS Max delta>0
Fig. 1.
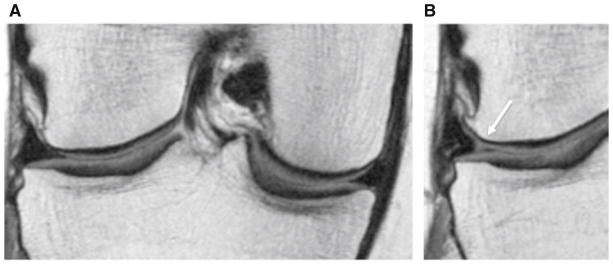
Coronal intermediate-weighted images at baseline (a) and 36-month follow-up (b) demonstrating interval development of a tear of the body of the lateral meniscus in an overweight subject (WORMS grade 2, nondisplaced tear)
Fig 2.

Sagittal 3D dual-echo in steady state (DESS) sequence at baseline (a) and 36-month follow-up (b) in a normal BMI patient demonstrating interval development of a full thickness focal cartilage defect<1 cm of greatest width (WORMS grade 2.5) in the lateral femoral condyle, and abnormal T2 signal in the anterior horn of the lateral meniscus (WORMS grade 1)
Reproducibility of clinical readings
The ICC for interobserver agreement was 0.89, while the ICC for intra-observer agreement was 0.93 and 0.86 for meniscus and cartilage lesions, respectively. These findings demonstrate good WORMS grading reproducibility.
Discussion
This study examined the effect of BMI on the prevalence and progression of right knee abnormalities (cartilage, meniscus, and bone marrow lesions) diagnosed on 3T MRIs in middle-aged individuals without radiographic or clinical OA. At baseline, the prevalence and severity of focal knee lesions increased with BMI. Over the 36-month follow-up period, the number of new or worsening cartilage lesions of “any grade” was significantly higher in obese subjects. Obesity, however, did not confer an increased risk of meniscal or bone marrow lesion progression over 36 months.
Obesity has long been recognized as an important risk factor for OA [7, 8, 19–23]. Coggon et al. reported that subjects with a BMI>30 kg/m2 were 6.8 times more likely to develop knee OA than normal-weight controls [8]. Consistent with this result, a recent meta-analysis by Blagojevic et al. showed that the pooled odds ratio for developing OA was 2.96 for overweight and obese subjects compared to normal-weight controls [24]. Despite this evidence, there are few data regarding the effect of BMI on the development of early degenerative changes in the knees of younger patients that may be precursors of eventual radiographic OA lesions [25–27]. We therefore undertook this study and focused on middle-aged, non-OA patients with OA risk factors who would be most likely to benefit from early intervention.
Our results indicate a higher overall prevalence of meniscal lesions than previously reported by other investigators [17, 25, 28, 29]. This difference can be explained at least in part by the inclusion of grade 1 lesions in our analysis (i.e., abnormalities in signal without associated tears), and the use of high field strength 3T scanners to acquire images in our study. In contrast to Stehling et al. [17], who also analyzed baseline incidence cohort OAI data from asymptomatic middle-aged non-OA patients, our overall prevalence of meniscal lesions was higher (64 vs. 47%). This is likely due to the high proportion of obese patients in our cohort (45%), whereas they had specifically excluded patients with BMI> 27 kg/m2. Indeed, the prevalence of meniscus lesions was only 34% in our subgroup of 38 patients with BMI<25 kg/m2 (Table 3). Furthermore, we found a nearly identical number of meniscal tears as Englund et al. [25] (26 vs. 23%, respectively), whose cohort characteristics were very similar to ours (including average BMI), although their subjects were older than ours on average (62.3 ± 8.6 vs 50.9 ± 2.8 years old) and they were not selected based on OA risk factors (Framingham population). As found in prior studies [25, 30], we noted a higher percentage of meniscal tears in men than women (36 vs. 13%). Overall, our data support Englund et al.’s conclusion that asymptomatic meniscal tears are common in middle-aged individuals.
We found a significantly higher prevalence and severity of degenerative knee lesions in overweight and obese patients compared to normal BMI subjects. Other studies have described an association between meniscus or cartilage abnormalities on MRI and higher BMIs, but only as secondary findings and without adjusting for potentially confounding factors (including KL scores) [25, 26].
Higher BMI was associated with an alteration of the anatomical distribution of meniscal and cartilage abnormalities in our study. Among knees with meniscal lesions, those in overweight and obese patients were more likely to have disease in the bodies of the medial and lateral menisci than normal BMI subjects. Similarly, among knees with cartilage lesions, those in overweight and obese subjects were more likely to have cartilage defects in the lateral tibia, while patellofemoral joint cartilage abnormalities were more prevalent in normal BMI subjects. Our findings in normal-weight subjects were expected, as tears in the posterior horn of the medial meniscus are typically the most common [30], and patellofemoral degenerative changes are most frequently seen in thin, active individuals [18]. The altered lesion distribution in heavier patients may be due to different force vectors affecting the knees in our subset of patients with BMI>25 kg/m2.
Interestingly, while the total number of meniscal and cartilage lesions increased with BMI, this trend appeared to reverse in very obese subjects (BMI>35 kg/m2), although this reversal was not statistically significant, likely due to the small sample size (10 subjects). A possible explanation for this finding is that very obese people are likely less physically active, such that the total load on their knee joints over a given period is lower, even though the effects of gravity are more significant with each individual activity.
Over the 36-month follow-up period, significant progression in the number of knees with cartilage lesions of “any grade” was identified in the higher BMI groups. MR imaging indeed has proven sensitivity to detect signal and morphologic changes in knee structures within relatively short time periods, such as 1–2 years [12, 31, 32]. Of note, the relative anatomical distribution of knee lesions within each BMI subgroup did not change significantly in our study at 36-month follow-up, unlike in Biswal et al. [31]. We also identified progression to “higher-grade” cartilage defects and for meniscal lesions of “any grade.” However, these observations were not statistically significant, perhaps due to the relatively short 36-month follow-up interval and/or relatively small sample size. Raynauld et al. indeed found that BMI and weight were predictors of greater cartilage volume losses [32]. Similarly, prior studies based on radiographs demonstrated that overweight patients are at higher risk of OA progression [23, 33, 34]. As recently described, potential biases arising from methodological difficulties in studying the progression of knee OA may also partially explain the relative difficulty of reaching statistical significance in part of our analysis [35]. Alternatively, our findings may indicate that obesity is more of a risk factor for knee lesion incidence than for progression, as suggested by Cooper et al. [23] and Niu et al. [36]. If this is in fact true, our findings would further underscore the need to address the obesity problem as early as possible in a patient’s life. Further studies looking at younger patient populations would be helpful to determine at what age these changes begin to occur.
There are limitations to our study. First, we focused on degenerative changes found only on MRI as markers of “early degenerative disease” in the knees of relatively young subjects without symptomatic OA. Furthermore, we included grade 1 lesions (MR signal abnormalities) in our analysis to increase our sensitivity for early structural changes. It remains to be proven which, if any, of these early lesions eventually progress to radiographic and/or symptomatic OA. Nevertheless, a number of studies have found that meniscal tears and cartilage defects are predictors of cartilage loss and eventual joint replacement [37], and our study demonstrated that both of these types of lesions are more common in obese individuals. Second, despite our attempts to adjust for potential covariates such as age, gender, and well-established OA risk factors, other unknown confounding factors may not have been accounted for. Third, paired interpretation of the baseline and follow-up images was performed (i.e., not blinded to time point), as they are in clinical settings. This may have provided a more sensitive reading in some cases, as more severe cartilage and meniscal lesions are unlikely to regress. However, this method of reading paired studies may have introduced bias in each reviewer’s lesion progression determination. Note, however, that investigators were blinded to patient information (including BMI) while interpreting the studies, and no attempt was made to infer relative obesity levels based on the amount of subcutaneous fat.
Conclusion
In summary, the results of this study demonstrate that obesity is associated with higher prevalence and severity of early degenerative changes of the cartilage and menisci in the right knee in middle-aged individuals without radiographic OA. Over the 36-month follow-up period, significant progression in the number and grade of cartilage lesions was also identified in obese subjects. Obesity, however, did not confer an increased relative risk of lesion progression for meniscal lesions or high-grade cartilage defects. Given the concern that these early lesions could progress to disabling symptomatic OA over time, and the personal and societal burdens imposed by OA, our findings underscore the importance of public health initiatives aimed at controlling obesity, especially in younger, still asymptomatic patients.
Acknowledgments
The OAI is a public-private partnership comprised of five contracts (N01-AR-2-2258; N01-AR-2-2259; N01-AR-2-2260; N01-AR-2-2261; N01-AR-2-2262) funded by the National Institutes of Health, a branch of the Department of Health and Human Services, and conducted by the OAI Study Investigators. Private funding partners include Merck Research Laboratories, Novartis Pharmaceuticals Corporation, GlaxoSmithKline, and Pfizer, Inc. Private sector funding for the OAI is managed by the Foundation for the National Institutes of Health. The analyses were funded through the NIH (National Institute of Arthritis and Musculoskeletal and Skin Diseases, grant U01-AR-059507). The study sponsors had no involvement in the study design, collection, analysis or interpretation of data, or manuscript editing.
Abbreviations
- BMI
Body mass index
- KL
Kellgren Lawrence
- MRI
Magnetic resonance imaging
- OA
Osteoarthritis
- OAI
Osteoarthritis Initiative
- WOMAC
Western Ontario and McMaster University
- WORMS
Whole-organ MR Imaging Score
Footnotes
Conflict of interest There is no conflict of interest for any author.
Contributor Information
Marc A. Laberge, Email: marc.laberge@ucsf.edu, Musculoskeletal and Quantitative Imaging Research, Department of Radiology and Biomedical Imaging, University of California San Francisco, 185 Berry Street, Suite 350, San Francisco, CA 94107, USA
Thomas Baum, Musculoskeletal and Quantitative Imaging Research, Department of Radiology and Biomedical Imaging, University of California San Francisco, 185 Berry Street, Suite 350, San Francisco, CA 94107, USA.
Warapat Virayavanich, Musculoskeletal and Quantitative Imaging Research, Department of Radiology and Biomedical Imaging, University of California San Francisco, 185 Berry Street, Suite 350, San Francisco, CA 94107, USA.
Lorenzo Nardo, Musculoskeletal and Quantitative Imaging Research, Department of Radiology and Biomedical Imaging, University of California San Francisco, 185 Berry Street, Suite 350, San Francisco, CA 94107, USA.
M. C. Nevitt, Department of Epidemiology and Biostatistics, University of California San Francisco, 185 Berry Street, Suite 5700, San Francisco, CA 94107, USA
J. Lynch, Department of Epidemiology and Biostatistics, University of California San Francisco, 185 Berry Street, Suite 5700, San Francisco, CA 94107, USA
C. E. McCulloch, Department of Epidemiology and Biostatistics, University of California San Francisco, 185 Berry Street, Suite 5700, San Francisco, CA 94107, USA
Thomas M Link, Musculoskeletal and Quantitative Imaging Research, Department of Radiology and Biomedical Imaging, University of California San Francisco, 185 Berry Street, Suite 350, San Francisco, CA 94107, USA.
References
- 1.Lawrence RC, Felson DT, Helmick CG, Arnold LM, Choi H, Deyo RA, et al. Estimates of the prevalence of arthritis and other rheumatic conditions in the United States. Part II. Arthritis Rheum. 2008;58(1):26–35. doi: 10.1002/art.23176. [DOI] [PMC free article] [PubMed] [Google Scholar]
- 2.Felson DT, Lawrence RC, Dieppe PA, Hirsch R, Helmick CG, Jordan JM, et al. Osteoarthritis: new insights. Part 1: the disease and its risk factors. Ann Intern Med. 2000;133(8):635–46. doi: 10.7326/0003-4819-133-8-200010170-00016. [DOI] [PubMed] [Google Scholar]
- 3.Jinks C, Jordan K, Croft P. Osteoarthritis as a public health problem: the impact of developing knee pain on physical function in adults living in the community: (KNEST 3) Rheumatology (Oxford) 2007;46(5):877–81. doi: 10.1093/rheumatology/kem013. [DOI] [PubMed] [Google Scholar]
- 4.Lopez AD, Mathers CD, Ezzati M, Jamison DT, Murray CJ. Global and regional burden of disease and risk factors, 2001: systematic analysis of population health data. Lancet. 2006;367 (9524):1747–57. doi: 10.1016/S0140-6736(06)68770-9. [DOI] [PubMed] [Google Scholar]
- 5.Wright EA, Katz JN, Cisternas MG, Kessler CL, Wagenseller A, Losina E. Impact of knee osteoarthritis on health care resource utilization in a US population-based national sample. MedCare. 2010;48(9):785–91. doi: 10.1097/MLR.0b013e3181e419b1. [DOI] [PMC free article] [PubMed] [Google Scholar]
- 6.Donald IP, Foy C. A longitudinal study of joint pain in older people. Rheumatology (Oxford) 2004;43(10):1256–60. doi: 10.1093/rheumatology/keh298. [DOI] [PubMed] [Google Scholar]
- 7.Manninen P, Riihimaki H, Heliovaara M, Makela P. Overweight, gender and knee osteoarthritis. Int J Obes Relat Metab Disord. 1996;20(6):595–7. [PubMed] [Google Scholar]
- 8.Coggon D, Reading I, Croft P, McLaren M, Barrett D, Cooper C. Knee osteoarthritis and obesity. Int J Obes Relat Metab Disord. 2001;25(5):622–7. doi: 10.1038/sj.ijo.0801585. [DOI] [PubMed] [Google Scholar]
- 9.Reijman M, Pols HA, Bergink AP, Hazes JM, Belo JN, Lievense AM, et al. Body mass index associated with onset and progression of osteoarthritis of the knee but not of the hip: the Rotterdam Study. Ann Rheum Dis. 2007;66(2):158–62. doi: 10.1136/ard.2006.053538. [DOI] [PMC free article] [PubMed] [Google Scholar]
- 10.Calle EE, Rodriguez C, Walker-Thurmond K, Thun MJ. Overweight, obesity, and mortality from cancer in a prospectively studied cohort of U.S. adults. N Engl J Med. 2003;348(17):1625–38. doi: 10.1056/NEJMoa021423. [DOI] [PubMed] [Google Scholar]
- 11.Ding C, Cicuttini F, Jones G. How important is MRI for detecting early osteoarthritis? Nat Clin Pract Rheumatol. 2008;4(1):4–5. doi: 10.1038/ncprheum0676. [DOI] [PubMed] [Google Scholar]
- 12.Eckstein F, Cicuttini F, Raynauld JP, Waterton JC, Peterfy C. Magnetic resonance imaging (MRI) of articular cartilage in knee osteoarthritis (OA): morphological assessment. Osteoarthritis Cartilage. 2006;14 (Suppl A):A46–75. doi: 10.1016/j.joca.2006.02.026. [DOI] [PubMed] [Google Scholar]
- 13.Kellgren JH, Lawrence JS. Radiological assessment of osteoarthrosis. Ann Rheum Dis. 1957;16(4):494–502. doi: 10.1136/ard.16.4.494. [DOI] [PMC free article] [PubMed] [Google Scholar]
- 14.Peterfy CG, Schneider E, Nevitt M. The osteoarthritis initiative: report on the design rationale for the magnetic resonance imaging protocol for the knee. Osteoarthritis Cartilage. 2008;16(12):1433–41. doi: 10.1016/j.joca.2008.06.016. [DOI] [PMC free article] [PubMed] [Google Scholar]
- 15.Bellamy N, Buchanan WW, Goldsmith CH, Campbell J, Stitt LW. Validation study of WOMAC: a health status instrument for measuring clinically important patient relevant outcomes to antirheumatic drug therapy in patients with osteoarthritis of the hip or knee. J Rheumatol. 1988;15(12):1833–40. [PubMed] [Google Scholar]
- 16.Peterfy CG, Guermazi A, Zaim S, Tirman PF, Miaux Y, White D, et al. Whole-Organ Magnetic Resonance Imaging Score (WORMS) of the knee in osteoarthritis. Osteoarthritis Cartilage. 2004;12(3):177–90. doi: 10.1016/j.joca.2003.11.003. [DOI] [PubMed] [Google Scholar]
- 17.Stehling C, Liebl H, Krug R, Lane NE, Nevitt MC, Lynch J, et al. Patellar cartilage: T2 values and morphologic abnormalities at 3.0-T MR imaging in relation to physical activity in asymptomatic subjects from the osteoarthritis initiative. Radiology. 2010;254 (2):509–20. doi: 10.1148/radiol.09090596. [DOI] [PMC free article] [PubMed] [Google Scholar]
- 18.Stehling C, Lane NE, Nevitt MC, Lynch J, McCulloch CE, Link TM. Subjects with higher physical activity levels have more severe focal knee lesions diagnosed with 3T MRI: analysis of a non-symptomatic cohort of the osteoarthritis initiative. Osteoarthritis Cartilage. 2010;18(6):776–86. doi: 10.1016/j.joca.2010.02.008. [DOI] [PMC free article] [PubMed] [Google Scholar]
- 19.Fletcher E, Lewis-Fanning E. Chronic rheumatic diseases: statistical study of 1,000 cases of chronic rheumatism. Postgrad Med J. 1945;21:176–85. doi: 10.1136/pgmj.21.235.176. [DOI] [PMC free article] [PubMed] [Google Scholar]
- 20.Felson DT, Zhang Y, Anthony JM, Naimark A, Anderson JJ. Weight loss reduces the risk for symptomatic knee osteoarthritis in women. The Framingham Study. Ann Intern Med. 1992;116 (7):535–9. doi: 10.7326/0003-4819-116-7-535. [DOI] [PubMed] [Google Scholar]
- 21.Felson DT. Weight and osteoarthritis. Am J Clin Nutr. 1996;63(3 Suppl):430S–2S. doi: 10.1093/ajcn/63.3.430. [DOI] [PubMed] [Google Scholar]
- 22.Felson DT, Zhang Y. An update on the epidemiology of knee and hip osteoarthritis with a view to prevention. Arthritis Rheum. 1998;41(8):1343–55. doi: 10.1002/1529-0131(199808)41:8<1343::AID-ART3>3.0.CO;2-9. [DOI] [PubMed] [Google Scholar]
- 23.Cooper C, Snow S, McAlindon TE, Kellingray S, Stuart B, Coggon D, et al. Risk factors for the incidence and progression of radiographic knee osteoarthritis. Arthritis Rheum. 2000;43 (5):995–1000. doi: 10.1002/1529-0131(200005)43:5<995::AID-ANR6>3.0.CO;2-1. [DOI] [PubMed] [Google Scholar]
- 24.Blagojevic M, Jinks C, Jeffery A, Jordan KP. Risk factors for onset of osteoarthritis of the knee in older adults: a systematic review and meta-analysis. Osteoarthritis Cartilage. 2010;18(1):24–33. doi: 10.1016/j.joca.2009.08.010. [DOI] [PubMed] [Google Scholar]
- 25.Englund M, Guermazi A, Gale D, Hunter DJ, Aliabadi P, Clancy M, et al. Incidental meniscal findings on knee MRI in middle-aged and elderly persons. N Engl J Med. 2008;359(11):1108–15. doi: 10.1056/NEJMoa0800777. [DOI] [PMC free article] [PubMed] [Google Scholar]
- 26.Ding C, Martel-Pelletier J, Pelletier JP, Abram F, Raynauld JP, Cicuttini F, et al. Meniscal tear as an osteoarthritis risk factor in a largely non-osteoarthritic cohort: a cross-sectional study. J Rheumatol. 2007;34(4):776–84. [PubMed] [Google Scholar]
- 27.Bhattacharyya T, Gale D, Dewire P, Totterman S, Gale ME, McLaughlin S, et al. The clinical importance of meniscal tears demonstrated by magnetic resonance imaging in osteoarthritis of the knee. J Bone Joint Surg Am. 2003;85-A(1):4–9. doi: 10.2106/00004623-200301000-00002. [DOI] [PubMed] [Google Scholar]
- 28.Zanetti M, Pfirrmann CW, Schmid MR, Romero J, Seifert B, Hodler J. Patients with suspected meniscal tears: prevalence of abnormalities seen on MRI of 100 symptomatic and 100 contralateral asymptomatic knees. AJR Am J Roentgenol. 2003;181(3):635–41. doi: 10.2214/ajr.181.3.1810635. [DOI] [PubMed] [Google Scholar]
- 29.Beattie KA, Boulos P, Pui M, O’Neill J, Inglis D, Webber CE, et al. Abnormalities identified in the knees of asymptomatic volunteers using peripheral magnetic resonance imaging. Osteoarthritis Cartilage. 2005;13(3):181–6. doi: 10.1016/j.joca.2004.11.001. [DOI] [PubMed] [Google Scholar]
- 30.Greis PE, Bardana DD, Holmstrom MC, Burks RT. Meniscal injury: I. basic science and evaluation. J Am Acad Orthop Surg. 2002;10(3):168–76. doi: 10.5435/00124635-200205000-00003. [DOI] [PubMed] [Google Scholar]
- 31.Biswal S, Hastie T, Andriacchi TP, Bergman GA, Dillingham MF, Lang P. Risk factors for progressive cartilage loss in the knee: a longitudinal magnetic resonance imaging study in forty-three patients. Arthritis Rheum. 2002;46(11):2884–92. doi: 10.1002/art.10573. [DOI] [PubMed] [Google Scholar]
- 32.Raynauld JP, Martel-Pelletier J, Berthiaume MJ, Beaudoin G, Choquette D, Haraoui B, et al. Long term evaluation of disease progression through the quantitative magnetic resonance imaging of symptomatic knee osteoarthritis patients: correlation with clinical symptoms and radiographic changes. Arthritis Res Ther. 2006;8(1):R21. doi: 10.1186/ar1875. [DOI] [PMC free article] [PubMed] [Google Scholar]
- 33.Dougados M, Gueguen A, Nguyen M, Thiesce A, Listrat V, Jacob L, et al. Longitudinal radiologic evaluation of osteoarthritis of the knee. J Rheumatol. 1992;19(3):378–84. [PubMed] [Google Scholar]
- 34.Felson DT, Zhang Y, Hannan MT, Naimark A, Weissman BN, Aliabadi P, et al. The incidence and natural history of knee osteoarthritis in the elderly. The Framingham Osteoarthritis Study. Arthritis Rheum. 1995;38(10):1500–5. doi: 10.1002/art.1780381017. [DOI] [PubMed] [Google Scholar]
- 35.Zhang Y, Niu J, Felson DT, Choi HK, Nevitt M, Neogi T. Methodologic challenges in studying risk factors for progression of knee osteoarthritis. Arthritis Care Res (Hoboken) 2010;62 (11):1527–32. doi: 10.1002/acr.20287. [DOI] [PMC free article] [PubMed] [Google Scholar]
- 36.Niu J, Zhang YQ, Torner J, Nevitt M, Lewis CE, Aliabadi P, et al. Is obesity a risk factor for progressive radiographic knee osteoarthritis? Arthritis Rheum. 2009;61(3):329–35. doi: 10.1002/art.24337. [DOI] [PMC free article] [PubMed] [Google Scholar]
- 37.Ding C, Cicuttini F, Jones G. Tibial subchondral bone size and knee cartilage defects: relevance to knee osteoarthritis. Osteoarthritis Cartilage. 2007;15(5):479–86. doi: 10.1016/j.joca.2007.01.003. [DOI] [PubMed] [Google Scholar]