Abstract
Tumor cells, with stem-like properties, are highly aggressive and often display drug resistance. Here, we reveal that integrin αvβ3 serves as a marker of breast, lung, and pancreatic carcinomas with stem-like properties that are highly resistant to receptor tyrosine kinase inhibitors such as erlotinib. This was observed in vitro and in mice bearing patient-derived tumor xenografts or in clinical specimens from lung cancer patients that had progressed on erlotinib. Mechanistically, αvβ3, in the unligated state, recruits KRAS and RalB to the tumor cell plasma membrane, leading to the activation of TBK-1/NFκB. In fact, αvβ3 expression and the resulting KRAS/RalB/NFκB pathway were both necessary and sufficient for tumor initiation, anchorage-independence, self-renewal, and erlotinib resistance. Pharmacological targeting of this pathway with Bortezomib reversed both tumor stemness and erlotinib resistance. These findings not only identify αvβ3 as a marker/driver of carcinoma stemness but they reveal a therapeutic strategy to sensitize such tumors to RTK inhibition.
Introduction
Despite extensive efforts invested in the clinical development of cancer therapies, current treatments can control tumor growth initially but have produced only modest long term efficacy since most of the patients ultimately relapse. Accumulating evidence implicates tumor initiating cells (TIC), also known as cancer stem cells or tumor-propagating cells, as contributors to tumour dormancy, metastasis, and relapse1, 2. TIC represent a subpopulation of highly tumorigenic cancer cells that are capable of anchorage-independence, self-renewal, and multi-lineage differentiation, properties which render these cells particularly resistant to therapy3, 4. Developing effective strategies to identify and target TIC will require a better understanding of the molecular mechanisms that drive TIC function. Although a number of cell surface proteins and adhesion molecules have already been identified as TIC markers for certain tumour types or subtypes5, 6, none have emerged as viable therapeutic targets to reverse tumour progression and drug resistance.
Integrin αvβ3 is a cell surface adhesion molecule that has been well established as a driver of tumor progression7, 8. Not only has expression of αvβ3 been associated with poor outcome and higher incidence of metastasis for a variety of epithelial cancers8, but its expression has also been reported on a subpopulation of breast9–11 and leukemia cancer stem cells12. Although the primary function of integrins is thought to be coordination of cell-matrix communication to influence intracellular signaling cascades8, αvβ3 integrin is capable of triggering anchorage-independent cell survival and tumor metastasis in the absence of ligand binding13. Considering the presence of αvβ3 on some TIC populations and its role in permitting anchorage-independent survival, we reasoned that αvβ3 expression might be a marker of and functional contributor to a tumor stemness program that allows tumor cells to survive the environmental changes encountered during invasion, metastasis, and exposure to cancer therapies.
We report here that αvβ3 is specifically upregulated on the surface of various epithelial tumor cells exposed to receptor tyrosine kinase inhibitors, and αvβ3 expression is associated with enhanced tumor progression and drug resistance compared with tumors lacking αvβ3. In fact, we found that αvβ3 is both necessary and sufficient to reprogram breast, lung, and pancreatic tumor cells toward a stem-like phenotype with specific resistance to receptor tyrosine kinase (RTK) inhibitors. Mechanistically, αvβ3 expressed on the surface of tumor cells initiates a membrane-proximal complex with KRAS and RalB to activate TBK1/NFκB and enhance anchorage-independence, self-renewal, tumor initiation, and RTK inhibitor resistance. Targeting this pathway genetically or pharmacologically not only reverses these stem-like properties but resensitizes such tumors to RTK inhibition.
Results
Integrin β3 expression drives a tumor-initiating cell phenotype and RTKI resistance
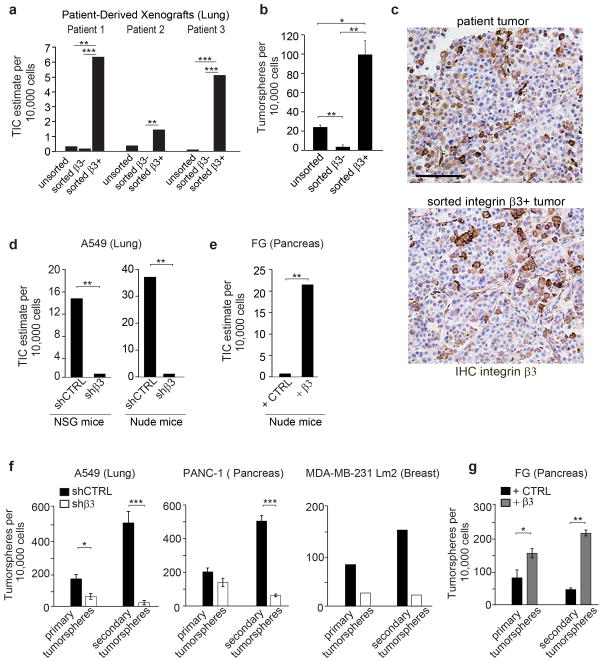
On a wide range of histologically distinct tumors, integrin αvβ3 expression has been linked to increased metastasis13–17. To assess a potential role for αvβ3 in tumor initiation using clinical samples, patient-derived lung and pancreatic xenografts were sorted into β3+ and β3− subpopulations, transplanted into NOD/SCID Il2rγ−/− recipient mice by limiting dilution, and assessed for TIC. The β3+ subpopulation from both tumor types was highly enriched (60-fold) in TICs relative to the β3− population (Fig. 1a and Supplementary Fig. 1a,b). In fact β3+ but not β3− cells were able to form compact tumorspheres (Fig. 1b). Also, β3+ tumors contained both β3+ and β3− cells indicating these cells can recapitulate the heterogeneity of the parental tumor (Fig. 1c). We next assessed whether αvβ3 expression on a panel of carcinoma cell lines can impact properties commonly associated with tumor stem-like cells by both loss and gain of function studies. Compared with their respective β3− counterparts, β3+ lung or pancreas tumors showed a 50-fold higher frequency of TICs when implanted into NSG or nude mice (Fig. 1d,e and Supplementary Fig. 1c–e). These findings were corroborated in vitro among breast, lung and pancreatic cell lines since β3+ cells showed a six-fold increased self-renewal properties (secondary tumorspheres) relative to β3− cells (Fig. 1f,g and Supplementary Fig. 1f).
Figure 1. Integrin β3 expression drives a tumor-initiating cell phenotype.
(a) Frequency of tumor-initiating cells (TIC) in unsorted, integrin β3− and integrin β3+ subpopulations of cells from 3 NSCLC patients-derived xenografts. Cells were tested for tumor initiation in NOD/SCID Il2rγ−/− (NSG) mice. The n number of injection per condition for each patient are shown in Supplementary Figure 1a. The frequency of tumor-initiating cells per 10,000 cells was calculated using the ELDA extreme limiting dilution software. (b) Quantification of tumorspheres formed by the unsorted, the β3− and the β3+ populations from 3 NSCLC patients. n=3 independent experiments (3 technical replicates per experiment); mean ± SD.(c) Histological analysis of patient primary and β3+ subpopulation tumors. Tumors were stained for Integrin β3. Scale bar, 100 μm.(d)Frequency of tumor-initiating cells for A549 cells expressing shCTRL or shβ3 in NSG and nude mice. The n number of injection per condition for A549 shCTRL and A549 shβ3 are shown in Supplementary Figure 1d.(e)Frequency of tumor-initiating cells for FG cells expressing control vector or integrin β3 (FGβ3) in nude mice. The n number of injection per condition for FG and FGβ3 are shown in Supplementary Figure 1e.(f) Self-renewal capacity of A549, PANC-1 and MDA-MB-231 Lm2 cells expressing shCTRL or shβ3 measured by quantifying the number of primary and secondary tumorspheres. n= 3 independent experiments for PANC-1 and A549 (3 technical replicates per experiment). For MDA-MB-231 Lm2, n= 3 technical replicates of a representative experiment. mean ± SD. (g)Self-renewal capacity of FG expressing control vector (+ CTRL) or integrin β3 (+β3), measured by quantifying the number of primary and secondary tumorspheres. n= 3 independent experiments (3 technical replicates per experiment); mean ± SD. P value was estimated by Student’s t-test in b,f,g; χ2 test in a,d,e.*P< 0.05, **P< 0.01, ***P< 0.001. Original data for b,f,g are provided in the Statistical Source data (Supplementary Table 3).
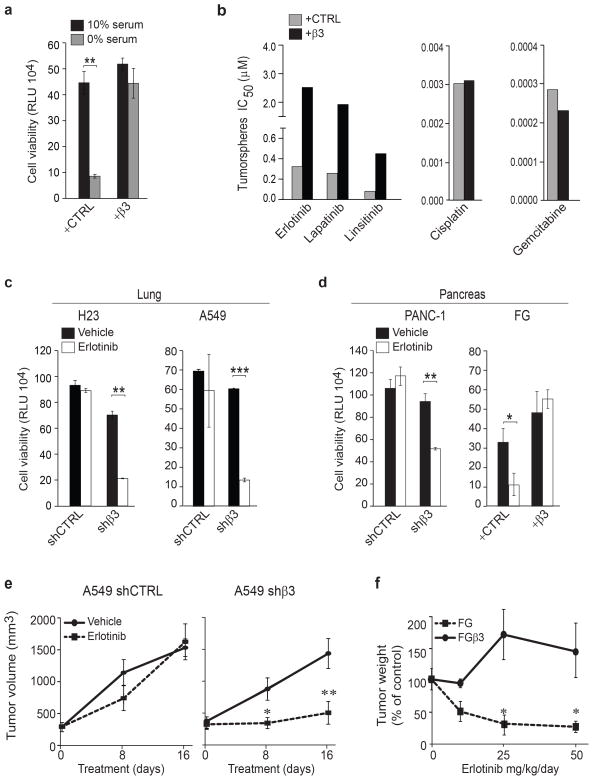
TICs are known to be particularly resistant to cellular stresses, such as nutrient deprivation or exposure to anti-cancer drugs3. Indeed, β3+ cells showed a 4-fold survival advantage compared to their β3− counterparts when subjected to nutrient deprivation (Fig. 2a). Accordingly, we noted that β3 expression conferred resistance to RTK inhibitors such as the EGFR inhibitors erlotinib, and lapatinib as well as the IGF-1R inhibitor linsitinib, yet these cells remained sensitive to chemotherapeutic agents such as gemcitabine and cisplatin (Fig. 2b–d and Supplementary Fig. 2a–c). While previous studies have linked tumor stemness to a general drug resistance phenotype3, 4, our findings reveal a stem-like tumor cell population that appears to be selectively resistant to RTK inhibitors. Importantly, this link between αvβ3 expression and RTK inhibitor resistance was also observed in vivo, as knockdown of integrin β3 sensitized A549 human lung carcinoma xenografts to erlotinib, while ectopic expression of integrin β3 conferred erlotinib resistance of FG human pancreatic carcinomas tumors growing orthotopically in the pancreas (Fig. 2e,f and Supplementary Fig. 2d). We next evaluated a broad panel of breast, pancreas and lung cancer cell lines for their endogenous expression of αvβ3 and assessed their intrinsic sensitivity to erlotinib. All αvβ3-expressing cells tested showed an increased intrinsic resistance to erlotinib (ranging from 3–60 fold) relative to tumors not expressing this receptor independently of EGFR or KRAS mutational status (Supplementary Fig. 2e). Together, these findings indicate that αvβ3 expression is both necessary and sufficient to induce tumor cell stem-like properties, including resistance to RTK inhibition.
Figure 2. Integrin β3 drives RTK inhibitor resistance.
(a)Effect of serum deprivation on FG and FGβ3 cells measured by CellTiterGLO cell viability assay. Cells were grown in 3D in media with media containing 10% serum or 0% serum. Data are expressed in relative Luciferase Units (RLU). n= 3 independent experiments (2 technical replicates per experiment for CTRL and 3 technical replicates for +β3); mean ± SD.(b)Effect of integrin β3 expression (FG and FGβ3) on drug treatment response in pancreatic cancer cells. Cells in 3D culture were treated with a dose response of erlotinib, lapatinib, linsitinib, gemcitabine and cisplatin. IC50 are calculated using Graph Pad prism software. Data are representative of 2 independent experiments.(c–d) Effect of erlotinib treatment on lung (c) and pancreatic (d) cells expressing or lacking integrin β3 measured by CellTiterGLO cell viability assay. Cells were grown in 3D in media with 1μM of erlotinib. Data are expressed in relative Luciferase Units (RLU). n= 3 independent experiments (3 technical replicates per experiment); mean ± SD. (e)Effect of integrin β3 knockdown on erlotinib resistance in vivo, A549 shCTRL and A549 shβ3 (n= 8 mice per treatment group) were treated with erlotinib (25 mg/kg/day) or vehicle during 16 days. Tumor volumes are expressed as mean ± SEM. (f) Orthotopic FG and FGβ3 tumors (>1000 mm3; n= 7 mice for FG and n= 8 mice FGβ3 vehicle and n= 5 mice for each treatment group) were treated for 30 days with vehicle or erlotinib. Results are expressed as % tumor weight compared to vehicle control. mean ± SEM. P value was estimated by Student’s t-test in a,c,d,e,f.*P< 0.05, **P< 0.01, ***P< 0.001. Original data for a,b,c,d are provided in the Statistical Source data (Supplementary Table 3).
Integrin-mediated adhesion/ligation is known to promote tumor cell survival and progression8. Therefore, we considered whether inhibiting the ligand binding properties of αvβ3 could reverse tumor stemness and/or sensitize tumors to RTK inhibitors. Interestingly, integrin antagonists that compete for ligand binding and disrupt cell adhesion had no effect on the ability of αvβ3 to induce tumor cell stemness or resistance to RTK inhibitors (Supplementary Fig. 2f). Furthermore, tumor cells expressing a mutant integrin β3 (D119A) incapable of binding ligand13 showed erlotinib resistance to the same degree as cells expressing WT β3(Supplementary Fig. 2g). Thus, the contribution of αvβ3 to tumor cell stemness and RTK inhibitor resistance appears to involve a non-canonical function for this integrin, independent from its traditional role as a mediator of cell adhesion. Together, these findings indicate that the presence of αvβ3 on histologically distinct carcinomas induces a stem-like, drug resistant phenotype that is independent of its capacity to induce adhesion-mediated signaling.
Acquired resistance to EGFR inhibition selects for a β3+ cell population with tumor-initiating cell properties
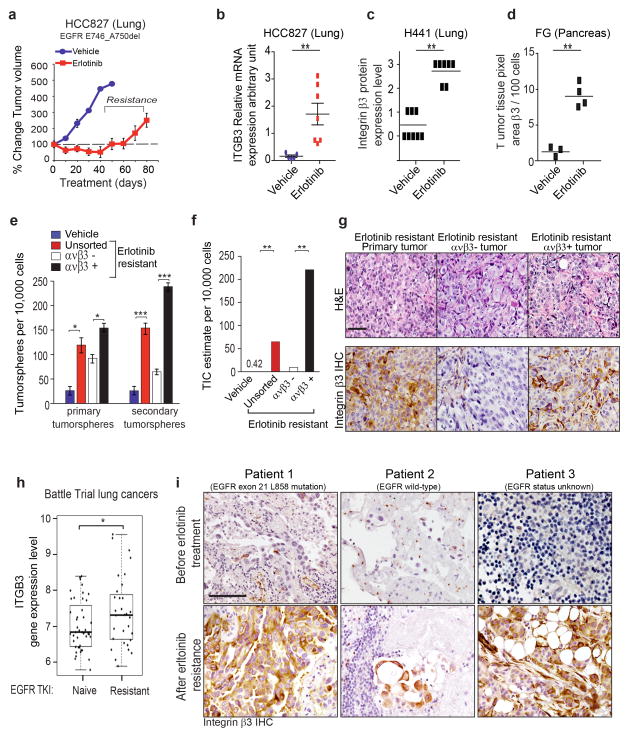
Patients with non-small cell lung cancer (NSCLC) often respond to erlotinib but invariably develop resistance through multiple mechanisms (including EGFR mutations, EGFR gene amplification, and alternate routes of kinase pathway activation18–21). However, accumulating evidence supports the concept that outgrowth of TICs contribute to this process22,23. To explore a possible role for αvβ3 in acquired resistance we examined a lung carcinoma cell line (HCC827 cells) that harbors a clinically relevant deletion of exon 19 of EGFR but that lacks αvβ3 expression. Tumor-bearing mice were systemically treated with erlotinib for 90 days until resistance emerged and monitored for the induction of αvβ3 (Fig. 3a). Once erlotinib resistant was observed tumors expressed a qualitative increase in αvβ3 relative to tumors in vehicle treated mice (Fig. 3b and Supplementary Fig. 3a). Accordingly, αvβ3 expression was also qualitatively increased on two other orthotopic cancer models (H441, lung cancer) and (FG, pancreas cancer) after sustained erlotinib treatment (Fig. 3c,d and Supplementary Fig. 3b,c). Thus, systemic erlotinib treatment of mice bearing human lung and pancreas cancers drives αvβ3 expression that coincides with the acquisition of drug resistance.
Figure 3. Acquired resistance to EGFR inhibition selects for a β3+ cell population with tumor-initiating cell properties.
(a) Effect of erlotinib treatment on HCC827 xenograft tumors. HCC827 cells were treated with vehicle control or erlotinib (25 mg/kg/day) until acquired resistance. Tumor dimensions are reported as the fold change relative to size of the same tumor on Day 1. n= 8 mice per group. Data are mean ± SEM. (b) Relative mRNA expression of integrin β3 (ITGβ3) in HCC827 vehicle-treated tumors (n= 5 tumors) or erlotinib-treated tumors (n= 7 tumors) from (a). Data are mean ± SEM.(c) Quantification of Immunohistochemistry staining of integrin β3 in mouse orthotopic lung H441 tumors treated with vehicle (n= 8 tumors) or erlotinib (n= 7 tumors) was scored (scale 0 to 3).(d) Quantification of integrin αvβ3 expression in pancreatic human FG xenografts treated 4 weeks with vehicle (n=3 tumors) or erlotinib (n=4 tumors). Integrin αvβ3 expression was quantified as ratio of integrin αvβ3 pixel area over nuclei pixel area using Metamorph software. Data are mean. (e) Self-renewal capacity of HCC827 vehicle-treated (vehicle) and erlotinib-treated tumors (erlotinib resistant unsorted) from (a). The HCC827 erlotinib-treated tumors have been sorted in two groups: the integrin β3− and the integrin β3+ population. n= 3 independent experiments (3 technical replicates per experiment); mean ± SD. (f) Frequency of tumor-initiating cells for HCC827 vehicle-treated (vehicle), erlotinib-treated (erlotinib resistant unsorted), erlotinib-treated β3− population and erlotinib-treated β3+ population. The n number of injection per condition for FG and FGβ3 are shown in Supplementary Figure 3e (g) Histological analysis of primary HCC827 erlotinib resistant xenografts and Integrin β3+ and Integrin β3− subpopulations. Tumors were stained for H&E and Integrin β3. Scale bar, 50 μm. (h) Box plot comparing integrin β3 (ITGβ3) gene expression in human lung cancer biopsies from patients from the BATTLE Study24 who were previously treated with an EGFR TKI and progressed (n=31 patients), versus patients who were EGFR TKI naïve (n=43 patients). The box shows the median and the interquartile range. The wiskers show the minimum and maximum. (i) Immunohistochemical analysis of integrin β3 expression in paired human primary lung cancer biopsies obtained before and after erlotinib resistance. Scale bar, 100 μm. P value was estimated by Student’s t-test in b,c,d,e,h; χ2 test in f.*P< 0.05, **P< 0.01. ***P< 0.001. Original data for d,e are provided in the Statistical Source data (Supplementary Table 3).
To assess a possible role for αvβ3 expression as a primary mediator of tumor stemness we prepared single cell suspensions from erlotinib resistant HCC827 tumors, sorted these cells into integrin β3+ and β3− populations, and assessed their tumor initiating abilities in mice and their stem-like properties in vitro. The β3+ sorted population showed enhanced self-renewal capacities (4-fold) and tumor initiation (100-fold) relative to the β3− population (Fig. 3e,f and Supplementary Fig. 3d,e) and completely accounted for the stem-like properties among the drug resistant population. Supporting this notion, the β3+ population was able to reconstitute the heterogeneity of the primary tumor revealing the presence of both β3+ and β3− cells (Fig 3g). Furthermore, these erlotinib resistant lung tumors (HCC827) showed a 16-fold increase in the stem marker ALDH-1 (Supplementary Fig. 3f) whereas knockdown of endogenous β3 in A549 lung carcinoma cells resulted in a significant decrease in ALDH-1 expression (Supplementary Fig. 3g). These findings were validated in patient biopsies, as integrin β3 gene (ITGβ3) expression was significantly upregulated on a cohort of lung cancer patients in the BATTLE trial24 that had progressed on erlotinib relative to patients who had not been treated with this drug (Fig. 3h). Moreover, αvβ3 expression as detected by immunostaining was not expressed on primary lung tumor biopsies prior to treatment but was highly upregulated on these same primary tumors after progression on erlotinib (Fig. 3i). Together, these findings reveal that erlotinib-resistant tumors show enriched αvβ3 expression, which appears to be necessary and sufficient to account for both tumor stemness and erlotinib resistance.
Integrin β3/KRAS complex is critical for a tumor-initiating phenotype and EGFR inhibitor resistance
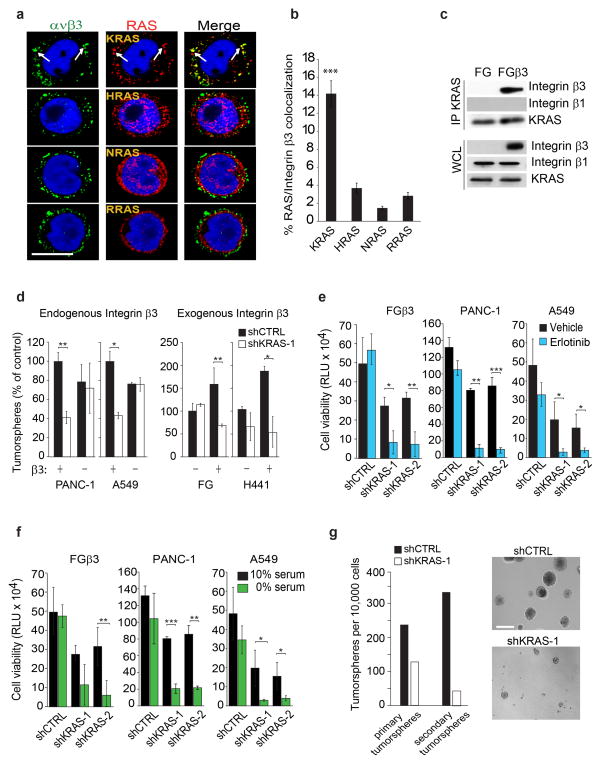
Mechanistically, integrins are known to transmit signals in the context of one or more RAS family members25. Thus, we analyzed tumor cells growing in 3D for a possible co-localization between αvβ3 and one or more RAS family members. Integrin αvβ3 co-localized specifically with KRAS in membrane clusters and was not co-localized with NRAS, RRAS, or HRAS in these cells (Fig. 4a,b and Supplementary Fig. 4a–c). Accordingly, KRAS could be specifically co-immunoprecipitated with αvβ3 but not with β1 integrins (Fig. 4c). Importantly, we observed that KRAS knockdown abolished αvβ3-mediated anchorage-independence, nutrient deprivation and erlotinib resistance as well as self-renewal, but did not impact these properties in cells lacking αvβ3 (Fig. 4d–g and Supplementary Fig. 4d–f), indicating that β3 and KRAS likely cooperate to drive both stemness and drug resistance of these cells. There are two isoforms of KRAS (KRAS-2A and -2B) and only KRAS-2B was associated with αvβ3 (Supplementary Fig. 4g). Interestingly, KRAS-2B is the only RAS isoform containing a poly-cationic region (poly-lysine) within its hyper-variable region26 which may be linked to its capacity to associate with αvβ3 in these cells. Together, these findings demonstrate that the ability of αvβ3 to drive tumor stemness and RTK resistance is linked to its capacity to associate with the 2B isoform of KRAS.
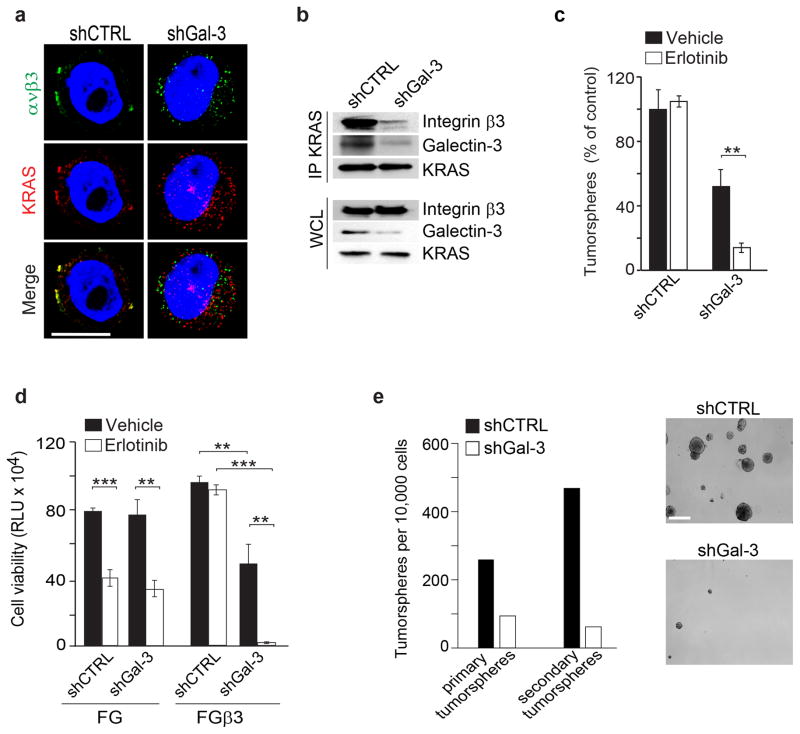
Figure 4. Integrin β3/KRAS complex is critical for integrin β3-mediated tumor-initiating phenotype and EGFR inhibitor resistance.
(a) Confocal microscopy images of FGβ3 cells grown in 3D and stained for integrin αvβ3 (green) and RAS family members (red). Scale bar, 10 μm. Data are representative of three independent experiments. (b)Quantified percentage of cells with colocalization of Integrin β3 and RAS in (a). Data shown represent mean ± SEM. n= 11 fields for KRAS and RRAS and 10 fields for HRAS and NRAS.(c) Immunoblot analysis of KRAS immunoprecipitates from FG and FGβ3 cells. Data are representative of three independent experiments. (d) Effect of KRAS knockdown on tumorspheres formation in lung and pancreatic cancer cells expressing or lacking integrin β3. n= 3 independent experiments (3 technical replicates per experiment); mean ± SD.(e) Effect of KRAS knockdown on β3-mediated erlotinib resistance measured by CellTiterGLO cell viability assay for FGβ3, PANC-1 and A549. Cells were grown in 3D in media and treated with 1μM of erlotinib. Data are expressed in relative Luciferase Units (RLU). n= 3 independent experiments (2 technical replicates per experiment); mean ± SD. (f) Effect of KRAS knockdown on β3-mediated survival under serum deprivation measured by CellTiterGLO cell viability assay for FGβ3, PANC-1 and A549. Cells were grown in 3D in media containing 10% or 0% serum. Data are expressed in relative Luciferase Units (RLU). n= 3 independent experiments (2 technical replicates per experiment); mean ± SD. (g) Self-renewal capacity of FGβ3 cells expressing non-target shRNA control (shCTRL) or KRAS-specific shRNA (shKRAS) measured by quantifying the number of primary and secondary tumorspheres. n= 3 wells per group. mean ± SD. Data are representative of 2 independent experiments. Phase contrast images of self-renewal tumorspheres of FGβ3 cells expressing non-silencing shRNA CTRL or specific KRAS shRNA. Scale bar, 100 μm. P value was estimated by Student’s t-test in b,d,e,f,g.*P< 0.05, **P< 0.01, ***P< 0.001. Uncropped western-blots are provided in Supplementary Figure 7 and original data for b,d,e,f,g are provided in the Statistical Source data (Supplementary Table 3).
There are no obvious KRAS binding sites on the β3 cytoplasmic tail, making it possible that the KRAS/β3 interaction occurs through an intermediary. In fact, Galectin-3, linked to tumor progression27 has been reported in separate studies to interact with KRAS28 or integrin αvβ329. Therefore, we considered if Galectin-3 might serve as an adaptor facilitating the β3/KRAS interaction that could be linked to tumor stemness and RTK resistance. Indeed, knockdown of Galectin-3 in β3+ PANC-1 cells not only prevented the formation of this KRAS/β3 complex (Fig. 5a,b), but also reversed the anchorage-independence, erlotinib resistance and self-renewal induced by αvβ3 (Fig. 5c–e and Supplementary Fig. 4h). Together, these findings provide evidence that Galectin-3 facilitates a specific interaction between αvβ3 and KRAS that appears to be required for the induction of stem-like properties and erlotinib resistance of epithelial cancers.
Figure 5. Galectin-3 is essential for Integrin β3/KRAS complex.
(a) Confocal microscopy images show immunostaining for integrin β3 (green), KRAS (red) and DNA (TOPRO-3, blue) for PANC-1 cells expressing non-target shRNA control (shCTRL) or Galectin-3-specific shRNA (shGal-3) grown in 3D. Scale bar, 10 μm. Data are representative of three independent experiments. (b) Immunoblot analysis of KRAS immunoprecipitates from PANC-1 cells expressing non-target shRNA control (shCTRL) or Galectin-3-specific shRNA (shGal-3). Data are representative of 3 independent experiments.(c) Effect Galectin-3 knockdown on β3-mediated erlotinib resistance in FGβ3 cells. n= 3 independent experiments (3 technical replicates per experiment); mean ± SD.(d) Effect of Galectin-3 knockdown on erlotinib response measured by CellTiterGLO cell viability assay for FG, and FGβ3. Data are expressed in relative Luciferase Units (RLU). Cells were grown in 3D and treated with 1μM of erlotinib. n=3 independent experiments (2 technical replicates per experiment); mean ± SD. (e) Self-renewal capacity of PANC-1 cells expressing non-target shRNA control (shCTRL) or Galectin-3-specific shRNA (shGal-3) measured by quantifying the number of primary and secondary tumorspheres. n=3 wells per group; mean ± SD. Data are representative of 2 independent experiments. Phase contrast images of self-renewal tumorspheres of PANC-1 cells expressing non-silencing shRNA CTRL or Galectin-3 specific shRNA. Scale bar, 100 μm. P value was estimated by Student’s t-test in c,d,e.*P< 0.05, **P< 0.01, **P< 0.01 Uncropped western-blots are provided in Supplementary Figure 7 and original data for c,d,e are provided in the Statistical Source data (Supplementary Table 3).
RalB is a key modulator of integrin β3-mediated tumor-initiating phenotype and EGFR inhibitor resistance
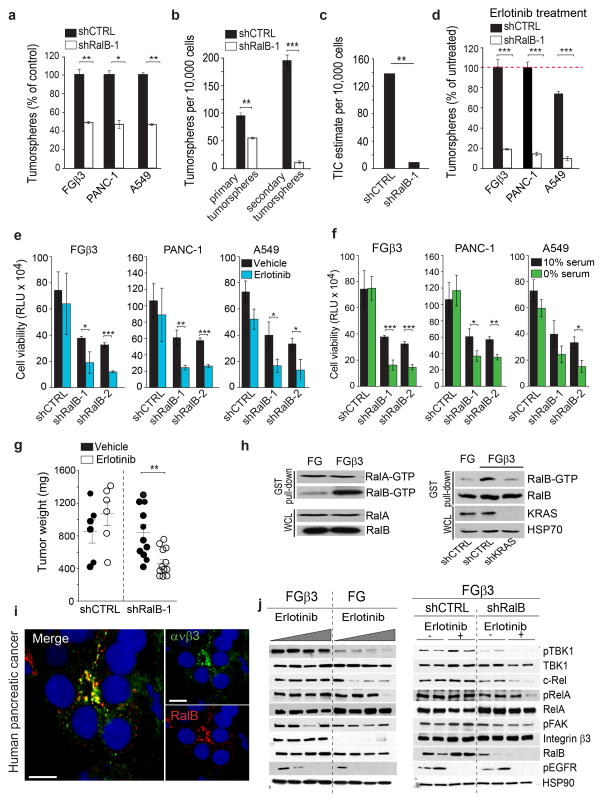
The activation of KRAS elicits changes in cellular function by signaling through a number of downstream effectors, most prominently AKT/PI3K, RAF/MEK/ERK, and RalGTPases30. Depletion of Akt, Erk, or RalA produced an equivalent inhibition of 3D growth among β3-positive and β3-negative tumor cells (Supplementary Fig. 5a), suggesting these effectors were not specifically involved in the ability of αvβ3 to enhance stemness. In contrast, knockdown of RalB not only selectively impaired 3D colony formation of β3+ cells (Fig. 6a and Supplementary Fig. 5b), but it reversed β3-mediated stemness (Fig. 6b,c and Supplementary Fig. 5b,c), and resistance to nutrient deprivation or erlotinib treatment (Fig. 6d–g and Supplementary Fig. 5d). Importantly, in FG pancreatic tumor cells expressing αvβ3 we observed RalB activation in a manner that depended on KRAS co-expression (Fig. 6h). Clinically, we could detect co-localization between αvβ3 and RalB in biopsies from pancreatic cancer patients (Fig. 6i). In fact, the activation of RalB was sufficient for erlotinib resistance, since expression of a constitutively active RalB G23V mutant in β3− tumor cells conferred erlotinib resistance (Supplementary Fig. 5e).
Figure 6. RalB is a key modulator of integrin β3-mediated tumor-initiating phenotype and EGFR inhibitor resistance.
(a) Effect of RalB knockdown on β3-mediated anchorage independence. n= 3 independent experiments (3 technical replicates per experiment); mean ± SD. (b) Self-renewal capacity of FGβ3 expressing shCTRL or shRalB measured by quantifying the number of primary and secondary tumorspheres. n= 3 independent experiments (3 technical replicates per experiment); mean ± SD. (c) Limiting dilution in vivo determining the frequency of tumor-initiating cells for FGβ3shCTRL and FGβ3 shRalB. The n number of injection per condition for FG and FGβ3 are shown in Supplementary Figure 5c.(d)Effect of RalB knockdown on β3-mediated erlotinib resistance measured by tumorspheres formation. n= 3 independent experiments (3 technical replicates/experiment); mean ± SD.(e–f)Effect of RalB knockdown on β3-mediated erlotinib (e) and nutrient deprivation (f) resistance measured by CellTiterGLO cell viability assay. n= 3 independent experiments (2 technical replicates per experiment); mean ± SD. (g) Effect of RalB knockdown on β3-mediated erlotinib resistance of human pancreatic (FGβ3) orthotopic tumor xenografts. Established tumors expressing shCTRL or shRalB (>1000 mm3) were randomized and treated for 10 days with vehicle or erlotinib (50 mg/kg/day). Results are expressed as tumor weight± SEM. n=6 mice for FGβ3 shCTRL vehicle and erlotinib treated groups and n=11 mice for FGβ3 shRalB vehicle treated, and n=13 mice for FGβ3 shRalB erlotinib treated groups. (h)Left, RalA and RalB activities were determined in cells grown in suspension using a GST-RalBP1-RBD immunoprecipitation assay. Data are representative of three independent experiments. Right, Effect of KRAS knockdown on RalB activity. Data are representative of three independent experiments.(i) Confocal microscopy images of integrin αvβ3 (green), RalB (red) and DNA (TOPRO-3, blue) in tumor biopsies from pancreatic cancer patients. Scale bar, 10 μm.(j) Left, Immunoblots showing expression of indicated proteins in representative FG and FGβ3 tumor xenografts from Figure 2f analyzed at treatment day 30. Right, Immunoblots showing expression of indicated proteins in representative FGβ3 shCTRL and FGβ3 shRalB tumor xenografts from (i) analyzed at treatment day 10. P value was estimated by Student’s t-test in a,b,d,e,f,g; χ2 test in c.*P< 0.05, **P< 0.01, ***P< 0.001. Uncropped western-blots are provided in Supplementary Figure 7 and original data for a,b,d,e,f, are provided in the Statistical Source data (Supplementary Table 3).
Consistent with recent studies that have linked RalB and its effectors, TBK1 and NFκB, to RTKI resistance, cell survival and stemness31–33, β3+ tumor cells showed enhanced activation of these effectors relative to that of β3− tumor cell counterparts. RalB knockdown restored the ability of erlotinib to inhibit NFκB (c-Rel) in β3+ tumor cells (Fig. 6j). Interestingly, this αvβ3–mediated signaling pathway appeared to be independent of integrin ligation as well as FAK activation, and event that is typically associated with canonical integrin signaling (Fig. 6j).
TBK1 and c-Rel inhibition overcome β3-mediated stemness and erlotinib EGFR inhibitor resistance
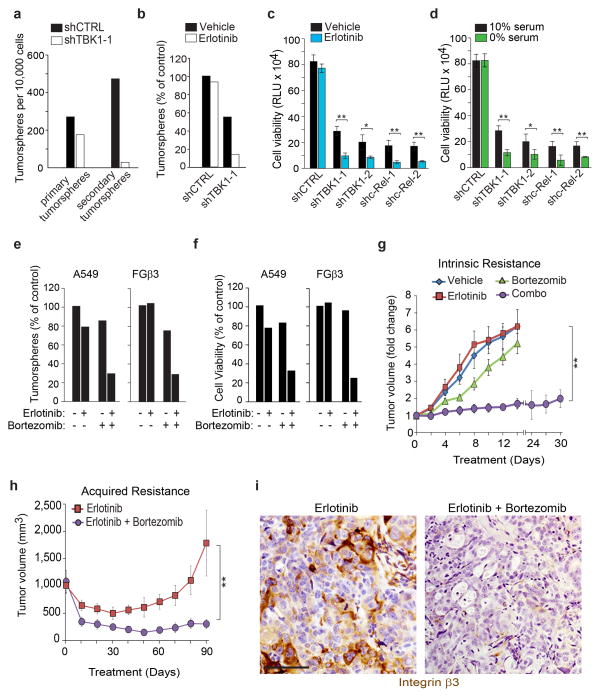
Given this and the fact that RAS and Ral inhibitors have not proven effective clinically, we postulated that interrupting signaling at or downstream of RalB could reverse the stemness and drug resistance of β3+ tumor cells. Indeed, genetic inhibition of TBK1 or c-Rel overcame β3-mediated self-renewal, erlotinib and nutrient deprivation resistance (Fig. 7a–d and Supplementary Fig. 6a–c). In fact, the proteasome inhibitor bortezomib (clinically approved for myeloma) and known to disrupt the NFκB pathway, when combined with erlotinib, overcame β3-mediated intrinsic or acquired erlotinib resistance in vitro and in vivo (Fig. 7e–h and Supplementary Fig. 6d,e). Importantly, tumors treated with a combination of erlotinib and bortezomib showed a complete loss of the β3+ stem population (Fig. 7i).
Figure 7. TBK1 and c-Rel inhibition overcome β3-mediated stemness and EGFR inhibitor resistance.
(a) Effect of TBK1 knockdown on PANC-1 self-renewal capacity. n=3 wells per group; mean ± SD. Data are representative of 2 independent experiments. (b) Effect of TBK1 knockdown on erlotinib resistance in FGβ3 measured by tumorspheres formation. n=3 wells per group; mean ± SD. Data are representative of 2 independent experiments.(c–d)Effect of TBK1 and c-Rel knockdown on (c)β3-mediated erlotinib resistance and (d) β3-mediated serum deprivation survival measured by CellTiterGLO cell viability assay for FGβ3 cells. Cells were grown in 3D in and treated with 1 μM of erlotinib (c) or with 0% serum (d). Data are expressed in relative Luciferase Units (RLU). n= 3 independent experiments (2 technical replicates/experiment); mean ± SD.(e–f) Effect of bortezomib treatment on erlotinib resistance measured by (e) tumorspheres formation and (f) CellTiterGLO cell viability assay for FGβ3 cells. Cells were grown in 3D in and treated with 0.5/1μM of erlotinib and 4/20 nM of bortezomib. Data are expressed in relative Luciferase Units (RLU). n=3 wells per group; mean ± SD Data are representative of 2 independent experiments.(g)Mice bearing subcutaneous β3-positive tumors (FGβ3) were treated with vehicle, erlotinib (25 mg/kg/day) or bortezomib (0.25 mg/kg) alone or in combination. Tumor dimensions are reported as the fold change relative to size of the same tumor on Day 1. mean ± SEM. n= 8 mice for vehicle treated, bortezomib treated and erlotinib treated group and n=13 mice for combo treated group. (h) Mice bearing subcutaneous β3-negative HCC827 tumors were treated with erlotinib (25 mg/kg/day) or erlotinib (25mg/kg/day) and bortezomib (0.25 mg/kg) until erlotinib resistance. Tumor volumes are reported. Mean ± SEM. n= 10 mice per group. (i) Immunohistochemical analysis of integrin β3 expression in HCC827 tumors treated 90 days with erlotinib or erlotinib and bortezomib from (h). Scale bar, 50 μm. P value was estimated by Student’s t-test in a,b,c,d,e,f; one way ANOVA test in g,h.*P< 0.05, **P< 0.01. The original data for a,b,c,d,e,f are provided in the Statistical Source data (Supplementary Table 3).
Schematic model depicting the role of αvβ3 in carcinoma stemness and drug resistance
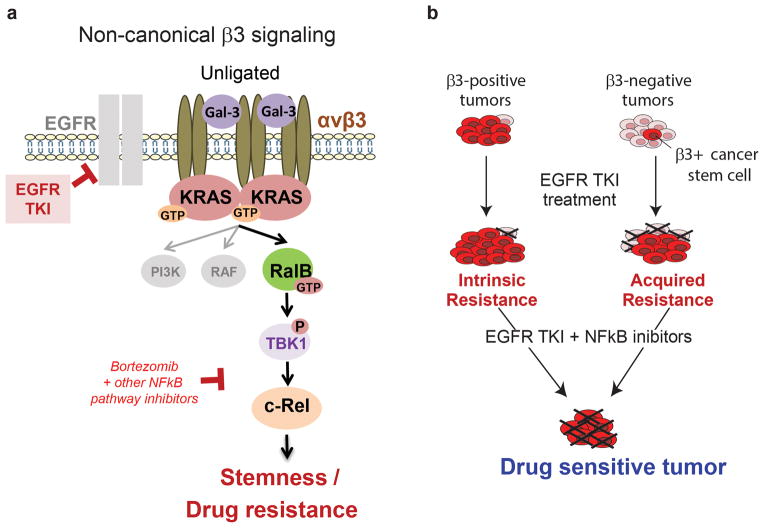
We have identified Integrin αvβ3 as a marker of breast, pancreatic and lung carcinomas that are resistance to RTK inhibitors such as erlotinib or lapatinib. A model of how αvβ3 drives carcinoma stemness and drug resistance is depicted in Fig 8a. Integrin αvβ3, in the unligated state, together with Galectin-3 recruits KRAS into a membrane complex leading to the hyper-activation of RalB. This complex then leads to TBK-1/NFκB activation as previously described34. We demonstrate that drugs such as bortezomib that target this pathway are able to reverse RTK inhibitor resistance and tumor stemness (Fig 8b). Interestingly, targeting the ligand binding properties of αvβ3 do not influence this pathway, as this pathway is only assembled when αvβ3 is in the unligated state.
Figure 8. Model Depicting the Proposed Integrin αvβ3-mediated EGFR TKI resistance mechanism.
(a–b) During EGFR TKI treatment, a β3-positive cancer stem cell population is selected. Integrin β3 interacts with KRAS via Galectin-3 to promote RalB activation. RalB subsequently activates TBK1 resulting in the activation of the NFkB pathway and thereby promoting cell survival. Importantly, ligation of integrin is not required for this signaling cascade. As demonstrated the inhibition of this non-canonical pathway sensitizes β3-positive tumor cells to EGFR TKI. Targeting this pathway genetically or pharmacologically was able to reverse cancer stemness and drug resistance.
Discussion
Tumor initiating cells display stem-like properties and are associated with tumor progression, metastasis, and drug resistance11, 35. While a number of markers such as CD166, CD133, or CD44 have been identified as cancer stem cell markers for particular cancer types, these are not consistently expressed between different tumor types, and their cell surface expression does not necessarily correspond to their overall DNA/RNA/protein expression levels36. In fact, their contribution to a stem cell phenotype is unclear. For example, breast cancer tumor initiating cells are characterized by low levels of CD2437, whereas high CD24 expression is linked to tumor initiation in pancreatic38 and lung39 cancers. Although aldehyde dehydrogenase (ALDH1) is a cytoplasmic enzyme that is expressed in cancer stem cells in leukemia, breast, lung, colon, and prostate cancer36, knockdown studies suggest a tumor-suppressive role for this enzyme40. Here, we identify CD61/integrin β3 to be both necessary and sufficient to promote tumor stem properties, including tumor initiation, self-renewal, and resistance to RTK inhibition. Importantly, we have observed this function of integrin β3 for a range of histologically distinct epithelial tumors, including lung, breast, and pancreatic carcinomas.
The role of integrin αvβ3 as a cancer stem cell driver is consistent with previous reports linking αvβ3 expression to tumor progression and metastasis for a wide range of cancers13, 41, since stemness properties would contribute to these endpoints by promoting drug resistance, tumor growth, and ability to invade into foreign microenvironments. In normal tissues, integrin αvβ3 becomes expressed on a variety of cell types undergoing tissue remodeling. It specifically contributes to invasion, survival, and/or proliferation of luminal progenitor cells in the developing mammary gland42, hematopoietic stem cells43, endothelial cells undergoing angiogenesis44, and smooth muscle cells during vascular remodeling45. Therefore, the role of integrin αvβ3 that we have uncovered in cancer stem cells may be reminiscent of a more fundamental role for this integrin during development and tissue remodeling during repair. It is important to point out that blocking the ligand-binding function of αvβ3 using cyclic peptides such as Cilengitide does not impact the ability of this integrin to promote erlotinib resistance (Supplementary Fig. 2f), as we have attributed this behavior to stem-like abilities including anchorage-independent growth that would not be impacted by disrupting cell adhesion. In fact, expression of a ligand binding defective mutant of αvβ3 is still able to dramatically enhance tumor cell anchorage independent growth and drug resistance.
Integrin αvβ3 functions as part of a complex with KRAS, and tumors expressing integrin β3 require KRAS both for their resistance to RTK inhibitors and for self-renewal (Fig 4d,e). Our collective results suggest that this β3/KRAS interaction may be the crucial event required to drive β3-mediated stemness. Formation of this molecular complex appears to be facilitated by Galectin-3, a lectin family protein previously reported to bind to β329 and KRAS28, separately. We propose that the β3/Galectin-3/KRAS complex drives stemness and erlotinib resistance by aggregating αvβ3/KRAS into clusters at the plasma membrane to facilitate the recruitment and hyperactivation of RalB, which is known to drive NFκB (c-Rel) via TBK132, 34. Galectin-3 is a requirement for αvβ3/KRAS clustering, and thus knockdown of Galectin-3 negates the contribution of αvβ3 to stemness and drug resistance (Fig. 5c–e). This highlights the potential of targeting Galectin-3 as a means to disrupt this pathway in tumors.
Given that β3 is both necessary and sufficient to account for stemness and drug resistance, it should be possible to target and inhibit β3 transcription or selectively kill β3-expressing tumor cells as a means to prevent or reverse this phenotype. However, preventing β3 expression will require a better understanding of how this gene becomes induced. Previous studies have established that β3 expression can be induced on tumor cells by a variety of factors that are prevalent in the tumor microenvironment, including hypoxia46 or inflammatory stress47. Targeting upstream transcription factors previously linked to β3 expression such as HOXD348, FOSL149, SP150, or ETS151 might be useful in preventing the conversion of epithelial cancers to a drug-resistant, stem-like fate. Alternatively, antibody conjugate therapy is gaining popularity as a means to direct a cytotoxic agent such as a toxin, radionuclide, small molecule, or enzyme toward a specific cell surface target expressed on tumor cells52. Targeting tumor cells using an antibody specific for αvβ353, 54 may be particularly advantageous since its expression in the adult is low except in remodeling or angiogenic tissues44, and yetis enriched on the population of drug-resistant, stem-like metastatic tumor cells likely to be present in the circulation.
As shown in this report, reversing β3-mediated drug resistance and stemness was achieved by disrupting its downstream signaling pathway. Perhaps the most straightforward approach to disable β3-mediated stemness may be through NFκB, since previous studies have established NFκB as a transcription factor for a range of genes associated with tumor epithelial-to-mesenchymal transition and drug resistance31, 55. We reasoned that inhibitors targeting the NFκB pathway, such as Bortezomib56, might be combined with RTK inhibition to reverse integrin β3-mediated drug resistance. Not only did Bortezomib sensitize αvβ3-expressing tumors to erlotinib, but combining these agents prevented acquired resistance to erlotinib (Fig. 7h) and eradicated the stem-like cells within the tumor. Re-purposing Bortezomib, an already FDA-approved therapy for multiple myeloma, could represent a promising and feasible strategy to sensitize lung and pancreas carcinomas to the effects of erlotinib.
In this study, we define a non-canonical function for αvβ3 as a marker and driver of cancer stemness and drug resistance. Once expressed on the carcinoma cell surface, αvβ3 couples to Galectin-3 and KRAS promoting the recruitment and activation of RalB leading to the induction of TBK1/NFκB activity. Targeting this pathway genetically or pharmacologically was able to reverse cancer stemness and drug resistance (Fig. 8). These findings demonstrate how the expression of a single integrin can reprogram tumor cells toward a stem-like state that enhances tumor progression and therapy resistance.
Supplementary Material
Supplementary Table 1. List of the antibodies used in this study
Supplementary Table 2. List of the siRNA and shRNA used in this study
Acknowledgments
We thank David Shields, Eric Murphy, Lisette Acevedo, Sunil Advani, Miller Huang, Isabelle Tancioni, Breda Walsh, and Alexandre Larange for helpful discussions. We thank Dennis Young for his advice and the technical support with the FACS sorter. We thank the Moores Cancer Center Bio-repository and Haleigh Howard for their help with the patient-derived xenografts. We thank Jacques Camonis for providing RalB constructs. We also thank Cyrus Mirsaidi from Molecular Response LLC for providing the PDXact™ human lung cancer patient-derived xenograft models used in this study. David Cheresh was supported by US National Institutes of Health grants CA45726, CA168692, HL57900, and R37-50286. Andrew Lowy was supported by grant NIH CA155620. Shumei Kato was supported by the National Cancer Institute of the National Institutes of Health under Award Number T32CA121938. Laetitia Seguin was supported by the Association pour la Recherche contre le Cancer ARC and La Fondation Philippe.
Footnotes
AUTHOR CONTRIBUTIONS
L.S. designed and performed experiments, interpreted data, and wrote the paper; S.K., A.F., J.Q., M.Y., M.F.C., K.C.E., performed experiments; S.K. provided the lung biopsies. A.L. provided the pancreatic patient-derived xenografts. T.C. and J.V.H. provided the H441 model T.C., S.M.L., L. D., J. W., I. W., and J.V.H. provided the BATTLE study. S.L., J.S.D., A.M., H.H., and S.A., gave conceptual advices; and S.M.W., and D.A.C. designed experiments, interpreted data, and wrote the paper.
References
- 1.Patel P, Chen EI. Cancer stem cells, tumor dormancy, and metastasis. Front Endocrinol (Lausanne) 2012;3:125. doi: 10.3389/fendo.2012.00125. [DOI] [PMC free article] [PubMed] [Google Scholar]
- 2.Hermann PC, et al. Distinct populations of cancer stem cells determine tumor growth and metastatic activity in human pancreatic cancer. Cell stem cell. 2007;1:313–323. doi: 10.1016/j.stem.2007.06.002. [DOI] [PubMed] [Google Scholar]
- 3.Dean M, Fojo T, Bates S. Tumour stem cells and drug resistance. Nat Rev Cancer. 2005;5:275–284. doi: 10.1038/nrc1590. [DOI] [PubMed] [Google Scholar]
- 4.Singh A, Settleman J. EMT, cancer stem cells and drug resistance: an emerging axis of evil in the war on cancer. Oncogene. 2010;29:4741–4751. doi: 10.1038/onc.2010.215. [DOI] [PMC free article] [PubMed] [Google Scholar]
- 5.Liu S, Wicha MS. Targeting breast cancer stem cells. J Clin Oncol. 2010;28:4006–4012. doi: 10.1200/JCO.2009.27.5388. [DOI] [PMC free article] [PubMed] [Google Scholar]
- 6.Magee JA, Piskounova E, Morrison SJ. Cancer stem cells: impact, heterogeneity, and uncertainty. Cancer Cell. 2012;21:283–296. doi: 10.1016/j.ccr.2012.03.003. [DOI] [PMC free article] [PubMed] [Google Scholar]
- 7.Adhikari AS, Agarwal N, Iwakuma T. Metastatic potential of tumor-initiating cells in solid tumors. Front Biosci. 2011;16:1927–1938. doi: 10.2741/3831. [DOI] [PubMed] [Google Scholar]
- 8.Desgrosellier JS, Cheresh DA. Integrins in cancer: biological implications and therapeutic opportunities. Nat Rev Cancer. 2010;10:9–22. doi: 10.1038/nrc2748. [DOI] [PMC free article] [PubMed] [Google Scholar]
- 9.Lo PK, et al. CD49f and CD61 identify Her2/neu-induced mammary tumor-initiating cells that are potentially derived from luminal progenitors and maintained by the integrin-TGFbeta signaling. Oncogene. 2011 doi: 10.1038/onc.2011.439. [DOI] [PMC free article] [PubMed] [Google Scholar]
- 10.Vaillant F, et al. The mammary progenitor marker CD61/beta3 integrin identifies cancer stem cells in mouse models of mammary tumorigenesis. Cancer Res. 2008;68:7711–7717. doi: 10.1158/0008-5472.CAN-08-1949. [DOI] [PubMed] [Google Scholar]
- 11.Visvader JE, Lindeman GJ. Cancer stem cells in solid tumours: accumulating evidence and unresolved questions. Nat Rev Cancer. 2008;8:755–768. doi: 10.1038/nrc2499. [DOI] [PubMed] [Google Scholar]
- 12.Miller PG, et al. In Vivo RNAi Screening Identifies a Leukemia-Specific Dependence on Integrin Beta 3 Signaling. Cancer Cell. 2013 doi: 10.1016/j.ccr.2013.05.004. [DOI] [PMC free article] [PubMed] [Google Scholar]
- 13.Desgrosellier JS, et al. An integrin alpha(v)beta(3)-c-Src oncogenic unit promotes anchorage-independence and tumor progression. Nat Med. 2009;15:1163–1169. doi: 10.1038/nm.2009. [DOI] [PMC free article] [PubMed] [Google Scholar]
- 14.Pecheur I, et al. Integrin alpha(v)beta3 expression confers on tumor cells a greater propensity to metastasize to bone. Faseb J. 2002;16:1266–1268. doi: 10.1096/fj.01-0911fje. [DOI] [PubMed] [Google Scholar]
- 15.Knowles LM, et al. Integrin alphavbeta3 and fibronectin upregulate Slug in cancer cells to promote clot invasion and metastasis. Cancer Res. 2013;73:6175–6184. doi: 10.1158/0008-5472.CAN-13-0602. [DOI] [PMC free article] [PubMed] [Google Scholar]
- 16.Sloan EK, et al. Tumor-specific expression of alphavbeta3 integrin promotes spontaneous metastasis of breast cancer to bone. Breast Cancer Res. 2006;8:R20. doi: 10.1186/bcr1398. [DOI] [PMC free article] [PubMed] [Google Scholar]
- 17.Hieken TJ, et al. Beta3 integrin expression in melanoma predicts subsequent metastasis. The Journal of surgical research. 1996;63:169–173. doi: 10.1006/jsre.1996.0242. [DOI] [PubMed] [Google Scholar]
- 18.Workman P, Clarke PA. Resisting targeted therapy: fifty ways to leave your EGFR. Cancer Cell. 2011;19:437–440. doi: 10.1016/j.ccr.2011.03.020. [DOI] [PubMed] [Google Scholar]
- 19.Ciardiello F, Tortora G. EGFR antagonists in cancer treatment. The New England journal of medicine. 2008;358:1160–1174. doi: 10.1056/NEJMra0707704. [DOI] [PubMed] [Google Scholar]
- 20.Wheeler DL, Dunn EF, Harari PM. Understanding resistance to EGFR inhibitors-impact on future treatment strategies. Nat Rev Clin Oncol. 2010;7:493–507. doi: 10.1038/nrclinonc.2010.97. [DOI] [PMC free article] [PubMed] [Google Scholar]
- 21.Engelman JA, Janne PA. Mechanisms of acquired resistance to epidermal growth factor receptor tyrosine kinase inhibitors in non-small cell lung cancer. Clin Cancer Res. 2008;14:2895–2899. doi: 10.1158/1078-0432.CCR-07-2248. [DOI] [PubMed] [Google Scholar]
- 22.Shien K, et al. Acquired Resistance to EGFR Inhibitors Is Associated with a Manifestation of Stem Cell–like Properties in Cancer Cells. Cancer Research. 2013;73:3051–3061. doi: 10.1158/0008-5472.CAN-12-4136. [DOI] [PMC free article] [PubMed] [Google Scholar]
- 23.Sharma SV, et al. A Chromatin-Mediated Reversible Drug-Tolerant State in Cancer Cell Subpopulations. Cell. 2010;141:69–80. doi: 10.1016/j.cell.2010.02.027. [DOI] [PMC free article] [PubMed] [Google Scholar]
- 24.Kim ES, et al. The BATTLE Trial: Personalizing Therapy for Lung Cancer. Cancer discovery. 2012;1:44–53. doi: 10.1158/2159-8274.CD-10-0010. [DOI] [PMC free article] [PubMed] [Google Scholar]
- 25.Martin KH, Slack JK, Boerner SA, Martin CC, Parsons JT. Integrin Connections Map: To Infinity and Beyond. Science. 2002;296:1652–1653. doi: 10.1126/science.296.5573.1652. [DOI] [PubMed] [Google Scholar]
- 26.Prior IA, Hancock JF. Ras trafficking, localization and compartmentalized signalling. Seminars in cell & developmental biology. 2012;23:145–153. doi: 10.1016/j.semcdb.2011.09.002. [DOI] [PMC free article] [PubMed] [Google Scholar]
- 27.Newlaczyl AU, Yu LG. Galectin-3--a jack-of-all-trades in cancer. Cancer Lett. 2011;313:123–128. doi: 10.1016/j.canlet.2011.09.003. [DOI] [PubMed] [Google Scholar]
- 28.Shalom-Feuerstein R, et al. K-ras nanoclustering is subverted by overexpression of the scaffold protein galectin-3. Cancer research. 2008;68:6608–6616. doi: 10.1158/0008-5472.CAN-08-1117. [DOI] [PMC free article] [PubMed] [Google Scholar]
- 29.Markowska AI, Liu FT, Panjwani N. Galectin-3 is an important mediator of VEGF- and bFGF-mediated angiogenic response. The Journal of experimental medicine. 2010;207:1981–1993. doi: 10.1084/jem.20090121. [DOI] [PMC free article] [PubMed] [Google Scholar]
- 30.Pylayeva-Gupta Y, Grabocka E, Bar-Sagi D. RAS oncogenes: weaving a tumorigenic web. Nat Rev Cancer. 2011;11:761–774. doi: 10.1038/nrc3106. [DOI] [PMC free article] [PubMed] [Google Scholar]
- 31.Bivona TG, et al. FAS and NF-kappaB signalling modulate dependence of lung cancers on mutant EGFR. Nature. 2011;471:523–526. doi: 10.1038/nature09870. [DOI] [PMC free article] [PubMed] [Google Scholar]
- 32.Chien Y, et al. RalB GTPase-mediated activation of the IkappaB family kinase TBK1 couples innate immune signaling to tumor cell survival. Cell. 2006;127:157–170. doi: 10.1016/j.cell.2006.08.034. [DOI] [PubMed] [Google Scholar]
- 33.Rajasekhar VK, Studer L, Gerald W, Socci ND, Scher HI. Tumour-initiating stem-like cells in human prostate cancer exhibit increased NF-kappaB signalling. Nature communications. 2011;2:162. doi: 10.1038/ncomms1159. [DOI] [PMC free article] [PubMed] [Google Scholar]
- 34.Barbie DA, et al. Systematic RNA interference reveals that oncogenic KRAS-driven cancers require TBK1. Nature. 2009;462:108–112. doi: 10.1038/nature08460. [DOI] [PMC free article] [PubMed] [Google Scholar]
- 35.Vermeulen L, de Sousa e Melo F, Richel DJ, Medema JP. The developing cancer stem-cell model: clinical challenges and opportunities. The lancet oncology. 2012;13:e83–89. doi: 10.1016/S1470-2045(11)70257-1. [DOI] [PubMed] [Google Scholar]
- 36.Medema JP. Cancer stem cells: the challenges ahead. Nature cell biology. 2013;15:338–344. doi: 10.1038/ncb2717. [DOI] [PubMed] [Google Scholar]
- 37.Li X, et al. Intrinsic resistance of tumorigenic breast cancer cells to chemotherapy. Journal of the National Cancer Institute. 2008;100:672–679. doi: 10.1093/jnci/djn123. [DOI] [PubMed] [Google Scholar]
- 38.Xu L. Cancer stem cell in the progression and therapy of pancreatic cancer. Frontiers in bioscience (Landmark edition) 2013;18:795–802. doi: 10.2741/4143. [DOI] [PubMed] [Google Scholar]
- 39.Zheng Y, et al. A rare population of CD24(+)ITGB4(+)Notch(hi) cells drives tumor propagation in NSCLC and requires Notch3 for self-renewal. Cancer Cell. 2013;24:59–74. doi: 10.1016/j.ccr.2013.05.021. [DOI] [PMC free article] [PubMed] [Google Scholar]
- 40.Ginestier C, et al. Retinoid signaling regulates breast cancer stem cell differentiation. Cell cycle. 2009;8:3297–3302. doi: 10.4161/cc.8.20.9761. [DOI] [PMC free article] [PubMed] [Google Scholar]
- 41.Takayama S, et al. The relationship between bone metastasis from human breast cancer and integrin alpha(v)beta3 expression. Anticancer Res. 2005;25:79–83. [PubMed] [Google Scholar]
- 42.Asselin-Labat ML, et al. Gata-3 is an essential regulator of mammary-gland morphogenesis and luminal-cell differentiation. Nature cell biology. 2007;9:201–209. doi: 10.1038/ncb1530. [DOI] [PubMed] [Google Scholar]
- 43.Umemoto T, et al. CD61 enriches long-term repopulating hematopoietic stem cells. Biochemical and biophysical research communications. 2008;365:176–182. doi: 10.1016/j.bbrc.2007.10.168. [DOI] [PubMed] [Google Scholar]
- 44.Brooks PC, Clark RA, Cheresh DA. Requirement of vascular integrin alpha v beta 3 for angiogenesis. Science. 1994;264:569–571. doi: 10.1126/science.7512751. [DOI] [PubMed] [Google Scholar]
- 45.Scheppke L, et al. Notch promotes vascular maturation by inducing integrin-mediated smooth muscle cell adhesion to the endothelial basement membrane. Blood. 2012;119:2149–2158. doi: 10.1182/blood-2011-04-348706. [DOI] [PMC free article] [PubMed] [Google Scholar]
- 46.Cowden Dahl KD, Robertson SE, Weaver VM, Simon MC. Hypoxia-inducible factor regulates alphavbeta3 integrin cell surface expression. Molecular biology of the cell. 2005;16:1901–1912. doi: 10.1091/mbc.E04-12-1082. [DOI] [PMC free article] [PubMed] [Google Scholar]
- 47.Jinushi M, et al. ATM-Mediated DNA Damage Signals Mediate Immune Escape through Integrin-alphavbeta3-Dependent Mechanisms. Cancer research. 2012;72:56–65. doi: 10.1158/0008-5472.CAN-11-2028. [DOI] [PubMed] [Google Scholar]
- 48.Hamada J-i, et al. Overexpression of homeobox gene HOXD3 induces coordinate expression of metastasis-related genes in human lung cancer cells. International Journal of Cancer. 2001;93:516–525. doi: 10.1002/ijc.1357. [DOI] [PubMed] [Google Scholar]
- 49.Evellin S, et al. FOSL1 controls the assembly of endothelial cells into capillary tubes by direct repression of alphav and beta3 integrin transcription. Molecular and cellular biology. 2013;33:1198–1209. doi: 10.1128/MCB.01054-12. [DOI] [PMC free article] [PubMed] [Google Scholar]
- 50.Jin Y, et al. Human integrin beta3 gene expression: evidence for a megakaryocytic cell-specific cis-acting element. Blood. 1998;92:2777–2790. [PubMed] [Google Scholar]
- 51.Rothhammer T, et al. The Ets-1 transcription factor is involved in the development and invasion of malignant melanoma. Cellular and molecular life sciences: CMLS. 2004;61:118–128. doi: 10.1007/s00018-003-3337-8. [DOI] [PMC free article] [PubMed] [Google Scholar]
- 52.Teicher BA, Chari RV. Antibody conjugate therapeutics: challenges and potential. Clin Cancer Res. 2011;17:6389–6397. doi: 10.1158/1078-0432.CCR-11-1417. [DOI] [PubMed] [Google Scholar]
- 53.Cheresh DA. Human endothelial cells synthesize and express an Arg-Gly-Asp-directed adhesion receptor involved in attachment to fibrinogen and von Willebrand factor. Proc Natl Acad Sci U S A. 1987;84:6471–6475. doi: 10.1073/pnas.84.18.6471. [DOI] [PMC free article] [PubMed] [Google Scholar]
- 54.Brooks PC, et al. Anti-integrin alpha v beta 3 blocks human breast cancer growth and angiogenesis in human skin. J Clin Invest. 1995;96:1815–1822. doi: 10.1172/JCI118227. [DOI] [PMC free article] [PubMed] [Google Scholar]
- 55.Bhat KP, et al. Mesenchymal Differentiation Mediated by NF-kappaB Promotes Radiation Resistance in Glioblastoma. Cancer Cell. 2013 doi: 10.1016/j.ccr.2013.08.001. [DOI] [PMC free article] [PubMed] [Google Scholar]
- 56.Kumar MS, et al. The GATA2 transcriptional network is requisite for RAS oncogene-driven non-small cell lung cancer. Cell. 2012;149:642–655. doi: 10.1016/j.cell.2012.02.059. [DOI] [PubMed] [Google Scholar]
Associated Data
This section collects any data citations, data availability statements, or supplementary materials included in this article.
Supplementary Materials
Supplementary Table 1. List of the antibodies used in this study
Supplementary Table 2. List of the siRNA and shRNA used in this study


