

Abstract
Objective:
To investigate the potential relationship between insulin resistance (IR) and white matter (WM) microstructure using diffusion tensor imaging in cognitively healthy middle-aged and older adults.
Methods:
Diffusion tensor imaging was acquired from 127 individuals (age range 41–86 years). IR was evaluated by the homeostasis model assessment of IR (HOMA-IR). Participants were divided into 2 groups based on HOMA-IR values: “high HOMA-IR” (≥2.5, n = 27) and “low HOMA-IR” (<2.5, n = 100). Cross-sectional voxel-based comparisons were performed using Tract-Based Spatial Statistics and anatomically defined regions of interest analysis.
Results:
The high HOMA-IR group demonstrated decreased axial diffusivity broadly throughout the cerebral WM in areas such as the corpus callosum, corona radiata, cerebral peduncle, posterior thalamic radiation, and right superior longitudinal fasciculus, and WM underlying the frontal, parietal, and temporal lobes, as well as decreased fractional anisotropy in the body and genu of corpus callosum and parts of the superior and anterior corona radiata, compared with the low HOMA-IR group, independent of age, WM signal abnormality volume, and antihypertensive medication status. These regions additionally demonstrated linear associations between diffusion measures and HOMA-IR across all subjects, with higher HOMA-IR values being correlated with lower axial diffusivity.
Conclusions:
In generally healthy adults, greater IR is associated with alterations in WM tissue integrity. These cross-sectional findings suggest that IR contributes to WM microstructural alterations in middle-aged and older adults.
Insulin resistance (IR), a central feature of type 2 diabetes mellitus (T2DM), is frequently observed in older adults of the general population.1 Emerging evidence suggests that insulin and insulin signaling may be involved in the pathophysiology of Alzheimer disease (AD).2–4 For example, it has been reported that IR affects accumulation of β-amyloid peptide by inhibiting its degradation via insulin-degrading enzyme and promotes tau hyperphosphorylation through an augmentation of glycogen synthase kinase-3β activity.2,5,6 Neuroimaging studies about the influence of IR on brain in cognitively normal adults have demonstrated that higher IR or insulin levels are associated with regional changes in brain areas affected by early AD, suggesting a role for IR as an important risk factor for AD.7–10 However, little is known about the relationship between IR and white matter (WM) integrity.
Diffusion tensor imaging (DTI) allows in vivo assessment of WM tissue microstructure by measuring diffusion properties of water in tissue.11 The DTI studies have revealed WM alterations in a variety of conditions, such as aging, mild cognitive impairment, and AD.12–14 Recent DTI studies in T2DM have shown microstructural WM abnormalities in several brain regions.15,16 However, no prior studies have specifically examined how IR may influence WM microstructure, particularly in generally healthy adults. The overall aim of this study was to evaluate the relationship between IR and WM integrity in cognitively healthy middle-aged and older adults using DTI. We hypothesized that greater IR would be associated with regional alterations of WM integrity.
METHODS
Participants.
A sample of 170 cognitively healthy middle-aged and older adults were recruited through the Massachusetts General Hospital, the local community, and local senior centers; these individuals form part of a longitudinal cohort to evaluate vascular contributions to brain aging. All participants were physically healthy, cognitively intact, and literate with at least a high school education. Participants were excluded if they had major neurologic or psychiatric illnesses, history of stroke, a history of significant head trauma, unstable medical illness, cancer within the nervous system, any history of brain surgery, history of significant substance abuse, or contraindication for MRI scan (e.g., metal in body, pacemakers). Participants with controlled hypertension, dyslipidemia, and/or T2DM were not excluded.
A total of 131 datasets with available IR index were selected from those samples. Four individuals were excluded because of unavailable DTI data (1), insulin therapy (1), or high WM signal abnormality (WMSA) volume (2). The final sample examined included 127 cognitively healthy middle-aged and older adults (54 men/73 women), aged between 41 and 86 years. One hundred fourteen participants (87.60%) were Caucasian, 11 (8.66%) were African American, and 2 were Asian.
Standard protocol approvals, registrations, and patient consents.
The study was approved by the Partners Internal Review Board. All participants provided informed consent.
Clinical assessments.
Assessments included ascertainment of medical history as well as general medical, physical, and neurologic examinations. The Mini-Mental State Examination17 was administered as a measure of global cognitive function.
Overnight fasting blood samples were collected on the day of the MRI session for estimation of glucose, insulin, lipid profiles, and APOE genotype. Serum insulin was measured using electrochemiluminescence immunoassay (Mayo Medical Laboratories, Andover, MA).
IR was evaluated by the homeostasis model assessment of IR (HOMA-IR), which strongly correlates with the euglycemic-hyperinsulinemic clamp method, the gold standard technique determining insulin sensitivity.18 HOMA-IR was calculated as follows: fasting serum insulin level (μU/mL) × fasting serum glucose level (mg/dL)/405. The participants were divided into 2 groups based on the value of HOMA-IR. We defined the values ≥2.5 as an insulin-resistant state (“high HOMA-IR” group; n = 27) and the values <2.5 as an insulin-sensitive state (“low HOMA-IR” group; n = 100) according to the threshold value for IR used in a previous study.19 The threshold value for IR in our study was close to the cutoff of 2.59 derived from a mixture model20 of 2 Gaussian distributions on HOMA-IR values of the sample.
DTI acquisition.
MRI studies were performed on a 3-tesla scanner (Siemens Trio, Erlangen, Germany) using a 12-channel phased-array head coil for reception and body-coil for transmission. The diffusion-weighted images were obtained using single-shot echo planar imaging with a twice-refocused spin-echo sequence21: 64 slices, repetition time/echo time = 7,980/83 milliseconds, 2-mm isotropic voxels (2-mm slice thickness with 0-mm gap), 60 directions at b = 700 s/mm2 with 10 volumes at b value = 0 s/mm2, acquisition matrix = 128 × 128, field of view = 256 × 256 mm, flip angle = 90°, and total acquisition time = 8 minutes, 38 seconds.
DTI preprocessing and Tract-Based Spatial Statistics analysis.
Diffusion MRI data were preprocessed using the FMRIB's Diffusion Toolbox, which is a part of the FMRIB's Software Library (FSL) program (http://www.fmrib.ox.ac.uk/fsl, Oxford Centre for Functional MRI of the Brain, Oxford University, UK) (version 4.1.9). The raw DTIs were corrected for eddy currents and head motion by using affine registration to the non–diffusion weighted volumes (b = 0). The diffusion tensor was calculated by fitting a diffusion tensor model to the preprocessed DTI data, using the DTIfit program included in FSL. The resulting fractional anisotropy (FA), axial diffusivity (DA), and radial diffusivity (DR) were used in voxel-based analyses.
Voxelwise statistical analysis was performed using the Tract-Based Spatial Statistics (TBSS) procedure (version 1.2),22 part of FSL.23 TBSS projects all subjects' FA data onto a mean FA tract skeleton, before applying voxelwise cross-subjects statistics. The transformations derived for the FA maps were applied to DA/DR for matched processing of all image volumes.
Atlas-based region of interest analysis.
Regions of interest (ROIs) limited to the TBSS skeleton were created using a combination of The Johns Hopkins University WM atlas, available as part of the FSL suite, and the subgyral WM and additional structures created during the T1-based FreeSurfer WM parcellation procedure.24 The ROI-segmented skeleton was then deprojected from TBSS standard space to each participant's native diffusion volume. Mean values for selected ROI segmentations were then extracted from each participant's native space image.
WMSA volume.
Segmentation of WM lesions was performed using the FreeSurfer T1-based whole-brain segmentation, which is documented and freely available online (http://surfer.nmr.mgh.harvard.edu/).25,26 Total WMSA (i.e., T1 hypointensities within the WM) volume was calculated to examine the impact on the DTI metrics. WMSA from T1 images has been shown to be correlated with hyperintensity volumes from T2/fluid-attenuated inversion recovery images measured by manual and semimanual measurements.27
Statistical analysis.
Two-sample t tests were used for comparisons of continuous variables between high and low HOMA-IR groups, while categorical variables were compared using the Pearson χ2 tests. Statistical analyses were performed using JMP pro 10.0.0 (SAS Inc., Cary, NC).
Voxel-based DTI analyses were performed using the FSL randomise program.28 We examined differences in diffusion measures (FA, DA, DR) between the high and low HOMA-IR groups and tested the combined groups for associations between HOMA-IR and FA, DA, and DR with general linear models while statistically controlling for the effects of age, WMSA volume, and antihypertensive medication status. We also controlled for antihypertensive medication status as well as WMSA volume because of the differences of antihypertensive treatment between the high and low HOMA-IR groups (table 1). Correction for multiple comparisons was performed using threshold-free cluster enhancement, with 5,000 permutations.29 Corrected statistical maps were thresholded at p < 0.05 and thickened from the TBSS skeleton for visualization purposes. Anatomical assignments of voxels of clusters that survived correction for multiple comparisons were performed using the ROI atlases described above. To further determine the interaction between HOMA-IR and age on diffusion measures, we investigated differences in the associations of HOMA-IR and diffusion measures (controlling for age) by age group (middle-aged [younger than 60 years] vs older adults [60 years or older]).
Table 1.
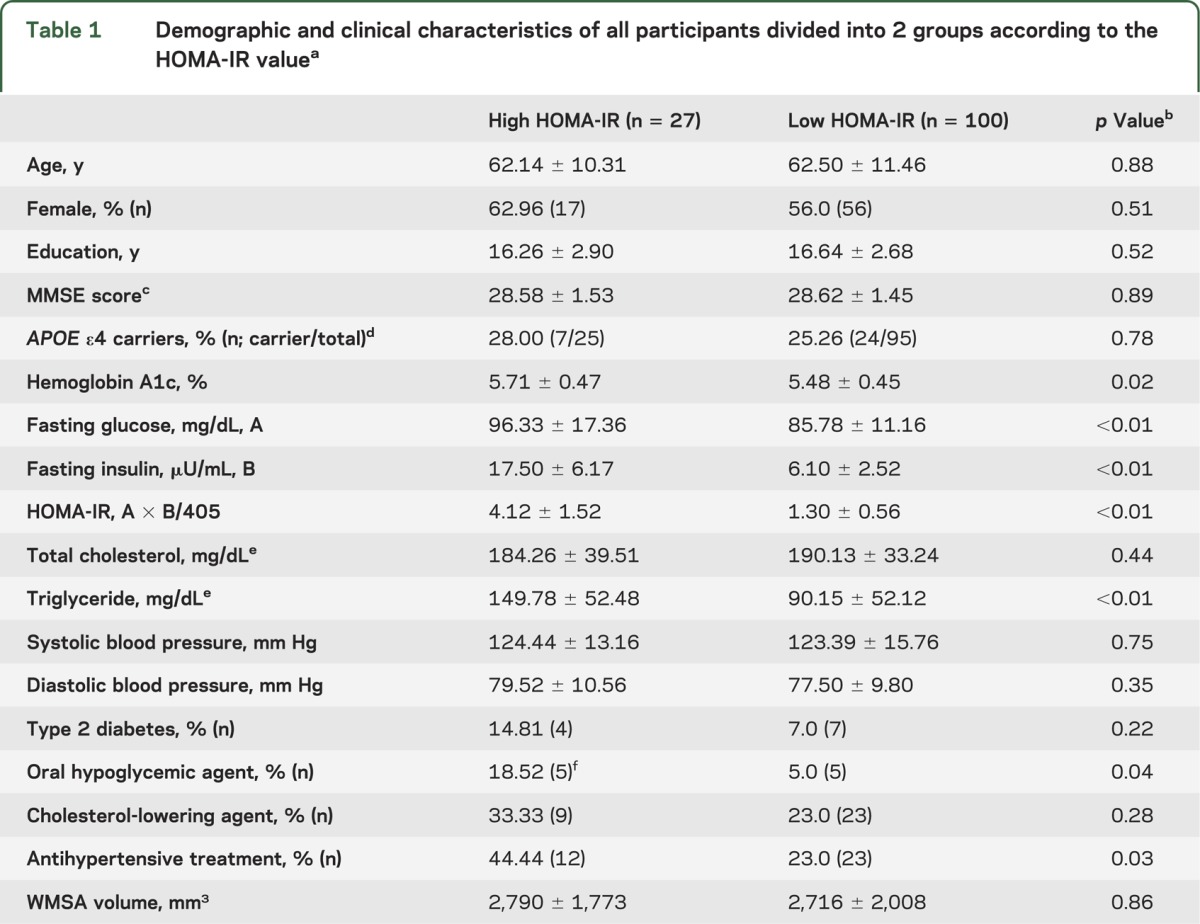
Demographic and clinical characteristics of all participants divided into 2 groups according to the HOMA-IR valuea
Anatomically based ROI DTI analyses were performed using general linear models to examine group differences in WM microstructure measures controlling for age. Correction for multiple comparisons of anatomical ROI data was achieved using the Holm-Bonferroni method.30 The p values for these ROI analyses were set at 0.01 (uncorrected) and 0.05 (corrected).
Scatter plots between mean DA and HOMA-IR values were created for the selected WM skeleton ROIs within the corrected significant clusters resulting from the above TBSS voxelwise analysis of high vs low HOMA-IR group comparisons. Six ROIs (body of corpus callosum [CC], right cerebral peduncle, left rostral middle frontal WM, right pars opercularis WM, right precuneus WM, and right superior temporal WM) were selected depending on the significant cluster sizes and considering the anatomical distribution. Because the distribution of HOMA-IR is skewed, values were log-transformed for analysis. Additional linear regression analyses were conducted between log-transformed HOMA-IR and mean DA in the selected 6 ROIs to examine the effects of APOE ε4 status and triglyceride levels. Value of p < 0.05 was considered significant if not otherwise specified.
RESULTS
Demographic data.
Demographic and sample characteristics of all participants are presented in table 1. There were no differences in age, sex, education, Mini-Mental State Examination score, and APOE ε4 status between the high and low HOMA-IR groups. Triglyceride concentrations were higher in the high HOMA-IR group than in the low HOMA-IR group. As expected, the high HOMA-IR group had greater use of antihypertensive and oral hypoglycemic medications than the low HOMA-IR group.
Comparisons of DTI indices between the high and low HOMA-IR groups.
Voxelwise TBSS analyses.
The high HOMA-IR group had significantly lower FA than the low HOMA-IR group, independent of age, WMSA volume, and antihypertensive medication usage, in the body and genu of CC and parts of the superior and anterior corona radiata (figure 1A).
Figure 1. TBSS maps of the effect of HOMA-IR on DTI parameters in middle-aged and older adults.

(A) Reduced DA (light red) and FA (light blue) in the high HOMA-IR group (n = 27) compared with the low HOMA-IR group (n = 100). Purple indicates overlapping of DA and FA reduction. (B) Association between DA and HOMA-IR in all participants. Light red indicates the regions where higher HOMA-IR is associated with lower DA. The statistical maps (p < 0.05, corrected for multiple comparisons, controlling for age, white matter signal abnormality volume, and antihypertensive medication status) are thickened to aid visualization and superimposed on the Montreal Neurological Institute template image. DA = axial diffusivity; DTI = diffusion tensor imaging; FA = fractional anisotropy; HOMA-IR = homeostasis model assessment of insulin resistance; TBSS = Tract-Based Spatial Statistics.
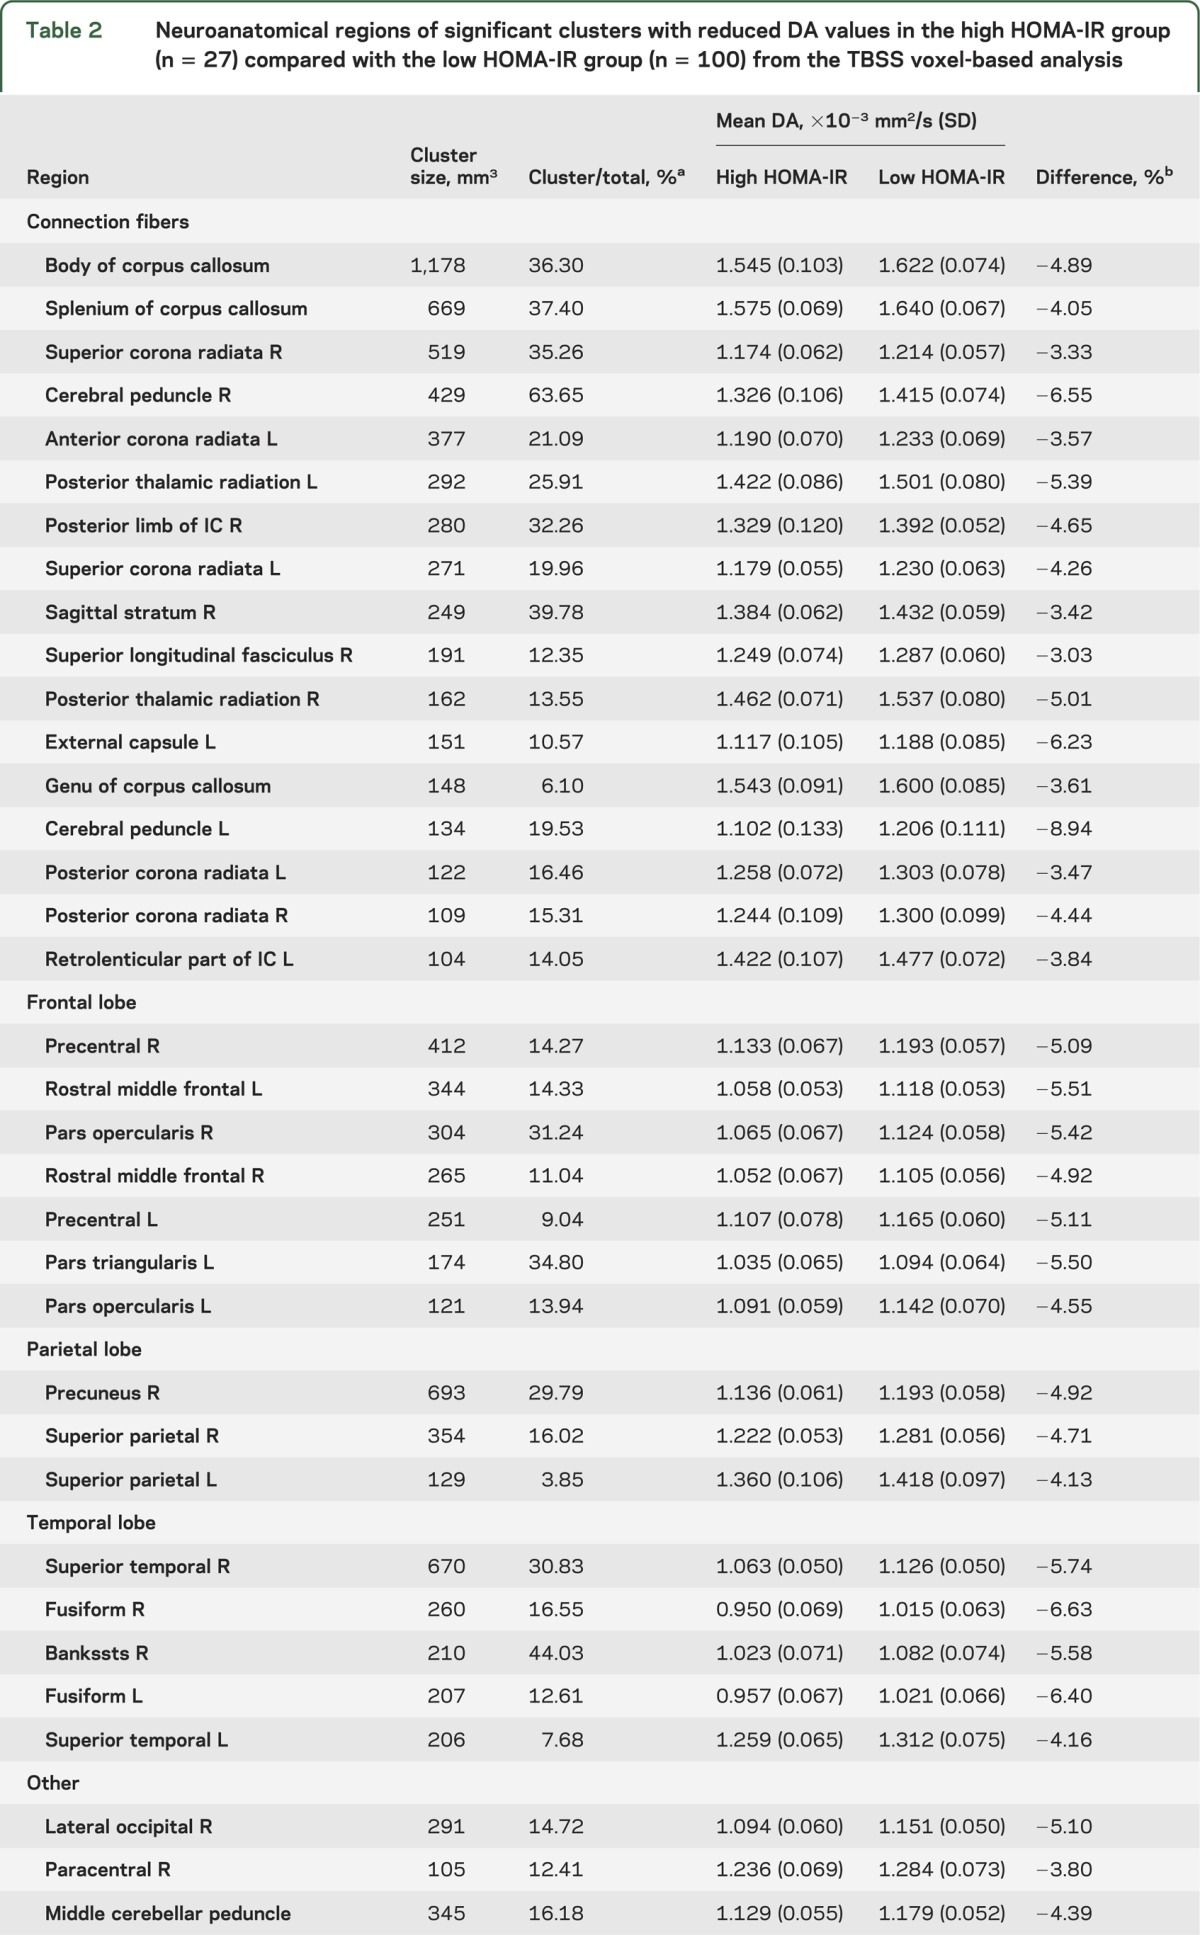
Individuals with high HOMA-IR had significantly lower DA in widespread cerebral WM regions compared with individuals who had low HOMA-IR. The greatest differences were in regions such as the CC, corona radiata, left posterior thalamic radiation, right cerebral peduncle, frontal WM, parietal WM (particularly right hemisphere), and temporal WM (figure 1A and table 2).
Table 2.
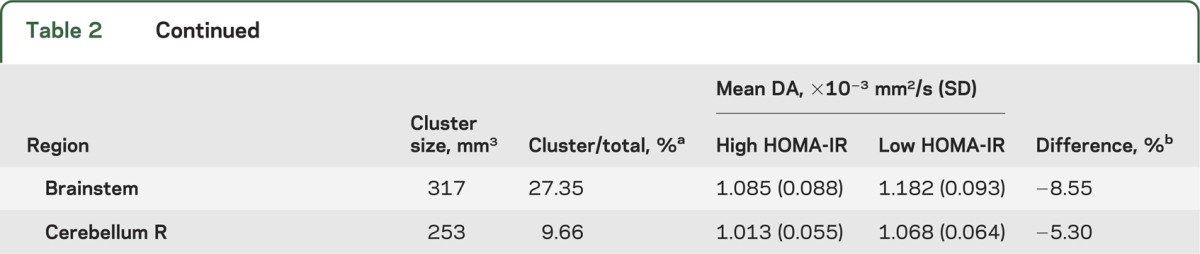
Neuroanatomical regions of significant clusters with reduced DA values in the high HOMA-IR group (n = 27) compared with the low HOMA-IR group (n = 100) from the TBSS voxel-based analysis
There were no regions showing higher FA/DA in the high HOMA-IR group than in the low HOMA-IR group. DR did not exhibit voxelwise differences between the high and low HOMA-IR groups.
Atlas-based ROI analyses.
The high HOMA-IR group demonstrated lower FA in the regions including the body and genu of CC, bilateral pars triangularis WM, left postcentral WM, and left pericalcarine WM, and greater FA in the right posterior limb of internal capsule (PLIC), than the low HOMA-IR group (uncorrected p < 0.01; table e-1 on the Neurology® Web site at Neurology.org). The right PLIC effect remained after correction for multiple comparisons (p < 0.05; table e-1).
Results for DA demonstrated DA differences (lower DA in the high HOMA-IR group) in the body of CC, bilateral cerebral peduncle, frontal WM, right precuneus WM, right temporal WM, brainstem, and left ventral diencephalon (uncorrected p < 0.01; corrected p < 0.05 for right cerebral peduncle; table e-1). In addition, results for DR revealed lower DR of the right PLIC in the high HOMA-IR group than in the low HOMA-IR group (corrected p < 0.05; table e-1).
Association between HOMA-IR and DTI indices across all participants: Voxelwise TBSS analyses.
We analyzed voxelwise TBSS associations between HOMA-IR and DTI measures in the entire sample to investigate the overall relationship independent of group.
Lower DA was significantly associated with higher HOMA-IR index in several areas throughout the cerebral WM. Most areas with significant associations overlapped with the areas where lower DA was observed in the high compared with the low HOMA-IR group, including strong effects in the CC, but involved slightly more frontal WM (figure 1B, table e-2). There was a marginal association between HOMA-IR and FA in the areas of the body and genu of CC, bilateral superior corona radiata, and left anterior corona radiata (p < 0.1; table e-2), corresponding to the areas where lower FA was observed in the high HOMA-IR group.
There were no significant positive associations between HOMA-IR and DA/FA. In addition, DR did not show a significant association with HOMA-IR.
Scatter plots demonstrating the relationship between mean DA and log-transformed HOMA-IR in 6 selected ROIs are presented in figure 2. Mean DA was extracted from clusters of corrected significant voxels resulting from the TBSS maps of group comparisons (figure 1A). These relationships between mean DA and HOMA-IR remained after correcting for APOE ε4 status (p < 0.05; table e-3). Among metabolic characteristics, there were differences of triglyceride levels between the high and low HOMA-IR groups (table 1). We therefore also statistically corrected for the effect of triglyceride, and the relationships remained unchanged (p < 0.05; table e-3).
Figure 2. Scatter plots demonstrating the association between mean DA and HOMA-IR values.

Mean DA was extracted within clusters resulting from the Tract-Based Spatial Statistics maps (p < 0.05, corrected for multiple comparisons, controlling for age, WM signal abnormality volume, and antihypertensive medication status) demonstrating high vs low HOMA-IR group comparisons (figure 1A). White circles indicate individuals on antihypertensive medication, and black circles indicate individuals not on medication. The vertical reference dotted line depicts the cutoff between low and high HOMA-IR levels. DA = axial diffusivity; HOMA-IR = homeostasis model assessment of insulin resistance; WM = white matter.
Interaction between age group (middle-aged vs older) and HOMA-IR on diffusion measures.
There were marginal differences in the associations of HOMA-IR with FA and DR between the middle-aged (younger than 60 years) and older (60 years or older) adults (p < 0.1, controlling for age) in parts of the CC and anterior cerebral WM. However, there were no significant age group differences in the associations between HOMA-IR and DA, demonstrating that the associations between HOMA-IR and DA were not strongly attributable to effects of aging-associated alterations in WM integrity.
DISCUSSION
The results of this study demonstrate that in generally healthy middle-aged and older adults, higher indices of HOMA-IR are associated with alterations in diffusional properties expressed as a lower DA value. The regions that demonstrated most significant associations between DTI indices and HOMA-IR included the CC, corona radiata, several other WM fiber tracts such as posterior thalamic radiation, frontoparietal WM, and temporal WM (figure 1). These findings of an association between WM microstructure and HOMA-IR contribute to a growing literature demonstrating a potential influence of IR on the brain.7–10
Prior neuroimaging studies demonstrated that higher IR or insulin levels were associated with reduced cerebral glucose metabolic rate in frontal, parietotemporal, and cingulate regions in cognitively normal adults with prediabetes/T2DM,7 progressive atrophy in medial temporal lobe, prefrontal cortices, and precuneus among late middle-aged participants,8 and reduced hippocampal volume or disrupted default mode network–hippocampal functional connectivity among middle-aged women at risk of AD.9,10 These imaging studies suggest that regional changes associated with AD may be in some way linked to IR. Our study using TBSS demonstrated DA differences (lower DA in the high HOMA-IR group) between the high and low HOMA-IR groups in the widespread cerebral WM with the most prominent differences observed in the CC (figure 1A, table 2) while lower DA was associated with higher HOMA-IR in the same regions as those showing significant group differences (figure 1B, table e-2). Prior DTI analyses of individuals with AD have demonstrated diffusion parameter changes in parahippocampal gyrus, posterior cingulum, posterior temporoparietal WM, and splenium, as well as fornix, uncinate fasciculus, and superior and inferior longitudinal fasciculi.13,14,31,32 Although the current study revealed WM microstructural alterations (by DA) in multiple brain regions (e.g., frontal and parietal WM), the most prominent associations (overlap of FA and DA differences) were found in the middle portion of CC and some connection fibers in the anterior cerebral WM. These findings in generally healthy adults therefore do not support other imaging studies in which IR may be a potential biomarker for AD risk through mechanisms based on patterns of AD-associated pathology. To verify our results showing differences with other studies,7–10 the spatial patterns of WM microstructural alterations associated with IR need to be replicated in different samples.
In the current study, we investigated the effect of IR on the diffusion parameters of FA, DA, and DR. Associations were strongest between HOMA-IR and DA. Only modest or little associations were found between HOMA-IR and FA/DR. It has been proposed that axonal damage has an effect on DA, whereas an increase in DR is more associated with demyelination.33 In our results, strong associations between HOMA-IR and DA might suggest changes in axonal properties. However, the interpretation of variation in specific diffusion parameters is still speculative in human studies. In addition, similar to the results reported here, some studies in AD have demonstrated more extensive differences in DA than FA.32,34,35 Our results also support findings of other studies that diffusivity measures such as DA might be more sensitive in capturing WM microstructural changes than FA of the most frequently used DTI index.
To compare with voxelwise analyses, we performed a separate ROI approach using an anatomically based WM atlas. In the ROI analyses, DA comparisons between the 2 groups were similar to those of voxelwise analyses. However, an unexpected result of higher FA and lower DR in the high HOMA-IR group than in the low HOMA-IR group was found in the right posterior limb: the opposite directions with most of other WM measured. It is possible that such a result could be due to deterioration of fibers crossing the posterior limb. However, the etiology and significance of this result are currently unclear.
APOE-related differences have been described for insulin metabolism in AD, and a stronger effect of diabetes and hyperinsulinemia on the risk of AD in the APOE ε4 noncarriers has been reported.36,37 We therefore explored whether APOE ε4 status influenced relationships between IR and DTI parameters. These analyses demonstrated that APOE ε4 status did not significantly influence the relationship between IR and WM microstructural measures in our sample of generally healthy adults (table e-3).
This is a cross-sectional study limited to a sample of generally healthy subjects, and direct causal link between IR and WM tissue integrity could therefore not be concluded from these results. Further work examining associations between IR and WM microstructure in individuals with degenerative disease as well as longitudinal and interventional studies with management in individuals with higher IR will be important to contrast with the current results and help to clarify whether IR has a direct influence on WM tissue integrity.
This study reveals that within a sample of cognitively healthy middle-aged and older adults, IR is associated with alterations of WM structural integrity, independent of age, WMSA volume, and antihypertensive medication status. These results may provide essential information and guide future work toward optimal clinical management of IR regarding neural health in older adults.
Supplementary Material
ACKNOWLEDGMENT
The authors thank Tyler Triggs, Paul Wilkens, and Matthew Curreri at the Athinoula A. Martinos Center for Biomedical Imaging, Massachusetts General Hospital (MGH), for technical assistance with the analyses.
GLOSSARY
- AD
Alzheimer disease
- CC
corpus callosum
- DA
axial diffusivity
- DR
radial diffusivity
- DTI
diffusion tensor imaging
- FA
fractional anisotropy
- HOMA-IR
homeostasis model assessment of insulin resistance
- IR
insulin resistance
- PLIC
posterior limb of internal capsule
- ROI
region of interest
- TBSS
Tract-Based Spatial Statistics
- T2DM
type 2 diabetes mellitus
- WM
white matter
- WMSA
white matter signal abnormality
Footnotes
Supplemental data at Neurology.org
AUTHOR CONTRIBUTIONS
Seon Young Ryu, MD: drafting/revising the manuscript for content, analysis and interpretation of data, statistical analysis. Jean-Philippe Coutu, BEng: analysis and interpretation of data, statistical analysis, revising the manuscript. H. Diana Rosas, MD: revising the manuscript, acquisition of data. David H. Salat, PhD: revising the manuscript, study concept and design, acquisition of data, obtaining funding.
STUDY FUNDING
Supported by NIH/NINR: R01NR10827, R01NS42861. The authors thank the Athinoula A. Martinos Center for Biomedical Imaging, MGH, where this study was performed, and acknowledge the use of resources provided by the Center for Functional Neuroimaging Technologies, P41RR14075, a P41 Regional Resource supported by the Biomedical Technology Program of the National Center for Research Resources (NCRR), NIH, as well as instrumentation obtained through the support of NCRR Shared Instrumentation Grant Program and/or High-End Instrumentation Grant Program; specifically, grants S10RR021110, S10RR023401, S10RR019307, S10RR019254, and S10RR023043. The authors also thank the Advanced Multimodal Neuroimaging Training Program (2T90DA022759; principal investigator Bruce Rosen) at the MGH/HST Athinoula A. Martinos Center for Biomedical Imaging and the Fonds de Recherche du Québec–Santé, which supported J.-P.C.
DISCLOSURE
S. Ryu, J. Coutu, and H. Rosas report no disclosures relevant to the manuscript. D. Salat received funding from NIH grant R01NR10827. Go to Neurology.org for full disclosures.
REFERENCES
- 1.US Department of Health and Human Services, National Diabetes Information Clearinghouse. Insulin resistance and prediabetes [online]. Available at: www.diabetes.niddk.nih.gov/dm/pubs/insulinresistance/. Accessed July 28, 2009
- 2.Craft S, Watson GS. Insulin and neurodegenerative disease: shared and specific mechanisms. Lancet Neurol 2004;3:169–178 [DOI] [PubMed] [Google Scholar]
- 3.Ronnemaa E, Zethelius B, Sundelof J, et al. Impaired insulin secretion increases the risk of Alzheimer disease. Neurology 2008;71:1065–1071 [DOI] [PubMed] [Google Scholar]
- 4.Schrijvers EM, Witteman JC, Sijbrands EJ, Hofman A, Koudstaal PJ, Breteler MM. Insulin metabolism and the risk of Alzheimer disease: the Rotterdam Study. Neurology 2010;75:1982–1987 [DOI] [PMC free article] [PubMed] [Google Scholar]
- 5.Gasparini L, Gouras GK, Wang R, et al. Stimulation of beta-amyloid precursor protein trafficking by insulin reduces intraneuronal beta-amyloid and requires mitogen-activated protein kinase signaling. J Neurosci 2001;21:2561–2570 [DOI] [PMC free article] [PubMed] [Google Scholar]
- 6.Hong M, Lee VM. Insulin and insulin-like growth factor-1 regulate tau phosphorylation in cultured human neurons. J Biol Chem 1997;272:19547–19553 [DOI] [PubMed] [Google Scholar]
- 7.Baker LD, Cross DJ, Minoshima S, Belongia D, Watson GS, Craft S. Insulin resistance and Alzheimer-like reductions in regional cerebral glucose metabolism for cognitively normal adults with prediabetes or early type 2 diabetes. Arch Neurol 2011;68:51–57 [DOI] [PMC free article] [PubMed] [Google Scholar]
- 8.Willette AA, Xu G, Johnson SC, et al. Insulin resistance, brain atrophy, and cognitive performance in late middle-aged adults. Diabetes Care 2013;36:443–449 [DOI] [PMC free article] [PubMed] [Google Scholar]
- 9.Rasgon NL, Kenna HA, Wroolie TE, et al. Insulin resistance and hippocampal volume in women at risk for Alzheimer's disease. Neurobiol Aging 2011;32:1942–1948 [DOI] [PMC free article] [PubMed] [Google Scholar]
- 10.Kenna H, Hoeft F, Kelley R, et al. Fasting plasma insulin and the default mode network in women at risk for Alzheimer's disease. Neurobiol Aging 2013;34:641–649 [DOI] [PMC free article] [PubMed] [Google Scholar]
- 11.Mori S, Zhang J. Principles of diffusion tensor imaging and its applications to basic neuroscience research. Neuron 2006;51:527–539 [DOI] [PubMed] [Google Scholar]
- 12.Westlye LT, Walhovd KB, Dale AM, et al. Life-span changes of the human brain white matter: diffusion tensor imaging (DTI) and volumetry. Cereb Cortex 2010;20:2055–2068 [DOI] [PubMed] [Google Scholar]
- 13.Chua TC, Wen W, Slavin MJ, Sachdev PS. Diffusion tensor imaging in mild cognitive impairment and Alzheimer's disease: a review. Curr Opin Neurol 2008;21:83–92 [DOI] [PubMed] [Google Scholar]
- 14.Sachdev PS, Zhuang L, Braidy N, Wen W. Is Alzheimer's a disease of the white matter? Curr Opin Psychiatry 2013;26:244–251 [DOI] [PubMed] [Google Scholar]
- 15.Hsu JL, Chen YL, Leu JG, et al. Microstructural white matter abnormalities in type 2 diabetes mellitus: a diffusion tensor imaging study. Neuroimage 2012;59:1098–1105 [DOI] [PubMed] [Google Scholar]
- 16.Reijmer YD, Brundel M, de Bresser J, Kappelle LJ, Leemans A, Biessels GJ. Microstructural white matter abnormalities and cognitive functioning in type 2 diabetes: a diffusion tensor imaging study. Diabetes Care 2013;36:137–144 [DOI] [PMC free article] [PubMed] [Google Scholar]
- 17.Folstein MF, Folstein SE, McHugh PR. “Mini-Mental State”: a practical method for grading the cognitive state of patients for the clinician. J Psychiatr Res 1975;12:189–198 [DOI] [PubMed] [Google Scholar]
- 18.Matthews DR, Hosker JP, Rudenski AS, Naylor BA, Treacher DF, Turner RC. Homeostasis model assessment: insulin resistance and beta-cell function from fasting plasma glucose and insulin concentrations in man. Diabetologia 1985;28:412–419 [DOI] [PubMed] [Google Scholar]
- 19.Taniguchi A, Fukushima M, Sakai M, et al. Remnant-like particle cholesterol, triglycerides, and insulin resistance in nonobese Japanese type 2 diabetic patients. Diabetes Care 2000;23:1766–1769 [DOI] [PubMed] [Google Scholar]
- 20.McLachlan G, Peel D. Finite Mixture Models. Hoboken, NJ: John Wiley & Sons; 2000 [Google Scholar]
- 21.Reese TG, Heid O, Weisskoff RM, Wedeen VJ. Reduction of eddy-current-induced distortion in diffusion MRI using a twice-refocused spin echo. Magn Reson Med 2003;49:177–182 [DOI] [PubMed] [Google Scholar]
- 22.Smith SM, Jenkinson M, Johansen-Berg H, et al. Tract-Based Spatial Statistics: voxelwise analysis of multi-subject diffusion data. Neuroimage 2006;31:1487–1505 [DOI] [PubMed] [Google Scholar]
- 23.Smith SM, Jenkinson M, Woolrich MW, et al. Advances in functional and structural MR image analysis and implementation as FSL. Neuroimage 2004;23(suppl 1):S208–S219 [DOI] [PubMed] [Google Scholar]
- 24.Salat DH, Lee SY, van der Kouwe AJ, Greve DN, Fischl B, Rosas HD. Age-associated alterations in cortical gray and white matter signal intensity and gray to white matter contrast. Neuroimage 2009;48:21–28 [DOI] [PMC free article] [PubMed] [Google Scholar]
- 25.Fischl B, Salat DH, Busa E, et al. Whole brain segmentation: automated labeling of neuroanatomical structures in the human brain. Neuron 2002;33:341–355 [DOI] [PubMed] [Google Scholar]
- 26.Salat DH, Tuch DS, van der Kouwe AJ, et al. White matter pathology isolates the hippocampal formation in Alzheimer's disease. Neurobiol Aging 2010;31:244–256 [DOI] [PMC free article] [PubMed] [Google Scholar]
- 27.Jacobs HI, Leritz EC, Williams VJ, et al. Association between white matter microstructure, executive functions, and processing speed in older adults: the impact of vascular health. Hum Brain Mapp 2013;34:77–95 [DOI] [PMC free article] [PubMed] [Google Scholar]
- 28.Nichols TE, Holmes AP. Nonparametric permutation tests for functional neuroimaging: a primer with examples. Hum Brain Mapp 2002;15:1–25 [DOI] [PMC free article] [PubMed] [Google Scholar]
- 29.Smith SM, Nichols TE. Threshold-free cluster enhancement: addressing problems of smoothing, threshold dependence and localisation in cluster inference. Neuroimage 2009;44:83–98 [DOI] [PubMed] [Google Scholar]
- 30.Holm SA. Simple sequentially rejective multiple test procedure. Scand J Stat 1979;6:65–70 [Google Scholar]
- 31.Stricker NH, Schweinsburg BC, Delano-Wood L, et al. Decreased white matter integrity in late-myelinating fiber pathways in Alzheimer's disease supports retrogenesis. Neuroimage 2009;45:10–16 [DOI] [PMC free article] [PubMed] [Google Scholar]
- 32.Acosta-Cabronero J, Williams GB, Pengas G, Nestor PJ. Absolute diffusivities define the landscape of white matter degeneration in Alzheimer's disease. Brain 2010;133:529–539 [DOI] [PubMed] [Google Scholar]
- 33.Song SK, Sun SW, Ju WK, Lin SJ, Cross AH, Neufeld AH. Diffusion tensor imaging detects and differentiates axon and myelin degeneration in mouse optic nerve after retinal ischemia. Neuroimage 2003;20:1714–1722 [DOI] [PubMed] [Google Scholar]
- 34.O'Dwyer L, Lamberton F, Bokde AL, et al. Multiple indices of diffusion identifies white matter damage in mild cognitive impairment and Alzheimer's disease. PLoS One 2011;6:e21745. [DOI] [PMC free article] [PubMed] [Google Scholar]
- 35.Acosta-Cabronero J, Alley S, Williams GB, Pengas G, Nestor PJ. Diffusion tensor metrics as biomarkers in Alzheimer's disease. PLoS One 2012;7:e49072. [DOI] [PMC free article] [PubMed] [Google Scholar]
- 36.Craft S, Peskind E, Schwartz MW, Schellenberg GD, Raskind M, Porte D., Jr Cerebrospinal fluid and plasma insulin levels in Alzheimer's disease: relationship to severity of dementia and apolipoprotein E genotype. Neurology 1998;50:164–168 [DOI] [PubMed] [Google Scholar]
- 37.Reger MA, Watson GS, Frey WH, II, et al. Effects of intranasal insulin on cognition in memory-impaired older adults: modulation by APOE genotype. Neurobiol Aging 2006;27:451–458 [DOI] [PubMed] [Google Scholar]
- 38.Cole TJ. Sympercents: symmetric percentage differences on the 100 log(e) scale simplify the presentation of log transformed data. Stat Med 2000;19:3109–3125 [DOI] [PubMed] [Google Scholar]
Associated Data
This section collects any data citations, data availability statements, or supplementary materials included in this article.