

Abstract
Objective:
To determine antemortem MRI findings associated with microinfarcts at autopsy.
Methods:
Patients with microinfarcts (n = 22) and patients without microinfarcts (n = 44) who underwent antemortem MRI were identified from a dementia clinic–based, population–based, and community clinic–based autopsy cohort. The microinfarct and no-microinfarct groups were matched on age at MRI, age at death, sex, APOE status, Mini-Mental State Examination score, and pathologic diagnosis of Alzheimer disease. Brain infarcts were assessed on fluid-attenuated inversion recovery (FLAIR) MRI. White matter hyperintensities on FLAIR MRI and hippocampal volumes on T1-weighted MRI were quantified using automated methods. A subset of subjects with microinfarcts (n = 15) and a matched group of subjects without microinfarcts (n = 15) had serial T1-weighted MRIs and were included in an analysis of global and regional brain atrophy rates using automated methods.
Results:
The presence of cortical (p = 0.03) and subcortical (p = 0.02) infarcts on antemortem MRI was associated with presence of microinfarcts at autopsy. Higher numbers of cortical (p = 0.05) and subcortical (p = 0.03) infarcts on antemortem MRI were also associated with presence of microinfarcts. Presence of microinfarcts was not associated with white matter hyperintensities and cross-sectional hippocampal volume on antemortem MRI. Whole-brain and regional precuneus, motor, and somatosensory atrophy rates were higher in subjects with microinfarcts compared to subjects without microinfarcts.
Conclusions:
Microinfarcts increase brain atrophy rates independent of Alzheimer disease pathology. Association between microinfarct pathology and macroinfarcts on MRI suggests either common risk factors or a shared pathophysiology and potentially common preventive targets.
Microinfarcts are a common pathology identified in older adults with and without dementia.1–4 They are associated with deficits in perceptual speed, semantic memory, and episodic memory.1,2,4,5 The resolution of conventional MRI, the clinical standard for noninvasive detection of vascular disease in the brain, is insufficient for detecting microinfarcts.6 Hence, this common pathologic contributor to cognitive impairment and dementia is not assessed, while magnetic resonance (MR)-detectable types of cerebrovascular pathology, such as white matter hyperintensities (WMH) or visible infarcts, are assessed.1,2,4,6–11 These latter features, while visible on MRI and therefore available antemortem, are imperfect markers for the complete spectrum of vascular brain injury relevant to cognition.
In this study, we aimed to identify the antemortem MRI findings associated with the presence of microinfarcts at autopsy. The MRI measures we investigated as potential in vivo surrogate markers of microinfarcts at autopsy were brain atrophy rates, cross-sectional hippocampal volumes, WMH load, and cerebral macroinfarcts on antemortem MRI.
METHODS
Subjects.
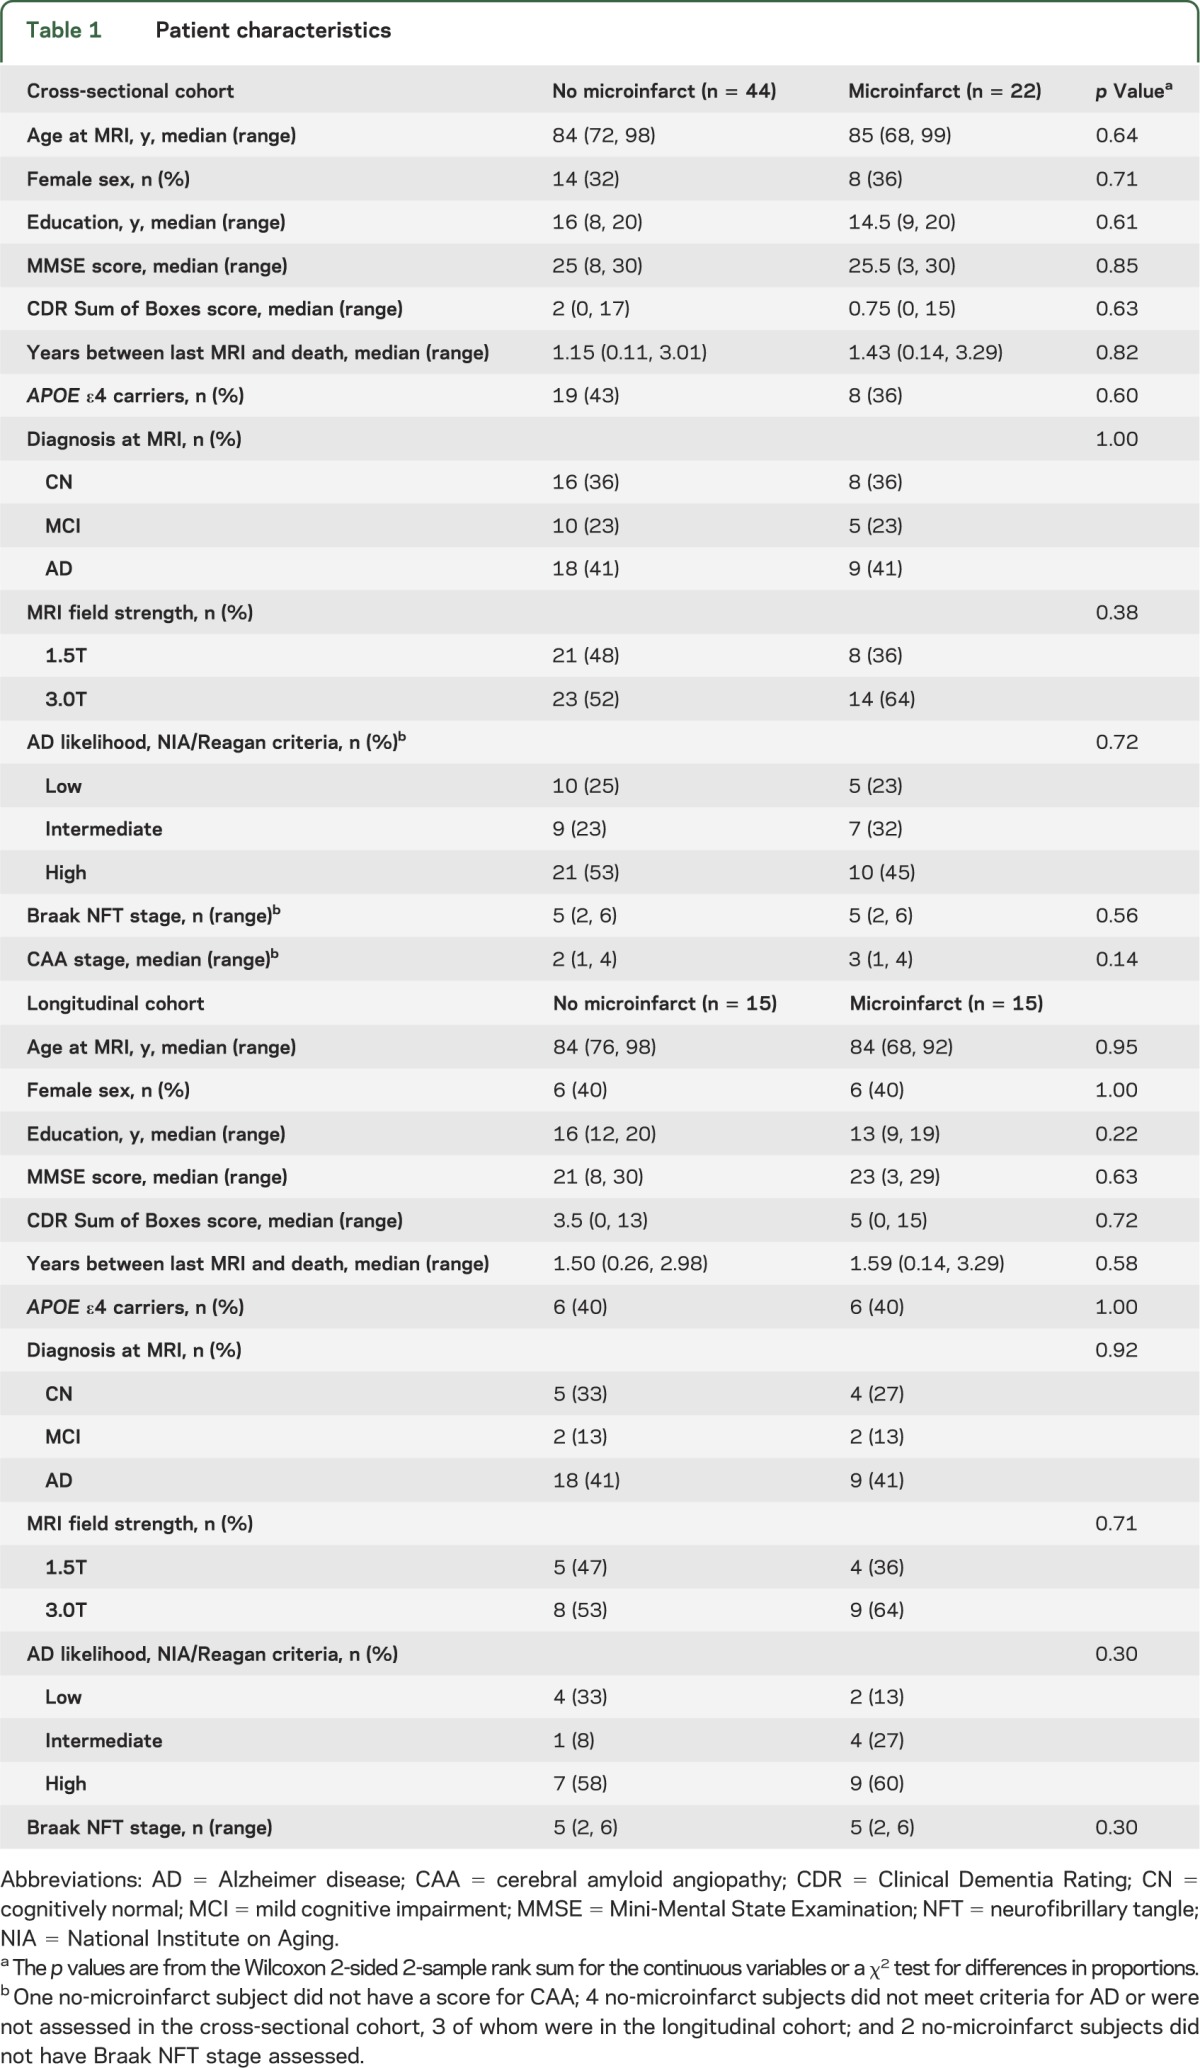
The microinfarct and no-microinfarct subject groups (n = 66) were chosen from an autopsy cohort (table 1). They were participants in one of 3 prospective studies during the years of 1999 through 2011: (1) dementia clinic–based Mayo Clinic Alzheimer's Disease Research Center; (2) community clinic–based Alzheimer's Disease Patient Registry; or (3) population-based Mayo Clinic Study of Aging.12,13 Individuals participating in these prospective cohorts on aging and dementia undergo approximately annual MRI and clinical and neuropsychological examinations. Inclusion and exclusion were based on neuropathologic findings. Subjects with microinfarcts (n = 22) were chosen based on presence of microinfarcts recorded at autopsy. The autopsy reports do not consistently specify regions of microinfarct findings; however, every microinfarct subject has at least one cerebral microinfarct recorded, which is required for an entry of microinfarct present. Inclusion criteria for microinfarct subjects were as follows: patients within the spectrum of Alzheimer disease (AD) pathology (low, intermediate, or high likelihood) or pathologically normal; MRI up to 3.5 years before death; and at least one cerebral microinfarct identified at autopsy. The range of 3.5 years before death was chosen to remain close to the time of death, while allowing for a large enough sample size. Microinfarct subjects were 2:1 matched with 44 no-microinfarct subjects on age at MRI, age at death, sex, APOE status, Mini-Mental State Examination score, and pathologic diagnosis of AD. Inclusion criteria for no-microinfarct subjects were the same, except these individuals did not have microinfarcts present at autopsy. We excluded patients who had neurodegenerative diseases other than AD, such as Lewy body disease and frontotemporal lobar degeneration. From this cohort, we further identified subjects with microinfarcts (n = 15) and matched subjects without microinfarcts (n = 15) who had at least 2 serial MRIs acquired 1 to 2 years apart for longitudinal analysis.
Table 1.
Patient characteristics
Standard protocol approvals, registrations, and patient consents.
This study was approved by the Mayo Clinic Institutional Review Board, and all subjects or appropriate surrogates provided informed consent for participation.
Image acquisition.
All subjects underwent MRI at 1.5 or 3.0 tesla (GE Healthcare, Milwaukee, WI). Fluid-attenuated inversion recovery (FLAIR) and magnetization-prepared rapid-acquisition gradient echo (MPRAGE) at 3.0T (n = 37) or spoiled gradient recalled echo (SPGR) at 1.5T (n = 29) were acquired for all patients.
Segmentation and quantification of WMH.
WMH volumes were measured using a semiautomated segmentation algorithm. MPRAGE images were used for segmentation of white matter, gray matter, and CSF using SPM5 (http://www.fil.ion.ucl.ac.uk/spm; access year 2005). FLAIR and MPRAGE/SPGR images were coregistered, and the MPRAGE/SPGR segmentation was used to create a white matter mask to reduce false-positives on the WMH segmentation from FLAIR. WMH was segmented using an automated slice-based seed initialization and region growing method. The region growing step classified voxels into 5 classes: CSF, gray matter, white matter, WMH, and partial volume averaged WMH. The segmented WMH voxels were multiplied with the white matter mask. The WMH masks were manually edited by a trained analyst in order to exclude artifacts from the WMH volume. WMH fraction was calculated as a proportion of diseased white matter out of total white matter volume.14
Assessment of infarcts.
Cortical infarcts were defined as areas of higher signal intensity in the cortical gray mantle that in any area exceeded 1 cm in diameter. Cerebral subcortical infarcts were defined as subcortical lesions of 3 mm or more surrounded by a hyperintense rim.15 Hyperintensities on FLAIR images associated with infarcts were marked and were reclassified as hyperintensities associated with cortical or subcortical infarcts. Hyperintensities associated with infarcts were not included in the total WMH volume of an individual subject because of distinct pathophysiologic differences between the 2 lesions.
Hippocampal volumes.
Hippocampal volumes were calculated using FreeSurfer version 5.3 (www.freesurfer.net; access year 2013). T1-weighted images were acquired using the SPGR pulse sequence at 1.5T or MPRAGE at 3.0T. Volumes calculated in subjects with SPGR images were transformed into MPRAGE units (described in the statistical analysis section).
Longitudinal MRI: Boundary shift integral.
The boundary shift integral method was used to calculate rates of change in whole-brain volume and ventricular volume on serial T1-weighted images.16 Rates were measured as annualized percent change, because subjects had serial scans acquired between 1 and 2 years apart. The subjects used in this analysis had no new infarcts between their first and second scans. All infarcts were chronic and did not change shape between scans. Two cases and 2 controls were excluded from longitudinal whole-brain atrophy rate analysis because of artifact on their MRI.
Longitudinal MRI: Tensor-based morphometry–symmetric diffeomorphic image normalization.
Regional longitudinal cerebral gray matter atrophy rates were derived using the tensor-based morphometry–symmetric diffeomorphic image normalization method, which utilizes symmetric registration of serial scans.17 The 2 cases and 2 controls with artifact on their MRI were also excluded from this analysis. Symmetric diffeomorphic image normalization deformations between each subject's serial scans are computed using the preprocessed T1-weighted images, and an annualized log Jacobian map is produced. The image is then segmented using SPM5. We determined voxel-wise differences in atrophy rates between subjects with and without microinfarcts using 2-sided t tests adjusting for the Braak neurofibrillary tangle (NFT) stage. Results were assessed at p < 0.001 and thresholded to clusters of 50 voxels or more.
Neuropathology.
Neuropathologic sampling followed recommendations of the Consortium to Establish a Registry for Alzheimer's Disease (CERAD) and pathologic diagnosis followed the National Institute on Aging/Reagan criteria. AD-related NFT pathology was staged using the Braak and Braak method, and β-amyloid burden was scored using CERAD criteria.18 Severity of cerebral amyloid angiopathy (CAA) was categorized into 4 stages. Microinfarcts were defined as infarcts that can only be seen under the microscope on hematoxylin & eosin–stained slides. The following brain regions were sampled: superior and middle frontal gyrus, motor cortex, cingulate gyrus, nucleus basalis, temporal cortex, parietal cortex, visual cortex, amygdala, anterior hippocampus, hippocampus at the level of the lateral geniculate nucleus, basal ganglia, caudate, thalamus, cerebellum, midbrain, pons, medulla, pituitary, optic nerve, and olfactory bulb.
Statistical analysis.
To determine the feasibility of combining the results of hippocampal and WMH volumes from scans acquired at different field strengths and using different pulse sequences, we used a set of 20 patients who had MRIs acquired at both 1.5T and 3.0T within a short interval of time. We performed Pearson correlations on volume results at the 2 field strengths and found that there was a high correlation in the 5 ROIs tested (figure e-1 on the Neurology® Web site at Neurology.org), which supported the use of a linear regression model to transform the 1.5T data to an equivalent 3.0T data result. The χ2 tests were performed when measuring group differences on categorical variables and Wilcoxon rank sum tests were used for continuous measures. Because we excluded 2 subjects from the analysis of whole-brain atrophy rates, we additionally adjusted for Braak NFT stage when performing group comparisons on longitudinal MRI data using analysis of covariance.
RESULTS
Because of the matching procedure, subjects with and without microinfarcts did not differ on age at MRI, age at death, sex, education, Mini-Mental State Examination score, clinical diagnosis, pathologic diagnosis of AD, Braak NFT stage, APOE ε4 status, and magnetic field strength for MRI. Although patients with microinfarcts had a higher median score for CAA severity, the difference did not reach significance (table 1).
The presence of cortical and subcortical infarcts on antemortem MRI was associated with presence of microinfarcts at autopsy. Higher numbers of cortical and subcortical infarcts on antemortem MRI were also associated with presence of microinfarcts (table 2). Compared with subjects without microinfarcts, patients with microinfarcts had almost twice the prevalence rate of cortical infarcts and almost double the rate of subcortical infarcts (figure 1). A majority of the cortical infarcts were in the occipital and parietal lobes in both microinfarct and no-microinfarct patients. In subjects with microinfarcts, 5 of 10 cortical infarcts occurred in the occipital lobe, 4 of 10 in the parietal lobe, and 1 of 10 in the temporal lobe. No cortical infarcts were present in the frontal lobe. In subjects without microinfarcts, 5 of 12 cortical infarcts occurred in the occipital lobe, 3 of 12 in the parietal lobe, 2 of 12 in the temporal lobe, and 2 of 12 in the frontal lobe. Subcortical infarcts were found more often in the hemispheric white matter (23/27 in microinfarct subjects and 19/27 in no-microinfarct subjects) than the central gray matter and capsular regions (3/27 in microinfarct subjects and 8/27 in no-microinfarct subjects). More of the microinfarct subjects (8/22) had both cortical and subcortical infarcts (36%) compared with no-microinfarct subjects (3/44) (7%). Fractional WMH and hippocampal volumes were not different among subjects with microinfarcts as compared with no-microinfarct subjects (table 2).
Table 2.
Cross-sectional antemortem MRI findings
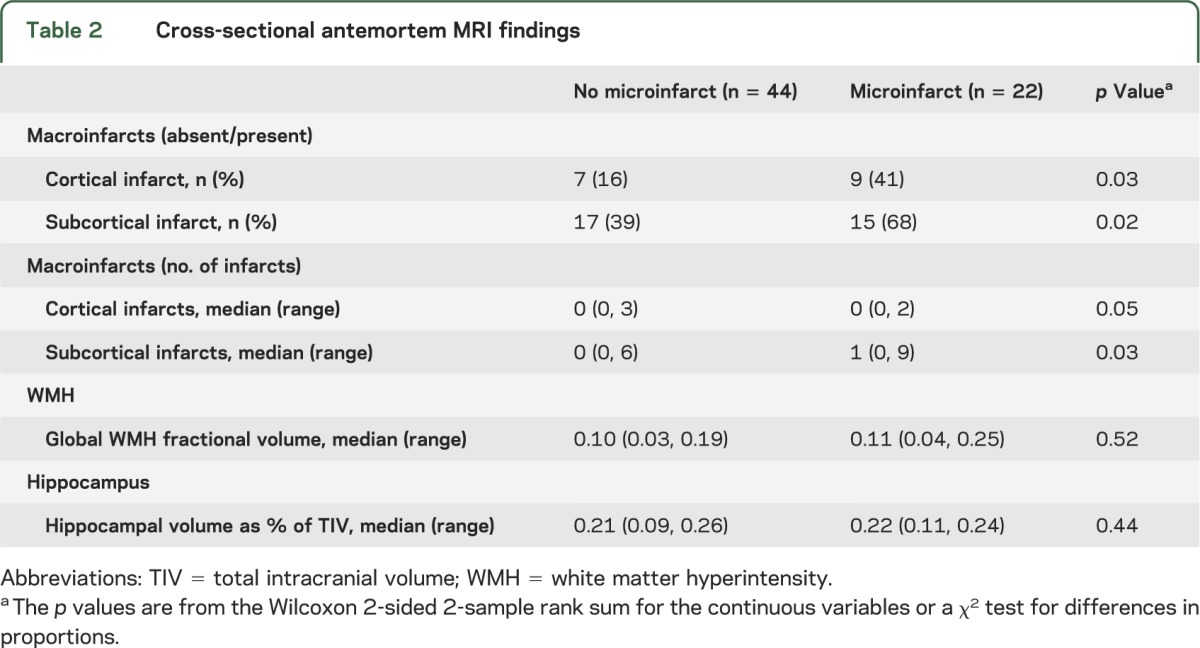
Figure 1. Percentage of subjects by number of infarcts in subjects with and without microinfarcts.
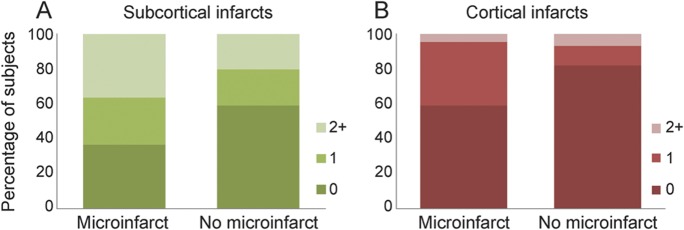
Plots show percentage of subjects by number of infarcts within each patient group. Colors represent numbers of subcortical and cortical infarcts (see legends). Presence and number of subcortical infarcts were associated with presence of microinfarcts (A). Presence and number of cortical infarcts were associated with presence of microinfarcts (B).
Annualized rates of whole-brain atrophy as measured with boundary shift integral were greater in microinfarct subjects (mean = −1.4%; SD = 0.5) than no-microinfarct subjects (mean = −0.8%; SD = 0.6). Rate of ventricular volume expansion was not different in microinfarct subjects (mean = 7.6%; SD = 2.7) compared with no-microinfarct subjects (mean = 6.0%; SD = 3.4) (figure 2), although the direction was similar to whole-brain rates, with greater ventricular expansion in those with microinfarcts. Regional rates of gray matter change measured in the same subjects with serial scans using tensor-based morphometry–symmetric diffeomorphic image normalization were greater in microinfarct subjects than no-microinfarct subjects in the right and left precuneus, and primary motor and somatosensory cortices (figure 3).
Figure 2. Group differences in whole-brain atrophy.
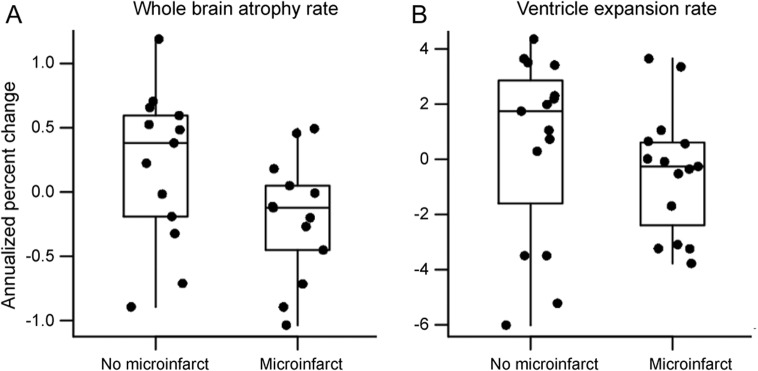
(A) Rate of whole-brain atrophy measured using boundary shift integral was higher (p = 0.05) in subjects with microinfarcts. (B) Rate of ventricular volume increase was not different between the 2 groups (p = 0.37).
Figure 3. Voxel-wise analysis of group differences in brain atrophy.

(A) Voxel-wise comparison of rates of gray matter atrophy between subjects with and without microinfarcts (p < 0.001). (B) Diagram illustrating that microinfarct subjects show higher rates of atrophy at the border zones between the vascular territories of the major cerebral arteries.
DISCUSSION
This study on antemortem MRI in patients with microinfarcts at autopsy indicated that the presence and number of cortical and subcortical infarcts on MRI are associated with microinfarcts at autopsy. Although the presence of microinfarcts was not associated with WMH burden and cross-sectional hippocampal volumes on antemortem MRI, whole-brain atrophy rates were increased in the group with microinfarcts after controlling for AD-related pathology. The regional distribution of brain volume loss in the microinfarct group included the precuneus regions in both hemispheres as well as the motor and somatosensory cortices.
The finding that the presence and number of cortical and subcortical infarcts on MRI were associated with microinfarcts at autopsy suggests an overlap in vascular disease mechanisms that may be responsible for these lesions. Neuropathologic findings in autopsy studies have similarly shown that there is an association between cerebral macroinfarcts and microinfarcts.1,9,11 However, it is not known whether there is a mechanistic link between macro- and microinfarcts. Cortical hemispheric infarcts are thought to be attributed to embolic occlusion from proximal embolic sources. Subcortical infarcts are considered to be the result of sclerosis of penetrating vessels and are often associated with chronic hypertension.19 The association between macro- and microinfarcts suggests that both of these mechanisms might be related to microinfarcts. Nonetheless, the imperfect association between macroinfarcts on MRI and microinfarcts at postmortem examination may account for the modest predictive value of MR-visible infarcts on cognition.15,20–22
Imaging and autopsy correlation studies indicate that WMH are surrogates for small-vessel ischemic disease and increase the risk of cognitive decline and mild cognitive impairment.15,22–30 Our finding that WMH fractional volume was not associated with presence of microinfarcts may reflect a lack of power to detect the weak commonalities between WMH accumulation and microinfarcts. WMH burden may be a poor proxy for microinfarcts because WMH is also associated with CAA.29,31 While WMH burden is associated with cognitive decline, this association is also weak.17,24–32 An association has previously been found between microinfarct burden and CAA severity.33 In our cohort, we saw a trend toward higher CAA severity in the microinfarct group compared with the no-microinfarct group. This result could be tempered by small sample size and because we did not select our cohort based on presence of CAA.
There was no difference in cross-sectional or longitudinal hippocampal volumes between cases with and without microinfarcts, suggesting that the impact of microinfarcts on hippocampal volumes is weak, contrary to the increased rates of whole-brain atrophy associated with microinfarcts. This finding is consistent with a previous study that found no relationship between cerebrovascular disease pathologies and hippocampal volume.27
In our analysis of whole-brain atrophy rates, we controlled for the effects of AD on brain atrophy by matching on AD pathology and adjusting for Braak NFT stage using analysis of covariance. Our findings indicate that the presence of microinfarcts is associated with increased global brain atrophy rates independent of AD-related pathology. Group differences in regional rates of atrophy seen in the bilateral precuneus and pre- and postcentral gyri are interesting, particularly because of the localization of higher cortical atrophy rates in the microinfarct group. As illustrated in the diagram in figure 3, higher cortical atrophy rates are localized to the border or watershed zones of major arterial territories. The atrophy seen in the precuneus lies at the border between the anterior cerebral artery and the posterior cerebral artery territories. Regions of atrophy in the primary motor and somatosensory cortices and the premotor cortex lie at the boundary between the territories of the anterior cerebral artery and the middle cerebral artery. This pattern of atrophy may reflect the neuronal loss associated with numerous microinfarcts occurring preferentially in those areas. Watershed zones are highly susceptible to ischemia due to hypoperfusion caused by hypotension or microemboli,34 leading to macroscopic infarcts in these areas. Previous studies have hypothesized that microinfarcts may be particularly prevalent in watershed areas based on observations at autopsy.35,36 Because it is impossible to sample the entire brain for neuropathologic analysis, it is difficult to prove this preference using limited sampling. The pattern of longitudinal gray matter atrophy we found supports the possibility of increased density of microinfarcts at watershed zones susceptible to hypoperfusion. An alternative hypothesis is that atrophy seen in the precuneus could indicate impact of microinfarcts on a region that is considered a hub of structural and functional connectivity, with connections to the medial temporal lobe, prefrontal cortex, occipital lobe, and inferior parietal lobe.37–39 A recent autopsy study reported that patients who present with even one microinfarct on histologic analysis may in fact have hundreds to thousands of microinfarcts distributed across the entire brain.40 Our finding of increased atrophy rates in one of, if not the most, highly connected functional hubs could suggest a mechanism of wallerian degeneration with lesions widely distributed across brain regions affecting atrophy rates in highly connected cortical regions. Future work should consider whether the effects of microinfarct pathology and AD pathology are additive or interactive on brain atrophy. Furthermore, it will be important to investigate correlations between the presence of microinfarcts at autopsy and structural and functional connectivity on in vivo diffusion tensor imaging and task-free functional MRI.
A limitation of this study is the use of a global measure (presence or absence) for the assessments of microinfarcts without any information on region or density of the lesions, making it impossible to investigate relationships between regional gray matter atrophy and local microinfarcts. Another limitation of our study is that we did not sample every brain region, and it is possible that unsampled regions might have harbored microinfarcts in our control group with no microinfarcts. However, patients who present with one or more microinfarcts in limited pathologic sampling likely have many microinfarcts distributed globally.40
Our findings indicate that cerebral microinfarcts and macroinfarcts either share common risk factors or common pathophysiology, suggesting that they may potentially benefit from common preventive approaches. In addition, the influence of microinfarct pathology on brain atrophy rates is an important consideration when using MRI-based volumetric measurement as surrogate markers of AD progression or treatment response in clinical trials.
Supplementary Material
GLOSSARY
- AD
Alzheimer disease
- CAA
cerebral amyloid angiopathy
- CERAD
Consortium to Establish a Registry for Alzheimer's Disease
- FLAIR
fluid-attenuated inversion recovery
- MPRAGE
magnetization-prepared rapid-acquisition gradient echo
- MR
magnetic resonance
- NFT
neurofibrillary tangle
- ROI
region of interest
- SPGR
spoiled gradient recalled echo
- WMH
white matter hyperintensity
Footnotes
Supplemental data at Neurology.org
AUTHOR CONTRIBUTIONS
Ms. Raman: drafting of manuscript, study concept and design, acquisition of data, analysis and interpretation of data. Mr. Preboske: analysis and interpretation of data, critical revision of manuscript for important intellectual content. Mr. Przybelski: analysis or interpretation of the data, critical revision of the manuscript for important intellectual content. Dr. Gunter, Mr. Senjem, Dr. Vemuri, Dr. Murphy, Dr. Murray, Dr. Boeve, Dr. Knopman, Dr. Petersen, Dr. Parisi, and Dr. Dickson: acquisition of data, critical revision of the manuscript for important intellectual content. Dr. Jack: study concept and design, acquisition of data, critical revision of the manuscript for important intellectual content. Dr. Kantarci: drafting the manuscript, study concept and design, acquisition of data, analysis and interpretation of the data, critical revision of the manuscript for important intellectual content.
STUDY FUNDING
Supported by Mayo Alzheimer Disease Research grant (P50 AG016574), Mayo Clinic Study on Aging (U01 AG006786), R01-AG040042, R01-AG011378, and Robert H. and Clarice Smith and Abigail van Buren Alzheimer Disease Research Program.
DISCLOSURE
M. Raman, G. Preboske, S. Przybelski, J. Gunter, and M. Senjem report no disclosures relevant to the manuscript. P. Vemuri is funded through NIH K99 AG37573 and Alzheimer's Association New Investigator Award. M. Murphy has stock owned in Resoundant (a private company working on the development of MR elastography). M. Murray is funded by the P50-NS72187-03 (coinvestigator [Co-I]), and Robert H. and Clarice Smith and Abigail van Buren Alzheimer Disease Research Fellowship. B. Boeve has served as an investigator for clinical trials sponsored by Cephalon, Inc., Allon Pharmaceuticals, and GE Healthcare. He receives royalties from the publication of a book titled Behavioral Neurology of Dementia (Cambridge Medicine, 2009). He has received honoraria from the American Academy of Neurology. He serves on the scientific advisory board of the Tau Consortium. He receives research support from the National Institute on Aging (P50 AG16574 [Co-I], U01 AG06786 [Co-I], RO1 AG15866 [Co-I], and U24 AG26395 [Co-I]), and the Alzheimer's Association (IIRG-05-14560 [principal investigator, PI]). D. Knopman serves as deputy editor for Neurology®; serves on a data safety monitoring board for Lundbeck Pharmaceuticals and was a consultant to TauRx Pharmaceuticals; and receives research support from the NIH (R01-AG11378 [Co-I], P50 AG16574 [Co-I], and U01 AG 006786 [Co-I]). R. Petersen serves on scientific advisory boards for Elan Pharmaceuticals, Wyeth Pharmaceuticals, and GE Healthcare; receives royalties from publishing Mild Cognitive Impairment (Oxford University Press, 2003); and receives research support from the NIH (P50-AG16574 [PI] and U01-AG06786 [PI], and R01-AG11378 [Co-I]). J. Parisi receives publishing royalties for Principles & Practice of Neuropathology, 2nd ed. D. Dickson is an editorial board member of American Journal of Pathology, Annals of Neurology, Parkinsonism and Related Disorders, Journal of Neuropathology and Experimental Neurology, and Brain Pathology. He is editor-in-chief of American Journal of Neurodegenerative Disease, and International Journal of Clinical and Experimental Pathology. He receives research support from the NIH (P50 AG016574 [Co-I], P50 NS072187 [PI]) and CurePSP/Society for Progressive Supranuclear Palsy. C. Jack provides consulting services for Janssen. He receives research funding from the NIH (R01-AG011378, RO1-AG041851, RO1-AG037551, U01-HL096917, U01-AG032438, U01-AG024904), and the Alexander Family Alzheimer's Disease Research Professorship of the Mayo Foundation. K. Kantarci serves on the data safety monitoring board for Pfizer Inc., Janssen Alzheimer Immunotherapy, Takeda Global Research & Development Center, Inc.; and she is funded by the NIH (R01AG040042 [PI], Mayo Clinic Alzheimer's Disease Research Center/Project 1 P50 AG16574/P1 [PI], P50 AG44170/Project 2 [PI], and R01 AG11378 [Co-I]). Go to Neurology.org for full disclosures.
REFERENCES
- 1.Sonnen JA, Santa Cruz K, Hemmy LS, et al. Ecology of the aging human brain. Arch Neurol 2011;68:1049–1056 [DOI] [PMC free article] [PubMed] [Google Scholar]
- 2.Arvanitakis Z, Leurgans SE, Barnes LL, Bennett DA, Schneider JA. Microinfarct pathology, dementia, and cognitive systems. Stroke 2011;42:722–727 [DOI] [PMC free article] [PubMed] [Google Scholar]
- 3.Zheng L, Vinters HV, Mack WJ, Zarow C, Ellis WG, Chui HC. Cerebral atherosclerosis is associated with cystic infarcts and microinfarcts but not Alzheimer pathologic changes. Stroke 2013;44:2835–2841 [DOI] [PMC free article] [PubMed] [Google Scholar]
- 4.Launer LJ, Hughes TM, White LR. Microinfarcts, brain atrophy, and cognitive function: the Honolulu Asia Aging Study Autopsy Study. Ann Neurol 2011;70:774–780 [DOI] [PMC free article] [PubMed] [Google Scholar]
- 5.Esiri MM, Wilcock GK, Morris JH. Neuropathological assessment of the lesions of significance in vascular dementia. J Neurol Neurosurg Psychiatry 1997;63:749–753 [DOI] [PMC free article] [PubMed] [Google Scholar]
- 6.Smith EE, Schneider JA, Wardlaw JM, Greenberg SM. Cerebral microinfarcts: the invisible lesions. Lancet Neurol 2012;11:272–282 [DOI] [PMC free article] [PubMed] [Google Scholar]
- 7.Kovari E, Gold G, Herrmann FR, et al. Cortical microinfarcts and demyelination significantly affect cognition in brain aging. Stroke 2004;35:410–414 [DOI] [PubMed] [Google Scholar]
- 8.Gold G, Kovari E, Hof PR, Bouras C, Giannakopoulos P. Sorting out the clinical consequences of ischemic lesions in brain aging: a clinicopathological approach. J Neurol Sci 2007;257:17–22 [DOI] [PubMed] [Google Scholar]
- 9.Schneider JA, Boyle PA, Arvanitakis Z, Bienias JL, Bennett DA. Subcortical infarcts, Alzheimer's disease pathology, and memory function in older persons. Ann Neurol 2007;62:59–66 [DOI] [PubMed] [Google Scholar]
- 10.Sonnen JA, Larson EB, Crane PK, et al. Pathological correlates of dementia in a longitudinal, population-based sample of aging. Ann Neurol 2007;62:406–413 [DOI] [PubMed] [Google Scholar]
- 11.Longstreth WT, Jr, Sonnen JA, Koepsell TD, Kukull WA, Larson EB, Montine TJ. Associations between microinfarcts and other macroscopic vascular findings on neuropathologic examination in 2 databases. Alzheimer Dis Assoc Disord 2009;23:291–294 [DOI] [PMC free article] [PubMed] [Google Scholar]
- 12.Roberts RO, Geda YE, Knopman DS, et al. The Mayo Clinic Study of Aging: design and sampling, participation, baseline measures and sample characteristics. Neuroepidemiology 2008;30:58–69 [DOI] [PMC free article] [PubMed] [Google Scholar]
- 13.Petersen RC, Kokmen E, Tangalos E, Ivnik RJ, Kurland LT. Mayo Clinic Alzheimer's Disease Patient Registry. Aging 1990;2:408–415 [DOI] [PubMed] [Google Scholar]
- 14.Raz L, Jayachandran M, Tosakulwong N, et al. Thrombogenic microvesicles and white matter hyperintensities in postmenopausal women. Neurology 2013;80:911–918 [DOI] [PMC free article] [PubMed] [Google Scholar]
- 15.Kantarci K, Petersen RC, Przybelski SA, et al. Hippocampal volumes, proton magnetic resonance spectroscopy metabolites, and cerebrovascular disease in mild cognitive impairment subtypes. Arch Neurol 2008;65:1621–1628 [DOI] [PMC free article] [PubMed] [Google Scholar]
- 16.Gunter JL, Shiung MM, Manduca A, Jack CR., Jr Methodological considerations for measuring rates of brain atrophy. J Magn Reson Imaging 2003;18:16–24 [DOI] [PMC free article] [PubMed] [Google Scholar]
- 17.Gunter JL, Senjen ML, Vemuri P, Jack CR., Jr Comparison of mask-based differences, boundary shift integral and symmetric normalization jacobian integration. Presented at MICCAI 2012 Workshop on Novel Imaging Biomarkers for Alzheimer's Disease and Related Disorders; October 5, 2012; Nice, France; 2012
- 18.Knopman DS, Parisi JE, Salviati A, et al. Neuropathology of cognitively normal elderly. J Neuropathol Exp Neurol 2003;62:1087–1095 [DOI] [PubMed] [Google Scholar]
- 19.Mast H, Thompson JL, Lee SH, Mohr JP, Sacco RL. Hypertension and diabetes mellitus as determinants of multiple lacunar infarcts. Stroke 1995;26:30–33 [DOI] [PubMed] [Google Scholar]
- 20.Vermeer SE, Prins ND, den Heijer T, Hofman A, Koudstaal PJ, Breteler MM. Silent brain infarcts and the risk of dementia and cognitive decline. N Engl J Med 2003;348:1215–1222 [DOI] [PubMed] [Google Scholar]
- 21.Mosley TH, Jr, Knopman DS, Catellier DJ, et al. Cerebral MRI findings and cognitive functioning: the Atherosclerosis Risk in Communities Study. Neurology 2005;64:2056–2062 [DOI] [PubMed] [Google Scholar]
- 22.Kantarci K, Weigand SD, Przybelski SA, et al. MRI and MRS predictors of mild cognitive impairment in a population-based sample. Neurology 2013;81:126–133 [DOI] [PMC free article] [PubMed] [Google Scholar]
- 23.De Groot JC, De Leeuw FE, Oudkerk M, et al. Periventricular cerebral white matter lesions predict rate of cognitive decline. Ann Neurol 2002;52:335–341 [DOI] [PubMed] [Google Scholar]
- 24.Silbert LC, Nelson C, Howieson DB, Moore MM, Kaye JA. Impact of white matter hyperintensity volume progression on rate of cognitive and motor decline. Neurology 2008;71:108–113 [DOI] [PMC free article] [PubMed] [Google Scholar]
- 25.Maillard P, Carmichael O, Fletcher E, Reed B, Mungas D, DeCarli C. Coevolution of white matter hyperintensities and cognition in the elderly. Neurology 2012;79:442–448 [DOI] [PMC free article] [PubMed] [Google Scholar]
- 26.Au R, Massaro JM, Wolf PA, et al. Association of white matter hyperintensity volume with decreased cognitive functioning: the Framingham Heart Study. Arch Neurol 2006;63:246–250 [DOI] [PubMed] [Google Scholar]
- 27.Jagust WJ, Zheng L, Harvey DJ, et al. Neuropathological basis of magnetic resonance images in aging and dementia. Ann Neurol 2008;63:72–80 [DOI] [PMC free article] [PubMed] [Google Scholar]
- 28.Murray ME, Vemuri P, Preboske GM, et al. A quantitative postmortem MRI design sensitive to white matter hyperintensity differences and their relationship with underlying pathology. J Neuropathol Exp Neurol 2012;71:1113–1122 [DOI] [PMC free article] [PubMed] [Google Scholar]
- 29.Erten-Lyons D, Woltjer R, Kaye J, et al. Neuropathologic basis of white matter hyperintensity accumulation with advanced age. Neurology 2013;81:977–983 [DOI] [PMC free article] [PubMed] [Google Scholar]
- 30.Carmichael O, Mungas D, Beckett L, et al. MRI predictors of cognitive change in a diverse and carefully characterized elderly population. Neurobiol Aging 2012;33:83–95 [DOI] [PMC free article] [PubMed] [Google Scholar]
- 31.Gurol ME, Viswanathan A, Gidicsin C, et al. Cerebral amyloid angiopathy burden associated with leukoaraiosis: a positron emission tomography/magnetic resonance imaging study. Ann Neurol 2013;73:529–536 [DOI] [PMC free article] [PubMed] [Google Scholar]
- 32.DeCarli C, Mungas D, Harvey D, et al. Memory impairment, but not cerebrovascular disease, predicts progression of MCI to dementia. Neurology 2004;63:220–227 [DOI] [PMC free article] [PubMed] [Google Scholar]
- 33.Soontornniyomkij V, Lynch MD, Mermash S, et al. Cerebral microinfarcts associated with severe cerebral beta-amyloid angiopathy. Brain Pathol 2010;20:459–467 [DOI] [PMC free article] [PubMed] [Google Scholar]
- 34.Torvik A. The pathogenesis of watershed infarcts in the brain. Stroke 1984;15:221–223 [DOI] [PubMed] [Google Scholar]
- 35.Brundel M, de Bresser J, van Dillen JJ, Kappelle LJ, Biessels GJ. Cerebral microinfarcts: a systematic review of neuropathological studies. J Cereb Blood Flow Metab 2012;32:425–436 [DOI] [PMC free article] [PubMed] [Google Scholar]
- 36.Suter OC, Sunthorn T, Kraftsik R, et al. Cerebral hypoperfusion generates cortical watershed microinfarcts in Alzheimer disease. Stroke 2002;33:1986–1992 [DOI] [PubMed] [Google Scholar]
- 37.Buckner RL, Andrews-Hanna JR, Schacter DL. The brain's default network: anatomy, function, and relevance to disease. Ann NY Acad Sci 2008;1124:1–38 [DOI] [PubMed] [Google Scholar]
- 38.van den Heuvel MP, Sporns O. Rich-club organization of the human connectome. J Neurosci 2011;31:15775–15786 [DOI] [PMC free article] [PubMed] [Google Scholar]
- 39.Kantarci K, Senjem ML, Avula R, et al. Diffusion tensor imaging and cognitive function in older adults with no dementia. Neurology 2011;77:26–34 [DOI] [PMC free article] [PubMed] [Google Scholar]
- 40.Westover MB, Bianchi MT, Yang C, Schneider JA, Greenberg SM. Estimating cerebral microinfarct burden from autopsy samples. Neurology 2013;80:1365–1369 [DOI] [PMC free article] [PubMed] [Google Scholar]
Associated Data
This section collects any data citations, data availability statements, or supplementary materials included in this article.