Abstract
Background
A nutrient-wide approach may be useful comprehensively to test and validate associations between nutrients (derived from foods and supplements) and blood pressure (BP) in an unbiased manner.
Methods and Results
Data from 4,680 participants ages 40–59 in the cross-sectional International Study of Macro/Micro-nutrients and Blood Pressure (INTERMAP) were stratified randomly into training and testing sets. NHANES cross-sectional cohorts of 1999–2000 to 2005–2006 were used for external validation. We performed multiple linear regression analyses associating each of 82 nutrients and 3 urine electrolytes with systolic and diastolic BP in the INTERMAP training set. Significant findings were validated in the INTERMAP testing set and further in the NHANES cohorts (False Discovery Rate <5% in training, p<0.05 for internal and external validation). Among the validated nutrients, alcohol and urinary sodium-to-potassium ratio were directly associated with systolic BP, and dietary phosphorus, magnesium, iron, thiamin, folacin, and riboflavin were inversely associated with systolic BP. In addition, dietary folacin, and riboflavin were inversely associated with diastolic BP. The absolute effect sizes in the validation data (NHANES) ranged from 0.97 mmHg lower systolic BP (phosphorus) to 0.39 mmHg lower systolic BP (thiamin) per 1SD difference in nutrient variable. Inclusion of nutrient intake from supplements in addition to foods gave similar results for some nutrients, though it attenuated the associations of folacin, thiamin and riboflavin intake with BP.
Conclusions
We identified significant inverse associations between B vitamins and BP, relationships hitherto poorly investigated. Our analyses represent a systematic unbiased approach to the evaluation and validation of nutrient-BP associations.
Keywords: lood pressure, diet, epidemiology, nutrition
Dietary habits have long been related to complex diseases such as cancer and cardiovascular diseases, but the role of many nutrients and food groups in disease merits further investigation despite intensive research efforts.1–3 Epidemiological studies often test associations of single nutrients with disease or examine food patterns, e.g., the Mediterranean diet, which are often difficult to characterize. Recently, a study design analogous to genome wide association studies (GWAS), the “environment-wide association study” (EWAS), has been proposed to search for and analytically validate environmental factors associated with complex diseases.4,5 Instead of testing one only or a few associations at a time, EWAS evaluates multiple environmental factors for association, with proper adjustment for multiplicity of comparisons. The emerging significant associations are then validated across different datasets as is commonly done in GWAS.4,5
Here, we extend the EWAS approach to evaluate multiple associations between a wide range of nutrients and blood pressure (BP). We used data from the population-based INTERnational Collaborative Study on Macro-/Micronutrients and Blood Pressure (INTERMAP) and subsequently systematically validated our findings using independent datasets from the U.S. National Health and Nutrition Examination Survey (NHANES).
Methods
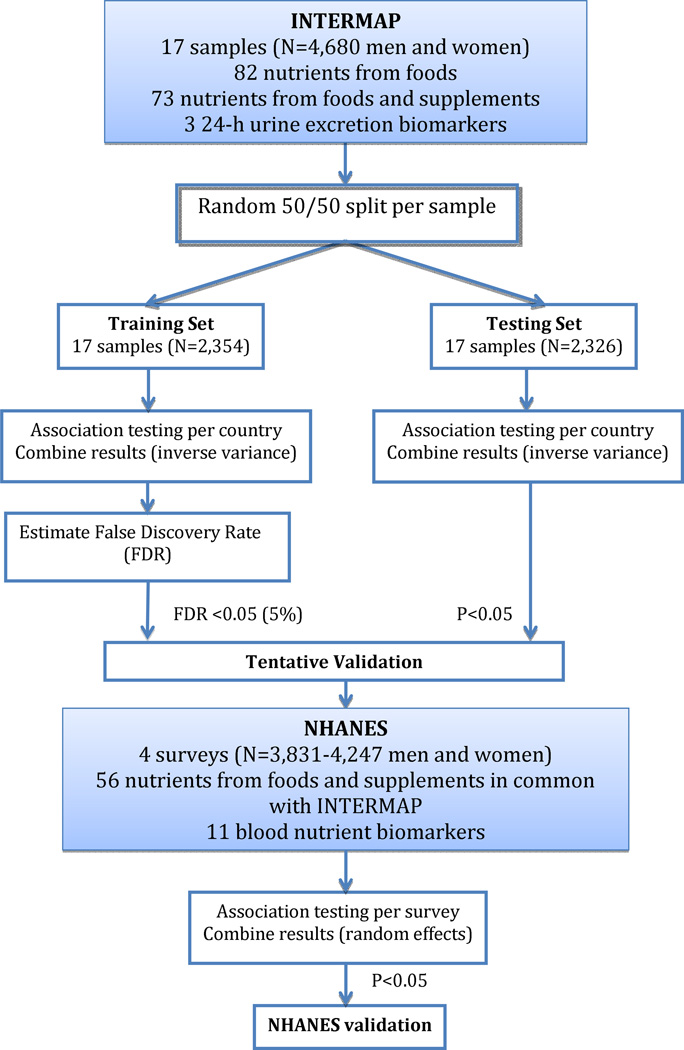
The analytical procedure is summarized in Figure 1.
Figure 1.
Procedure to systematically associate nutrients with blood pressure
INTERMAP
INTERMAP methods have been described in detail.6 This cross-sectional study consists of 4,680 individuals (2,359 men and 2,321 women) ages 40–59 from 17 population samples - - Japan (4 samples), the People’s Republic of China (n=3), the United Kingdom (n=2), and the United States (n=8). Participants attended the research clinic four times with two consecutive visits, a gap averaging 3 weeks, and two more consecutive visits. Blood pressure, seated, was measured at each visit twice with a random zero sphygmomanometer.
An in-depth interview administered multipass 24-hour diet recall at each of the 4 visits. We recorded all foods and drinks, including supplements, consumed in the previous 24 hours. Two timed 24-h urine collections were done to measure a range of analytes including 24-h urinary sodium, potassium, calcium and magnesium. At two visits height and weight were measured and questionnaire data were obtained on daily alcohol intake over the past seven days and on possible confounders. Quality control measures were extensive.6 Participants gave written informed consent.
We did a random 50:50 split of each of the INTERMAP population samples, one half for training (N=2,354) and the other for testing (N=2,326).
NHANES
NHANES is a cross-sectional, biannual, representative health survey of the United States population.7 We used data from four surveys (1999–2000, 2001–2002, 2003–2004, and 2005–2006). For a proportion of individuals (N=3831–4247 per survey) one (in person, 1999–2000 and 2001–2002 surveys) or two (one in person and one by telephone; 2003–2004 and 2005–2006 surveys) 24-hour food recall questionnaires were administered using the United States Department of Agriculture (USDA) and US Department of Health and Human Services (DHHS) food recall questionnaires. Self-reported data were also collected for supplement intake, diabetes or cardiovascular disease status, family history of hypertension, and fitness level coded as metabolic equivalent of task (MET).8 Height, weight, and 3 to 4 seated systolic and diastolic BP measurements were also administered.
Statistical analyses
INTERMAP
Measurements per person were averaged, for BP and nutrients, across the 4 visits; for urinary excretions, across the 2 collections. We calculated nutrient intakes from foods only and from foods plus supplements. For nutrients from foods, we systematically screened for associations of 82 nutrients and 3 urinary electrolytes/electrolyte ratio with systolic and diastolic BP using linear regression models adjusted for: age, sex, reported special diet, use of dietary supplements, moderate or heavy physical activity (hours daily), doctor diagnosed cardiovascular disease or diabetes, family history of hypertension, height, weight and total energy intake. We also examined the associations with systolic and diastolic BP of 73 nutrients derived from both foods and supplements using the same models. We fitted each model per country and combined coefficients across countries weighted by inverse of their variance. Cross-country heterogeneity measures were computed using the I2 statistic (proportion of between-survey over the sum of between-survey and within-survey variance).9
We estimated the false discovery rate to account for multiple comparisons using the training set, and we tentatively validated the most significant associations (defined as those with FDR <5%) in the INTERMAP testing set (p<0.05) (Figure 1). The false discovery rate is the ratio of the number of false positive to total number of positive associations, or the percentage of findings that are drawn from the null distribution at a given significance level.10 We use an analytic method to compute the FDR that estimates the expected number of false positive results through permutations of the dataset and the number of total positive results by the number of dietary variables found to be significant at a specified level of significance. The procedure is as follows:
In the training cohort:
Screen for all dietary variables (82 nutrients and 3 urinary electrolytes/electrolyte ratio) associated with BP and collect all p-values corresponding to the coefficient of each dietary variable. Briefly, for each dietary variable, model systolic or diastolic blood pressure as a function of the dietary variable and the other covariates included in the regression models. Then, compute the pooled per-center coefficients and p-values. Call these p-values Preal.
Permute the phenotype per country, and re-do 1.) and collect p-values.
Do 2.) 1000 times. The set of p-values collected from 2.) and 3.) is Pnull.
Estimate the FDR for a given significance level. For example, for 0.05: FDR(0.05) = ((#Pnull < 0.05) / 1000) / (#Preal < 0.05).
For tentatively validated nutrients (FDR <5% in the training set, p <0.05 in the testing set), we performed a sensitivity analysis excluding individuals on special diet and recalculating coefficients as mentioned above.
We estimated statistical power to detect effects observed in this study. We assumed that variance of BP explained by the dietary variables ranged from 0.1–2% after adjustment for covariates documented above. At FDR less than 5%, we concluded that power was low to moderate (20–80%; see online supplementary Figure 1).11
We also performed multivariable analysis fitting a linear regression model in the INTERMAP training set using all dietary variables that achieved FDR <5%, adjusting for all covariates, as previously documented. We then used a stepwise method based on Akaike Information Criterion (AIC) to select dietary variables from this larger set using the INTERMAP training data and the ‘step’ function in R.12
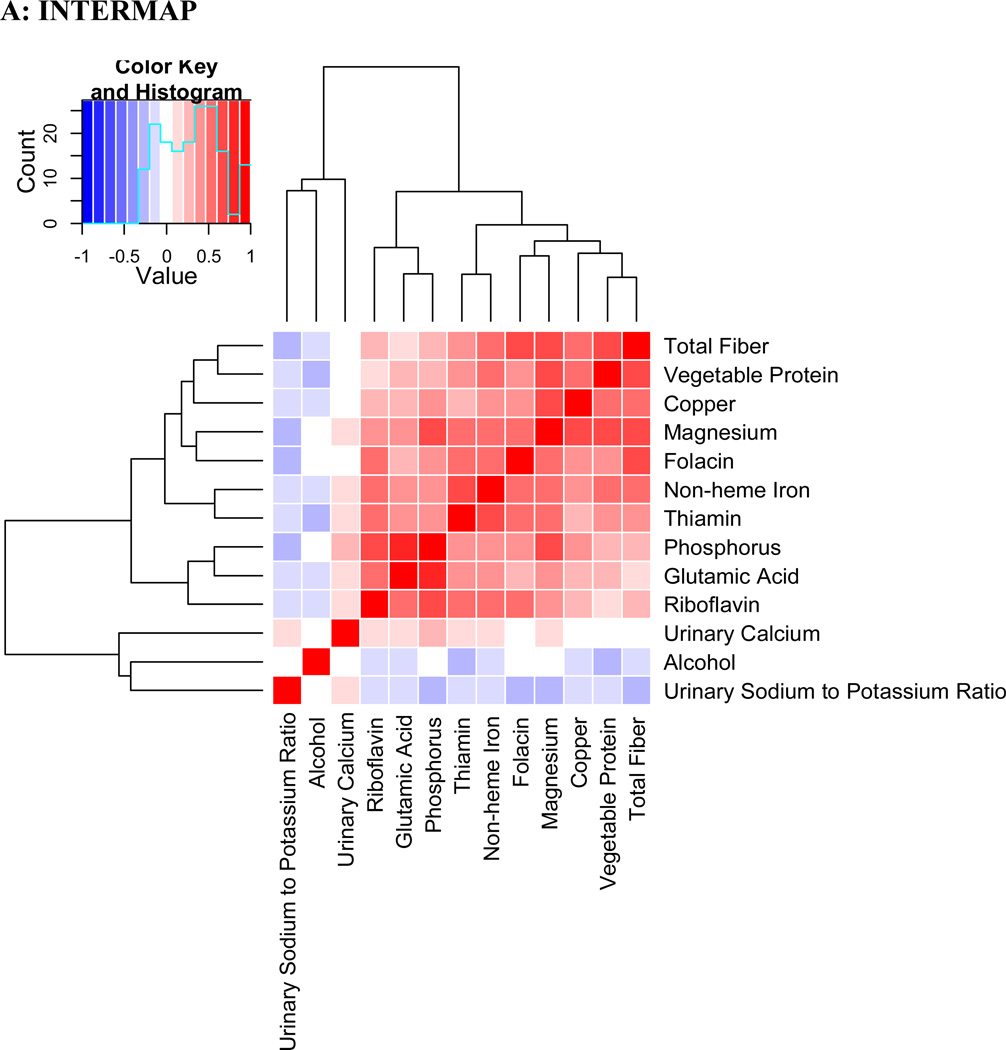
Pearson correlation coefficients (adjusted for age, sex and sample) were calculated for nutrients and visualized with a heatmap where variables are arranged using a hierarchical clustering algorithm.13 The larger the correlation between a pair of variables, the closer in proximity they appear in the heatmap.
NHANES
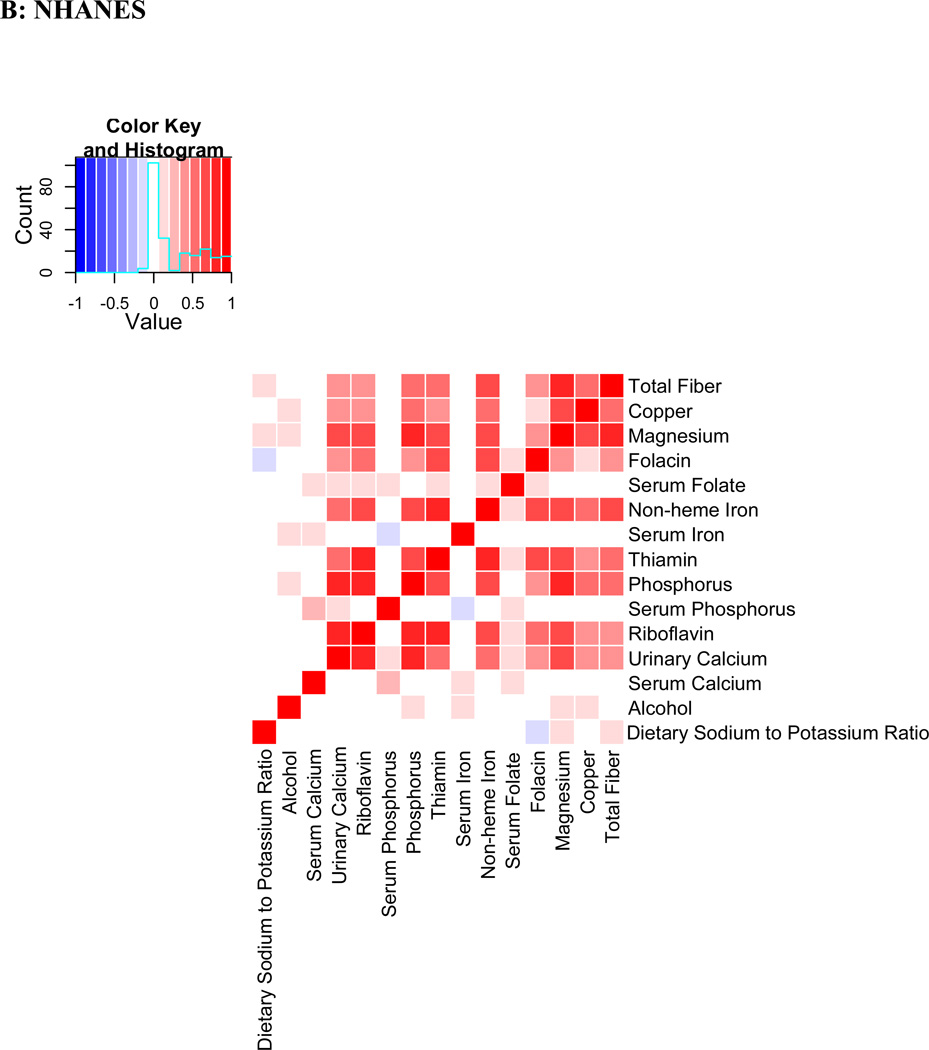
We then attempted to validate in NHANES dietary variables tentatively identified as related to BP in INTERMAP, and having a corresponding, similar measurement in NHANES. For each tentatively validated dietary variable, we fitted a per-NHANES survey linear model estimating systolic or diastolic blood pressure as a function of the dietary variable adjusted for a comparable set of confounders: age, sex, ethnicity, diabetes, physical activity, total energy intake, use of dietary supplements, family history of CVD, height and weight. Information on special diet was not available in NHANES. Where two data values were available for nutrient intake (2003–2004 and 2005–2006 surveys), the mean value was used for analysis. Similarly, the mean of the blood pressure values (3 to 4 measurements) was used for analysis. We computed an overall estimate of nutrient-BP associations by combining coefficients from each survey using a random-effects meta-analytic method.14 Heterogeneity measures were computed using the I2 statistic.9 A heatmap with correlation coefficients was plotted between nutrients using the same clustering as in INTERMAP to allow comparability of results between the two cohorts.
All analyses were performed using the R project software.15
Results
INTERMAP
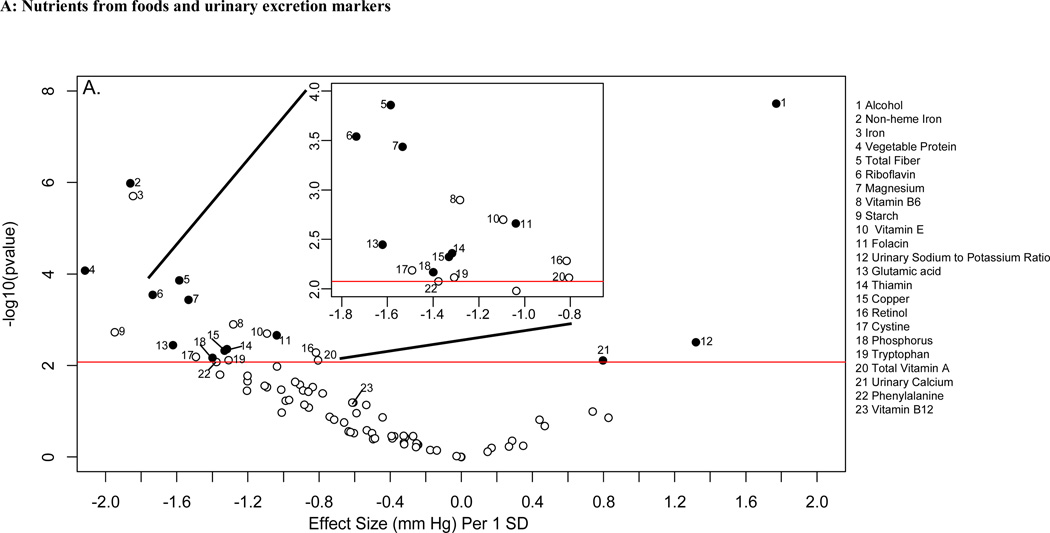
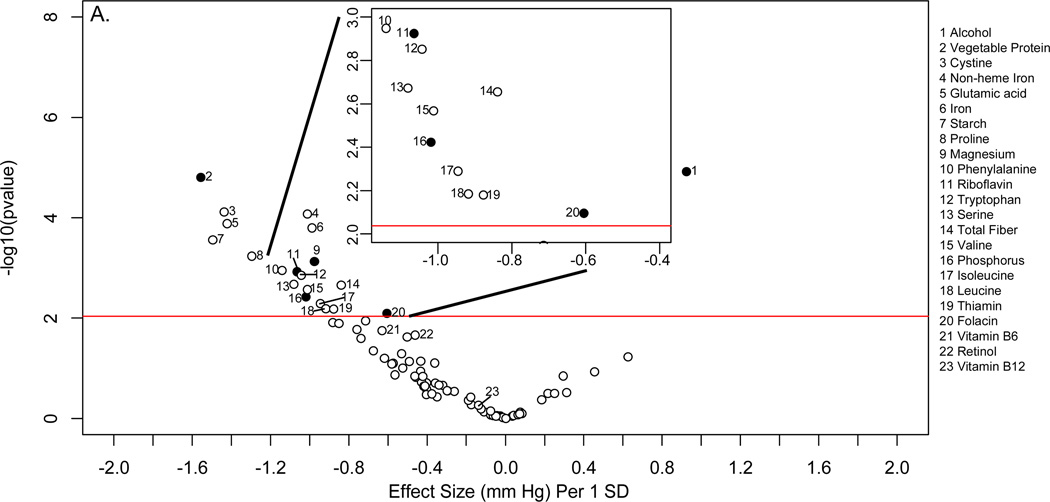
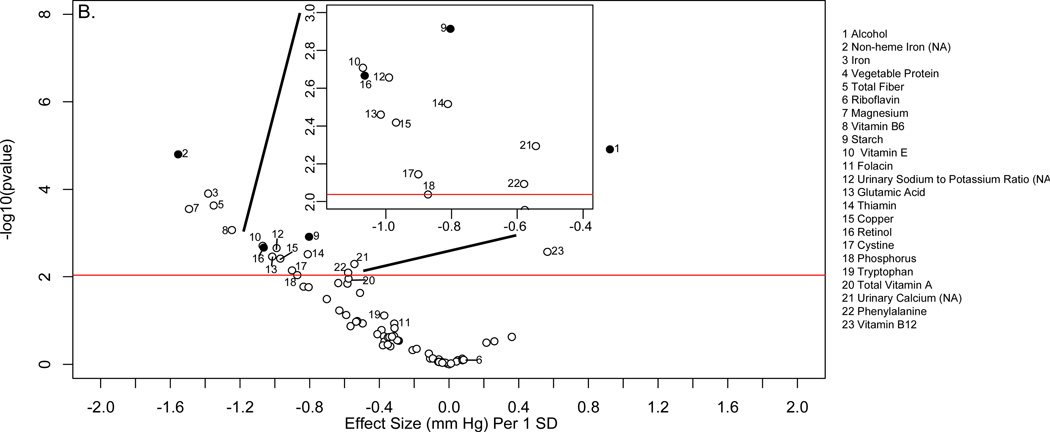
Descriptive characteristics of the INTERMAP and NHANES populations are shown in online supplementary Tables 1 and 2. Figure 2 shows the distribution of p values and effect sizes for association with systolic and diastolic BP of nutrients and urinary electrolytes in the training INTERMAP population set (a “volcano plot”). Twenty nutrients and two urinary variables were significantly associated with systolic BP (FDR <5%); 13 of them (11 nutrients and 2 urinary variables) were tentatively validated (p<0.05) in the INTERMAP testing dataset. These comprised positive associations with alcohol intake, 24-h urinary sodium-to-potassium excretion ratio and 24-h urinary calcium, and inverse associations with non-heme iron, vegetable protein, fiber, magnesium, phosphorus, riboflavin, folacin (folic acid), glutamic acid, thiamin, and copper (Figure 2A; Table 1). For diastolic BP, 6 factors were tentatively validated (Figure 3A; Table 2). Sensitivity analysis excluding individuals on special diet showed qualitatively similar results (online supplementary Table 3).
Figure 2.
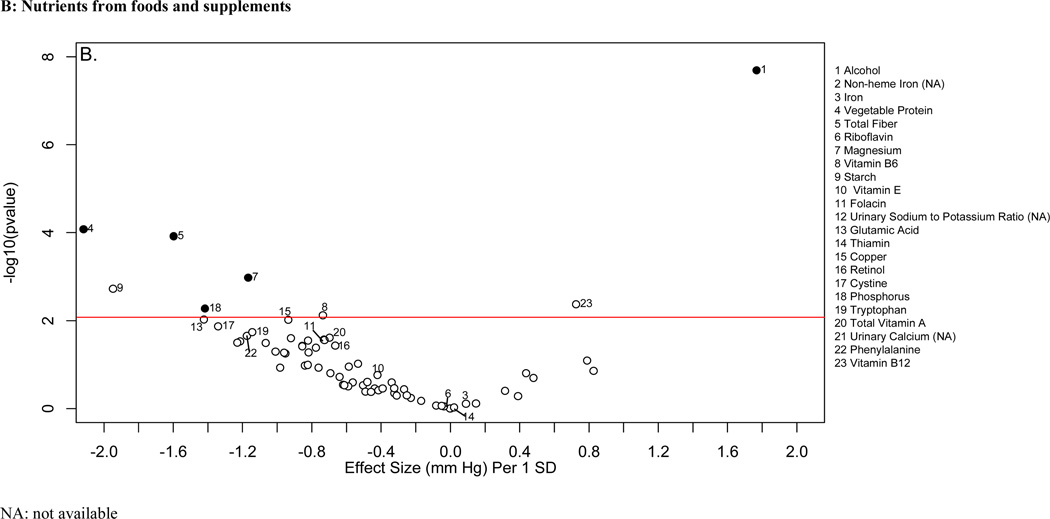
“Volcano plot” graphic showing the nutrient-wide associations with systolic blood pressure levels in INTERMAP training set for nutrients received from foods and urine excretion markers (A) and for nutrients received from foods and supplements (B) Y-axis indicates -log10(p-value) of the adjusted linear regression coefficient for each of the nutrients. Horizontal line represents the level of significance corresponding to FDR less than 5% and the x axis shows the effect sizes (mmHg) per 1SD change in the nutrient variable. Filled marks represent tentatively validated nutrients in the INTERMAP testing set (p<0.05). Analyses are adjusted for age, sex, reported special diet, use of dietary supplements, moderate or heavy physical activity (hours daily), doctor diagnosed cardiovascular disease or diabetes, family history of hypertension, height, weight and total energy intake,.
Table 1.
Adjusted estimated differences in systolic blood pressure associated with nutrients higher by 1SD in training, testing and external validation sets. Only variables that were tentatively validated in INTERMAP testing set are shown
| INTERMAP Training set | INTERMAP Testing set | NHANES External validation* | ||||
|---|---|---|---|---|---|---|
| Dietary variable | Difference -- mmHg | p value/ | Difference -- mmHg | p value | Difference -- mmHg | p value |
| (95% CI) | FDR+ % | (95% CI) | (95% CI) | |||
| Nutrient from foods | ||||||
| Alcohol | 1.77 (1.15,2.39) | 2*10−8/0.01 | 1.69 (1.07,2.30) | 7*10−8 | 0.84 (0.43,1.2) | 5*10−5 |
| Vegetable Protein | −2.12 (−3.17,−1.06) | 8*10−5/0.2 | −1.85 (−2.92,−0.77) | 7*10−4 | NA | NA |
| Riboflavin | −1.74 (−2.67,−0.780) | 3*10−4/0.5 | −1.51 (−2.44,−0.58) | 0.001 | −0.89 (−1.5,−0.28) | 0.004 |
| Non-heme ironc | −1.86 (−2.61,−1.11) | 1*10−6/0.01 | −0.81 (−1.59,−0.03) | 0.04 | −0.51 (−0.92,−0.09) | 0.02 |
| Total Fiber | −1.59 (−2.4,−0.77) | 1*10−4/0.3 | −1.04 (−1.83,−0.25) | 0.009 | −0.66 (−1.5,0.16) | 0.1 |
| Thiamin | −1.32 (−2.22,−0.41) | 0.004/4 | −0.86 (−1.6,−0.13) | 0.02 | −0.39 (−0.76,−0.02) | 0.04 |
| Glutamic acid | −1.62 (−2.71,−0.53) | 0.004/4 | −1.21 (−2.26,−0.15) | 0.03 | NA | NA |
| Magnesium | −1.53 (−2.38,−0.69) | 4*10−4/0.6 | −1.64 (−2.48,−0.80) | 1*10−4 | −0.97 (−1.9,0.002) | 0.05 |
| Phosphorus | −1.40 (−2.41,−0.39) | 0.007/5 | −2.06 (−3.05,−1.07) | 5*10−5 | −0.97 (−1.9,−0.07) | 0.03 |
| Copper | −1.33 (−2.26,−0.41) | 0.005/4 | −1.18 (−2.16,−0.19) | 0.02 | −0.19 (−0.57,0.19) | 0.3 |
| Folacin | −1.04 (−1.7,−0.37) | 0.002/2 | −1.12 (−1.77,−0.47) | 8*10−4 | −0.4 (−0.68,−0.13) | 0.004 |
| Urinary excretion | ||||||
| Calcium | 0.79 (0.21, 1.37) | 0.008/5 | 0.97 (0.39, 1.55) | 0.001 | NA | NA |
| Sodium to potassium ratioc | 1.31 (0.44, 2.18) | 0.003/3 | 1.96 (1.05, 0.35) | 2*10−5 | 0.61 (−0.11,1.3) | 0.1 |
| Nutrient from foods and supplements | ||||||
| Alcohol | 1.77 (1.15,2.39) | 2*10−8/0.01 | 1.68 (1.07,2.3) | 7*10−8 | - | - |
| Vegetable Protein | −2.12 (−3.17,−1.06) | 8*10−4/0.2 | −1.85 (−2.92,−0.77) | 7*10−4 | - | - |
| Total Fiber | −1.60 (−2.41,−0.78) | 1*10−4/0.3 | −1.06 (−1.85,−0.27) | 0.008 | −0.69 (−1.5,0.08) | 0.08 |
| Phosphorus | −1.42 (−2.41,−0.42) | 0.005/4 | −1.93 (−2.91,−0.95) | 1*10−4 | −0.81 (−1.8,0.22) | 0.1 |
| Magnesium | −1.17 (−1.87,−0.47) | 0.001/2 | −0.99 (−1.72,−0.26) | 0.008 | −0.74 (−1.7,0.18) | 0.1 |
Analyses are adjusted for age, sex, reported special diet, use of dietary supplements, moderate or heavy physical activity (hours daily), doctor diagnosed cardiovascular disease and diabetes, family history of hypertension, height, weight and total energy intake (INTERMAP) and age, sex, ethnicity, diabetes, physical activity, total energy intake, supplement intake, family history of CVD, height and weight (NHANES)
Variables that were not available in NHANES (e.g. vegetable protein) were not tested. NA: not available
FDR: False discovery rate %
Non-heme iron was not available in NHANES; total dietary iron and serum iron were used as proxy. Urinary sodium-to-potassium ratio was not available in NHANES; dietary sodium-to-potassium was used as proxy.
The SDs for each variable are listed in online supplementary Table 1.
Figure 3.
“Volcano plot” graphic showing the nutrient-wide associations with diastolic blood pressure levels in INTERMAP training set for nutrient received from foods and urine excretion markers (A) and for nutrients received for foods and supplements (B) Y-axis indicates −log10(p-value) of the adjusted linear regression coefficient for each of the nutrients. Horizontal line represents the level of significance corresponding to FDR less than 5% and the x axis shows the effect sizes (mm Hg) per 1SD change in the nutrient variable. Filled marks represent tentatively validated nutrients in the INTERMAP testing set (p < 0.05). Analyses are adjusted for age, sex, reported special diet, use of dietary supplements, moderate or heavy physical activity (hours daily), doctor diagnosed cardiovascular disease or diabetes, family history of hypertension, height, weight and total energy intake.
Table 2.
Adjusted estimated differences in diastolic blood pressure associated with nutrients higher by 1SD in training, testing and external validation sets. Only variables that were tentatively validated in INTERMAP testing set are shown
| INTERMAP Training set | INTERMAP Testing set | NHANES External validation* | ||||
|---|---|---|---|---|---|---|
| Dietary variable | Difference | p value/ | Difference | p value | Difference | p value |
| (95% CI) | FDR† % | (95% CI) | (95% CI) | |||
| Nutrients from foods | ||||||
| Alcohol | 0.92 (0.51,1.34) | 1*10−5/0.2 | 0.98 (0.564,1.41) | 4*10−6 | 0.04 (−0.26,0.34) | 0.8 |
| Vegetable Protein | −1.56 (−2.26,−0.85) | 2*10−5/0.2 | −0.94 (−1.67,−0.21) | 0.01 | NA | |
| Riboflavin | −1.06 (−1.71,−0.42) | 0.001/0.01 | −0.81 (−1.45,−0.17) | 0.005 | −0.34 (−0.64,−0.04) | 0.003 |
| Phosphorus | −1.02 (−1.71,−0.33) | 0.003/2 | −1.09 (−1.78,−0.41) | 0.002 | −0.48 (−1.22,0.26) | 0.2 |
| Magnesium | −0.98 (−1.54,−0.41) | 7*10−4/1 | −0.81 (−1.39,−0.24) | 0.005 | −0.34 (−1.18,0.50) | 0.4 |
| Folacin | −0.62 (−1.05,−0.16) | 0.008/4 | −0.57 (−1.02,−0.12) | 0.01 | −0.52 (−0.95,−0.08) | 0.02 |
| Nutrient from foods and supplements | ||||||
| Alcohol | 0.92 (0.51,1.34) | 1*10−5/0.2 | 0.98 (0.56,1.4) | 4*10−6 | - | - |
| Vegetable Protein | −1.56 (−2.26,−0.85) | 1*10−5/0.2 | −0.94 (−1.68,−0.21) | 0.01 | - | - |
| Phosphorus | −1.06 (−1.74,−0.39) | 0.002/2 | −1.03 (−1.71,−0.36) | 0.003 | −0.33 (−1.13,0.48) | 0.4 |
| Magnesium | −0.80 (−1.29, −0.32) | 0.001/1 | −0.52 (−1.02, −0.01) | 0.04 | −0.08 (−0.89,0.72) | 0.8 |
Analyses are adjusted for age, sex, reported special diet, use of dietary supplements, moderate or heavy physical activity (hours daily), doctor diagnosed cardiovascular disease and diabetes, family history of hypertension, height, weight and total energy intake (INTERMAP) and age, sex, ethnicity, diabetes, physical activity, total energy intake, supplement intake, family history of CVD, height and weight (NHANES)
Variables that were not available in NHANES (e.g. vegetable protein) were not tested. NA: not available
FDR: False discovery rate %
The SDs for each variable are listed in the Online supplementary Table 1.
To ascertain independent effects, we fitted multivariable models considering multiple nutrients and potential confounders described above. Using the INTERMAP training data, we first fitted a multivariable model with all variables that were significant (FDR <5%) in our systematic scan (Figures 2 and 3). Second, again with the INTERMAP training data, we chose the nutrients which best predicted BP using the AIC selection criteria. Third, we assessed the AIC-selected model in the INTERMAP test dataset. For systolic BP, 30 dietary variables along with 10 potential confounders documented above, entered the initial model. Of these 30, 11 were selected by the AIC criterion. In the INTERMAP test dataset, only 3 of these 11 were nominally significant (p < 0.05): alcohol, urinary calcium, and urinary sodium-to-potassium ratio (online supplementary Table 4). For diastolic BP, 40 dietary or supplement variables entered the initial model, and 10 were selected by AIC (online supplementary Table 4). In the INTERMAP test dataset, only alcohol intake retained nominal significance. Thus, while we have evidence pointing to some independent effects of nutrients for systolic BP, multivariable estimates were attenuated or lost significance compared to their main effects documented above (Figures 2 and 3).
The absolute effect sizes (INTERMAP testing set) ranged from 2.06 mmHg lower systolic BP (phosphorus) to 0.81 mmHg lower systolic BP (non-heme iron) per 1SD difference in nutrient variable. The effect sizes between the INTERMAP training set and testing set were not systematically different (5 estimates were higher and 8 were lower for systolic BP). The effect sizes between nutrients obtained from foods or from food and supplements combined were similar in some cases, (e.g., phosphorus, magnesium, fiber, Tables 1 and 2), though for some tentatively validated nutrients from foods (e.g., folacin, riboflavin and thiamin), effect sizes incorporating supplemental and food intake were attenuated and no longer reached the FDR 5% threshold (FDR 10%, 94% and 97% for folacin, riboflavin and thiamin respectively for systolic BP (Figures 2B and 3B).
NHANES
Tables 1 and 2 show the associations between the tentatively validated dietary factors with systolic BP and diastolic BP across the NHANES cohorts. Data on 5 tentatively validated variables (vegetable protein, non-heme iron, glutamic acid, 24-h urinary calcium, and 24-h urinary sodium-to-potassium ratio) were not available in NHANES; thus external validation for those was not possible. We used dietary sodium-to-potassium ratio and total iron as proxies for the urinary sodium-to-potassium ratio and non-heme iron respectively. We also tested serum iron, phosphorus, and folacin as serum biomarkers of these nutrients; serum biomarkers were not available in INTERMAP. Associations of systolic BP with dietary alcohol, magnesium, phosphorus, iron, folacin, riboflavin, and thiamin were externally validated (p<0.05 for random effects estimate across 4 cohorts) in NHANES analyses adjusted for similar confounders as in INTERMAP (Table 1). Results for B vitamins (riboflavin, folacin) were externally validated also for diastolic BP (Table 2). The absolute effect sizes in the validation data (NHANES) ranged from 0.97 mmHg lower systolic BP (phosphorus) to 0.39 mmHg lower systolic BP (thiamin) per 1SD difference in nutrient variable. Heterogeneity across cohorts was low or modest for most analyses with only fiber and magnesium showing high heterogeneity across cohorts (I2 =78%) (online supplementary Tables 5, 6, and 7). Effect sizes were attenuated in the external validation sets, sometimes substantially. Among the 10 dietary variables that were assessed in both INTERMAP and NHANES for associations with systolic BP, the geometric mean of the absolute value of the coefficients was 1.49 mmHg in the INTERMAP training set, 1.39 mmHg in the INTERMAP testing set, and 0.64 mmHg in NHANES.
Serum markers of dietary intake showed results in the same direction of association as for dietary variables; in some cases, the strength of association was attenuated. Phosphorus and folacin higher by 1SD were associated with −0.32 mmHg (95%CI: −0.74 to −0.10, p=0.04) and −0.20 mmHg (− 0.61 to 0.23, 0.4) differences in systolic BP, and −0.38 mmHg (−0.70 to −0.07, 0.02) and −0.61 mmHg (−0.97 to −0.25, 0.001) differences in diastolic BP respectively; while 1SD higher serum iron showed non-statistically significant associations with systolic BP (−0.03 mmHg (−0.38 to 0.45), p=0.9).
Correlation patterns
Evaluation of Pearson correlations showed a dense correlation pattern for many validated nutrients (Figure 4). Fiber, copper, magnesium and folacin appear in close proximity in the correlation heatmap with correlation coefficients >0.5 in the INTERMAP population. In NHANES, similar patterns were observed. Correlation between the same nutrients in INTERMAP and NHANES population samples showed substantial agreement (correlation coefficient ρ=0.81).
Figure 4.
Pearson coefficient correlation heatmap showing all nutrients and potential confounders examined in a) INTERMAP total population and b) NHANES total population Nutrients are clustered according to a hierarchical clustering algorithm in INTERMAP, grouping highly correlated factors closer to one another. For NHANES the clustering of INTERMAP samples has been used. Correlation coefficients are adjusted for age, sex and sample (INTERMAP)/ cohort (NHANES).
Discussion
Using a systematic nutrient-wide association study (NWAS) approach, we identified and validated inverse associations between BP and intake of B vitamins (folacin, riboflavin and thiamin) previously poorly studied or unconfirmed, as well as previously established direct associations of sodium-to-potassium ratio and alcohol with BP. Non-heme iron, phosphorus, and magnesium intake also showed inverse associations with systolic BP, as previously reported.16–18
Our results allow interesting comparisons with recent large-scale GWAS meta-analyses on BP.19,20 Effect sizes of individual validated nutrients in our study are considerably larger than those reported per allele increase ─ in e.g., largest GWAS meta-analyses effect sizes ranged between 0.31 to 1.1 mmHg per allele copy for SBP.20 Notably, the genetic risk score of 29 genes was associated with 1.64 mmHg higher SBP per SD of the genetic risk score,20 an effect size similar to that found for several individual validated nutrients in the present study. In addition, some of the nutrients validated in our study are relevant to genetic variants discovered from GWAS meta-analyses. For example, we have shown that iron intake is positively associated with systolic BP, and GWAS studies have identified a low penetrance allele in the HFE locus for hereditary hemochromatosis, a condition characterized by excessive intestinal absorption of dietary iron. Similarly, polymorphisms in the MTHFR gene, encoding an enzyme involved in homocysteine metabolism, have been reported to be associated with BP in GWAS.20 Homocysteine levels are associated with intake of B-vitamins;21 here we validated associations between the B vitamins folate, riboflavin, and thiamin with systolic BP.
Few data have hitherto been available on relationships of B vitamins with BP. Higher total folate intake was associated with a decreased risk of incident hypertension in the large Nurses Health Study.22 Riboflavin is a cofactor for MTHFR and there is some evidence for interaction among riboflavin status, folacin status, and genotype in determining plasma homocysteine.23, 24 Thiamin has been little studied in relation to BP;22 a small randomized controlled trial reported lower BP levels after thiamin supplementation,25 and higher BP has been reported in individuals with beriberi (thiamin deficiency).26 However, the fact that intake of the B vitamins from foods and supplements was not associated with BP in the INTERMAP data, in contrast to intake from foods only may argue against a causal role; effects of other possibly causal nutrients may be embedded in the dense correlation pattern of these dietary factors. Moreover, the B vitamin associations did not retain nominal significance in the multivariable models for either systolic or diastolic BP in the INTERMAP test data. Nonetheless, at least for folacin and diastolic BP, results were also replicated in NHANES based on the serum biomarker, which reflects both dietary and supplemental intakes.
The NWAS approach presented has advantages. Efforts to associate single nutrients with disease risk are susceptible to selection effects, and may create spurious claims of association.27–29 Small effects such as those reported here on BP are especially susceptible to bias.30, 31 The systematic evaluation of multiple nutrients with proper adjustment for multiplicity of comparisons overcomes the limitation of selective reporting, while internal and external independent validation of results adds to the robustness of the associations.31 However, many of the identified associations pertain to nutrients that are strongly correlated and thus their independent effects are difficult to decipher. Moreover, etiologic interpretation of results requires consideration of prior evidence (observational or experimental) and further prospective validation of novel identified associations. Finally, while the focus of this study is on diet and BP, the methodology described is more generally applicable to a wide range of exposures and cardiovascular, metabolic or other phenotypes.4,5
Our work has limitations. First, while we propose here a systematic approach that can give a list of BP correlates with strong statistical support, further scrutiny to assess which among them are most important requires other designs, e.g., causal inference modeling and randomized trials. In addition, further studies are required to investigate the effect of other potential confounders, since associations between BP and some nutrients may require adjustment for different or additional confounders – our approach used the same set of covariates for all dietary variables. Second, some associations may have been missed due to limited statistical power. Third, the available confounders and nutrient measurements in INTERMAP and NHANES were not identical though the overlap in definitions and availability of measurements was high. Standardization of datasets is a key aspect for attention for future efforts to validate nutritional and other associations across multiple studies. Fourth, the associations reflect cross-sectional analyses, limiting the ability to make causal interpretations. Fifth, the associations that we identified were substantially smaller in NHANES. This may have to do both with precision of measurements (generally much higher in INTERMAP where four in-depth 24-h recall data were available rather than one or two 24-h dietary recalls in NHANES), but may also reflect the shrinkage of effects anticipated with external validation. Some of the serum biomarkers used, such as phosphorus, are imperfect biomarkers of dietary intake and may reflect physiologic differences between individuals as well as differences in dietary intake of nutrients. Finally, despite the comprehensive adjustment for confounders in our analyses, we cannot exclude the possibility of residual confounding by related dietary or other variables.
Despite these caveats, our systematic evaluation provides new knowledge on the complex array of nutritional correlates of systolic and diastolic BP. The complex pattern highlights why traditional approaches of testing one association at a time may be suboptimal compared to an inclusive NWAS paradigm. Some of the identified correlates may represent potentially causative associations; these need to be probed in further observational and interventional studies.
Supplementary Material
Potential clinical impact and perspective.
Raised blood pressure (BP) is a major risk factor for coronary heart disease and stroke. Risk increases in graded fashion across the BP range, with substantial risk of death and disability attributed to raised BP at normal and high-normal BPs, below current treatment thresholds. Thus non-pharmacologic as well as pharmacologic approaches are needed to deal with the population-wide BP problem. Dietary habits are known to be related to high BP, but the role of many nutrients is unclear despite intensive research efforts. We used a nutrient-wide association study (NWAS) design to systematically test and validate multiple associations between a wide range of nutrients and BP. We initially tested associations of 82 nutrients and 3 urine electrolytes/electrolyte ratios with BP in a 50% random sample of the population-based study, the International study of Micro-/macro-nutrients And Blood Pressure (INTERMAP). Significant findings were validated in the remainder 50% INTERMAP population and among participants in the National Health and Nutrition Examination Survey (NHANES). We identified inverse associations between BP and intake of B vitamins (folacin, riboflavin, thiamin) previously poorly studied, and re-identified sodium-to-potassium ratio and alcohol with BP (direct), and non-heme iron, phosphorus, and magnesium intake with systolic BP (inverse). Our results highlight a complex array of nutritional correlates with BP and emphasize why traditional approaches of testing one association at a time may be suboptimal compared to our inclusive NWAS paradigm. Findings for BP and B vitamins may represent potentially causative associations, which need to be probed in further observational and interventional studies.
Acknowledgements
It is a pleasure to express appreciation to all of the INTERMAP staff at local, national, and international centers for their invaluable efforts; a partial listing of these colleagues is given in Reference 6 of this article.
Funding sources
The International Collaborative Study of Macronutrients, Micronutrients, and Blood Pressure (INTERMAP) Study is supported by grants R01 HL65461, R01 HL50490 and R01 HL084228 from the National Heart, Lung, and Blood Institute, National Institutes of Health and by the National Institutes of Health Office on Dietary Supplements (Bethesda, Maryland, USA); also by national agencies in Japan (the Ministry of Education, Science, Sports, and Culture, Grant-in-Aid for Scientific Research [A]. No. 090357003), PRC, and the UK (project rant from the West Midlands National Health Service Research and Development, and grant R2019EPH from the Chest, Heart and Stroke Association, Northern Ireland).
P.E acknowledges support from the National Institute for Health Research (NIHR) Biomedical Research Centre at Imperial College Healthcare NHS Trust and Imperial College. P.E. is an NIHR Senior Investigator. The views expressed are those of the authors and not necessarily those of the NHS, the NIHR or the Department of Health.
Footnotes
Publisher's Disclaimer: This is a PDF file of an unedited manuscript that has been accepted for publication. As a service to our customers we are providing this early version of the manuscript. The manuscript will undergo copyediting, typesetting, and review of the resulting proof before it is published in its final citable form. Please note that during the production process errors may be discovered which could affect the content, and all legal disclaimers that apply to the journal pertain.
Disclosures
None.
Reference List
- 1.American Diabetes Association. Nutrition Recommendations and Interventions for Diabetes. Diabetes Care. 2008;31:S61–S78. doi: 10.2337/dc08-S061. [DOI] [PubMed] [Google Scholar]
- 2.Kushi LH, Doyle C, McCullough M, Rock CL, Demark-Wahnefried W, Bandera EV, Gapstur S, Patel AV, Andrews K, Gansler T. American Cancer Society 2010 Nutrition and Physical Activity Guidelines Advisory Committee. American Cancer Society Guidelines on nutrition and physical activity for cancer prevention: reducing the risk of cancer with healthy food choices and physical activity. CA Cancer J Clin. 2012;62:30–67. doi: 10.3322/caac.20140. [DOI] [PubMed] [Google Scholar]
- 3.American Heart Association Nutrition Committee. Lichtenstein AH, Appel LJ, Brands M, Carnethon M, Daniels S, Franch HA, Franklin B, Kris-Etherton P, Harris WS, Howard B, Karanja N, Lefevre M, Rudel L, Sacks F, Van Horn L, Winston M, Wylie-Rosett J. Diet and lifestyle recommendations revision 2006: a scientific statement from the American Heart Association Nutrition Committee. Circulation. 2006;114:82–96. doi: 10.1161/CIRCULATIONAHA.106.176158. [DOI] [PubMed] [Google Scholar]
- 4.Patel CJ, Bhattacharya J, Butte AJ. An Environment-Wide Association Study (EWAS) on type 2 diabetes mellitus. PLoS One. 2010;5:e10746. doi: 10.1371/journal.pone.0010746. [DOI] [PMC free article] [PubMed] [Google Scholar]
- 5.Patel CJ, Cullen MR, Ioannidis JP, Butte AJ. Systematic evaluation of environmental factors: persistent pollutants and nutrients correlated with serum lipid levels. Int J Epidemiol. 2012 Mar 15; doi: 10.1093/ije/dys003. [DOI] [PMC free article] [PubMed] [Google Scholar]
- 6.Stamler J, Elliott P, Dennis B, Dyer AR, Kesteloot H, Liu K, Ueshima H, Zhou BF. INTERMAP Research Group. INTERMAP: background, aims, design, methods, and descriptive statistics (nondietary) J Hum Hypertens. 2003;17:591–608. doi: 10.1038/sj.jhh.1001603. [DOI] [PMC free article] [PubMed] [Google Scholar]
- 7.Centers for Disease Control and Prevention (CDC) [Accessed 03/06/2012];National Health and Nutrition Examination Survey. http://www.cdc.gov/nchs/nhanes/ 2011; Available at: URL: http://www.cdc.gov/nchs/nhanes/.
- 8.Ainsworth BE, Haskell WL, Whitt MC, Irwin ML, Swartz AM, Strath SJ, O'Brien WL, Bassett DR, Jr, Schmitz KH, Emplaincourt PO, Jacobs DR, Jr, Leon AS. Compendium of physical activities: an update of activity codes and MET intensities. Med Sci Sports Exerc. 2000;32:S498–S504. doi: 10.1097/00005768-200009001-00009. [DOI] [PubMed] [Google Scholar]
- 9.Ioannidis JP, Patsopoulos NA, Evangelou E. Uncertainty in heterogeneity estimates in meta-analyses. BMJ. 2007;335:914–916. doi: 10.1136/bmj.39343.408449.80. [DOI] [PMC free article] [PubMed] [Google Scholar]
- 10.Benjamini Y, Yekutieli D. The control of the false discovery rate in multiple testing under dependency. Ann Statist. 2012;29:1165–1188. [Google Scholar]
- 11.Cohen J. Statistical power analysis for the behavorial sciences. 2nd ed. Hillsdale, NJ: Lawrence Erlbaum; 1988. [Google Scholar]
- 12.Venables WN, Ripley BD. 4th ed. Springer; 2003. Modern applied statistics with S. [Google Scholar]
- 13.Gordon A. Classification. 2nd ed. Chapman and Hall; 1999. [Google Scholar]
- 14.Lau J, Ioannidis JP, Schmid CH. Quantitative synthesis in systematic reviews. Ann Intern Med. 1997;127:820–826. doi: 10.7326/0003-4819-127-9-199711010-00008. [DOI] [PubMed] [Google Scholar]
- 15.R Development Core Team. 2.8.1 ed. Vienna, Austria: R Foundation for Statistical Computing; 2009. R: A language for statistical computing. [Google Scholar]
- 16.Tzoulaki I, Brown IJ, Chan Q, Van Horn L, Ueshima H, Zhao L, Stamler J, Elliott P. International Collaborative Research Group on Macro-/Micronutrients and Blood Pressure. Relation of iron and red meat intake to blood pressure: cross sectional epidemiological study. BMJ. 2008;337:a258. doi: 10.1136/bmj.a258. [DOI] [PMC free article] [PubMed] [Google Scholar]
- 17.Elliott P, Kesteloot H, Appel LJ, Dyer AR, Ueshima H, Chan Q, Brown IJ, Zhao L, Stamler J. INTERMAP Cooperative Research Group. Dietary phosphorus and blood pressure: international study of macro- and micro-nutrients and blood pressure. Hypertension. 2008;51:669–675. doi: 10.1161/HYPERTENSIONAHA.107.103747. [DOI] [PMC free article] [PubMed] [Google Scholar]
- 18.Elliott P, Stamler J, Dyer AR, Appel L, Dennis B, Kesteloot H, Ueshima H, Okayama A, Chan Q, Garside DB, Zhou B. Association between protein intake and blood pressure: the INTERMAP Study. Arch Intern Med. 2006;166:79–87. doi: 10.1001/archinte.166.1.79. [DOI] [PMC free article] [PubMed] [Google Scholar]
- 19.Johnson T, Gaunt TR, Newhouse SJ, Padmanabhan S, Tomaszewski M, Kumari M, Morris RW, Tzoulaki I, O'Brien ET, Poulter NR, Sever P, Shields DC, Thom S, Wannamethee SG, Whincup PH, Brown MJ, Connell JM, Dobson RJ, Howard PJ, Mein CA, Onipinla A, Shaw-Hawkins S, Zhang Y, Davey Smith G, Day IN, Lawlor DA, Goodall AH, Cardiogenics Consortium, Fowkes FG, Abecasis GR, Elliott P, Gateva V, Global BPgen Consortium, Braund PS, Burton PR, Nelson CP, Tobin MD, van der Harst P, Glorioso N, Neuvrith H, Salvi E, Staessen JA, Stucchi A, Devos N, Jeunemaitre X, Plouin PF, Tichet J, Juhanson P, Org E, Putku M, Sõber S, Veldre G, Viigimaa M, Levinsson A, Rosengren A, Thelle DS, Hastie CE, Hedner T, Lee WK, Melander O, Wahlstrand B, Hardy R, Wong A, Cooper JA, Palmen J, Chen L, Stewart AF, Wells GA, Westra HJ, Wolfs MG, Clarke R, Franzosi MG, Goel A, Hamsten A, Lathrop M, Peden JF, Seedorf U, Watkins H, Ouwehand WH, Sambrook J, Stephens J, Casas JP, Drenos F, Holmes MV, Kivimaki M, Shah S, Shah T, Talmud PJ, Whittaker J, Wallace C, Delles C, Laan M, Kuh D, Humphries SE, Nyberg F, Cusi D, Roberts R, Newton-Cheh C, Franke L, Stanton AV, Dominiczak AF, Farrall M, Hingorani AD, Samani NJ, Caulfield MJ, Munroe PB. Blood pressure loci identified with a gene-centric array. Am J Hum Genet. 2011;89(6):688–700. doi: 10.1016/j.ajhg.2011.10.013. [DOI] [PMC free article] [PubMed] [Google Scholar]
- 20.International Consortium for Blood Pressure Genome-Wide Association Studies. Genetic variants in novel pathways influence blood pressure and cardiovascular disease risk. Nature. 2011;478:103–109. doi: 10.1038/nature10405. [DOI] [PMC free article] [PubMed] [Google Scholar]
- 21.Schwammenthal Y, Tanne D. Homocysteine, B-vitamin supplementation, and stroke prevention: from observational to interventional trials. Lancet Neurol. 2004;3:493–495. doi: 10.1016/S1474-4422(04)00826-9. [DOI] [PubMed] [Google Scholar]
- 22.Forman JP, Rimm EB, Stampfer MJ, Curhan GC. Folate Intake and the Risk of Incident Hypertension Among US Women. JAMA. 2005;293:320–329. doi: 10.1001/jama.293.3.320. [DOI] [PubMed] [Google Scholar]
- 23.Powers HJ. Interaction among folate, riboflavin, genotype, and cancer, with reference to colorectal and cervical cancer. J Nutr. 2005;135:2960S–2966S. doi: 10.1093/jn/135.12.2960S. [DOI] [PubMed] [Google Scholar]
- 24.Ward M, Wilson CP, Strain JJ, Horigan G, Scott JM, McNulty H. B-vitamins, methylenetetrahydrofolate reductase (MTHFR) and hypertension. Int J Vitam Nutr Res. 2011;81:240–244. doi: 10.1024/0300-9831/a000069. [DOI] [PubMed] [Google Scholar]
- 25.Wilkinson TJ, Hanger HC, Elmslie J, George PM, Sainsbury R. The Response to Treatment of Subclinical Thiamine Deficiency in the Elderly. Am J Clin Nutr. 1997;66:925–928. doi: 10.1093/ajcn/66.4.925. [DOI] [PubMed] [Google Scholar]
- 26.Tanphaichitr V, Vimokesant SL, Dhanamitta S, Valyasevi A. Clinical and biochemical studies of adult beriberi. Am J Clin Nutr. 1970;23:1017–1026. doi: 10.1093/ajcn/23.8.1017. [DOI] [PubMed] [Google Scholar]
- 27.Ioannidis JP, Loy EY, Poulton R, Chia KS. Researching genetic versus nongenetic determinants of disease: a comparison and proposed unification. Sci Transl Med. 2009;1:7p–s8. doi: 10.1126/scitranslmed.3000247. [DOI] [PubMed] [Google Scholar]
- 28.Kavvoura FK, Liberopoulos G, Ioannidis JP. Selection in reported epidemiological risks: an empirical assessment. PLoS Med. 2007;4:e79. doi: 10.1371/journal.pmed.0040079. [DOI] [PMC free article] [PubMed] [Google Scholar]
- 29.Boffetta P, McLaughlin JK, La VC, Tarone RE, Lipworth L, Blot WJ. False-positive results in cancer epidemiology: a plea for epistemological modesty. J Natl Cancer Inst. 2008;100:988–995. doi: 10.1093/jnci/djn191. [DOI] [PMC free article] [PubMed] [Google Scholar]
- 30.Siontis GC, Ioannidis JP. Risk factors and interventions with statistically significant tiny effects. Int J Epidemiol. 2011;40:1292–1307. doi: 10.1093/ije/dyr099. [DOI] [PubMed] [Google Scholar]
- 31.Ioannidis JP, Tarone R, McLaughlin JK. The false-positive to false-negative ratio in epidemiologic studies. Epidemiology. 2011;22:450–456. doi: 10.1097/EDE.0b013e31821b506e. [DOI] [PubMed] [Google Scholar]
Associated Data
This section collects any data citations, data availability statements, or supplementary materials included in this article.


