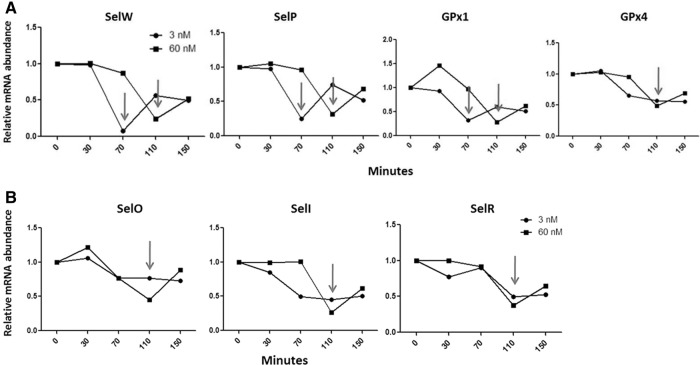
FIGURE 5.
mRNA decay profiles during high and low Se. (A) mRNAs predicted sensitive to NMD. (B) mRNAs predicted resistant to NMD. Transcript levels are normalized to HPRT and then fold-change ratios were calculated by comparing levels of RNA in cells treated with actinomcycin D to those not treated.

