Abstract
The aim of this paper is to develop novel chitosan-Zinc oxide nanocomposite films for biomedical applications. The films were fabricated with 1, 5, 10 and 15% w/w of Zinc Oxide (ZnO) nanoparticles (NPs) incorporated with chitosan (CS) using a simple method. The prepared nanocomposite films were characterized using atomic force microscopy, Raman and X-Ray diffraction studies. In addition, nano and micro mechanical properties were measured. It was found that the microhardness, nanohardness and its corresponding elastic modulus increased with the increasing of ZnO NPs percentage in the CS films. However, the ductility of films decreased as the percentage of ZnO NPs increased. Cell attachment and cytotoxicity of the prepared films at day two and five were evaluated in vitro using osteoblasts (OBs). It was observed that OB viability decreased in films with higher than 5% ZnO NPs. This result suggests that although ZnO NPs can improve the mechanical properties of pure CS films, only a low percentage of ZnO NPs can be applied for biomedical and bioengineering applications because of the cytotoxicity effects of these particles.
Keywords: Chitosan film, zinc oxide nanoparticles, nanoindentation, microhardness, osteoblasts, cell viability, mechanical properties
1. Introduction
Zinc oxide (ZnO) nanostructures have a wide range of applications in the sensor [1–3] and cosmetic industries [4–6]. Recent studies focus on potential use of nano-scale ZnO incorporated biopolymers to use as bandages for wound dressing [7] and treat various human diseases such as cancer [8, 9]. Biodegradation of ZnO in the body releases Zn2+ cations (daily requirement for humans) and O2− anions [10]. ZnO nanoparticles (NPs) also exhibit antibacterial activity [11, 12]. Bacterial contamination is frequently present in traumatic wounds and bone defects, including combat injuries. Therefore, antibacterial activity of the material is a crucial factor in treating bone defects and other types of bacterial infection related diseases. According to the published results, nano-sized ZnO is a more effective antimicrobial agent than bulk ZnO [13].
Various investigations have introduced toxic effects of pure ZnO in diverse forms such as NPs and nanowires [14–20]. The appearance and extent of nanostructural ZnO cytotoxicity play an important role in the application of ZnO NPs in the treatment of human disease. While some studies have shown severe cytotoxicity of ZnO nanostructures, other studies have not claimed remarkable cell toxic effect because of changes in cell density or amount of ZnO NPs [21, 22]. Consequently, in order to use ZnO nanostructures in tissue engineering and regenerative medicine, these nanostructures need to be incorporated with a carrier polymer or other type of material. On the other hand, numerous studies have reported that the mechanical and electrical properties of different polymers have improved when ZnO NPs are incorporated into the polymeric matrices [23–25].
Chitosan (CS) has been used for many different biomedical applications such as drug delivery and tissue engineering due to its favorable biocompatible and biodegradable properties [26–30]. In large scale, CS is produced by deacetylation of chitin which is the primary structural element of shrimp shells and other sea crustaceans. CS is considered as a linear polysaccharide, composed of N-acetyl glucosamine and glucosamine. The ratio of glucosamine to N-acetyl glucosamine is called the degree of deacetylation which is varied from 30% to 95%. When the degree of deacetylation reaches about 50%, CS becomes soluble in aqueous acidic solution. One of the main disadvantages of CS as a bone scaffold is its poor mechanical properties [31, 32]. Recently, some studies have investigated adding NPs [33] and crosslinking to improve CS mechanical properties [34] but still more investigations need to be done to achieve acceptable mechanical properties. In addition, the complete investigation on the effects of ZnO NPs incorporated into CS films has not yet been done and it is essential to examine further the toxicity of ZnO under the actual environmental conditions [35].
In the present study, we selected a CS biopolymer as the matrix for the incorporation of ZnO NPs. The prepared films were characterized using atomic force microscopy (AFM), X-ray diffraction (XRD) and Raman spectrum. We conducted nanohardness test using AFM and elastic modulus was obtained from loading-unloading curve by applying Oliver-Pharr theory. In addition, microhardness test results were obtained using Vicker’s microhardness number. Cell attachment and cytotoxicity were evaluated using Live/Dead cell assay. The purpose of this study was to: (i) characterize ZnO NPs and investigate its effects (1, 5, 10 and 15% w/w) on mechanical and material properties of CS polymer films incorporating ZnO NPs using diverse methods, and (ii) analyze the extent of ZnO NPs induced cytotoxicity in ZnO NPs (1, 5, 10 and 15% w/w) incorporated CS polymer films.
2. Materials and methods
2.1. Materials and instruments
CS (85% deacetylated medium molecular weight) was purchased from Sigma-Aldrich. ZnO NPs were purchased from Alfa Aesar. A diamond tip mounted stainless steel cantilever (DNISP-MM) was purchased from Brucker. A Clark hardness test machine (CM-400AT) was used for determining microhardness while AFM (Veeco, multimode with nano scope V controller) with a J scanner was used for nanoindentation testing and imaging. Fluorescence images of the cells were taken using a fluorescence microscope (FSX-100, Olympus). Alpha minimum essential medium (α-MEM) containing, 10% fetal bovine serum (FBS) and 1% penicillin-stereptomycin, purchased from Gibco were used as cell culture medium. To prepare AFM samples, microscope slides with 1 mm thickness (Fisher Scientific) were used. The morphology images of ZnO NPs were obtained using a scanning electron microscopy (SEM) (Hitachi S3200) operating with an accelerating voltage of 20 kV under high vacuum. A conventional secondary electron scintillator detector was used with a tungsten filament. The ZnO NPs were coated with a gold layer (~5 nm) using a sputter coater (Denton vacuum model Desk II). XRD patterns (Analytical X’Pert Pro MPD) of the film samples were obtained using Cu kα radiation under the voltage of 45 kV and current of 40 mA. Raman spectra of all groups were recorded by confocal Raman spectrometer (Jobin Yvon Horiba Confocal Raman Spectrometer) with He-Ne laser at 632 nm excitation.
2.2. CS-ZnO NPs film fabrication
CS (2% w/v) solution was prepared by adding 200 mg CS to 10 mL acetic acid 1% (v/v). To fabricate ZnO NPs incorporated CS films, 2, 10, 20 and 30 mg of ZnO NPs were measured and separately added to the CS solutions. The solution was rigorously stirred for 1 h to get a homogeneous mixture and cast at room temperature onto clean glass plates, which were previously rinsed with deionized water and dried for 36 h under a hood. Film thickness was approximately between 200–400 μm.
2.3. Micromechanical and nanomechanical properties of CS-ZnO NPs films
The microhardness test was performed for the CS films containing ZnO NPs on the glass substrates using a Clark microhardness test machine. Three different loads, 25, 50 and 100 gram force (gf) were applied to the surface of the samples to obtain a Vicker’s microhardness number by measuring the indent’s diagonal length.
AFM was used to find nanohardness and material behavior under loading and unloading conditions during the nanoindentation test for ZnO NPs incorporated CS films on glass substrates. Nanoindentation measurements were performed by using a diamond tip with the spring constant of 216.8 N/m. This is relatively high spring constant for AFM tips. This tip was used to apply a large force. Applied load was approximately 20,000 nN. The following images were captured in tapping mode at a frequency of 3 Hz. The nanoindentation test was done at 20 different locations of each sample in order to collect accurate and repeatable data. The Scanning Probe Image Processor (SPIP) was used to measure the surface roughness of the films. The method of finding elastic modulus from nanoindentation test is discussed in appendix 1.
2.4. Cell culture and viability of osteoblasts
Murine OB-6 vial (Dr. Lecka Czernik in the Department of Orthopedic Surgery at the University of Toledo kindly provided) which was used for propagation and further studies. OBs were plated on Petri dishes with 100 mm diameters and incubated at 37°C in a humidified 5% CO2/95% air atmosphere in an osteogenic medium. Cells were monitored and the medium was changed at every 2–3 days. When the dishes reached 80% confluent, the adherent OBs were harvested as follows: cells were washed twice with Hank’s balanced salt solution, treated with 2 consecutive applications of trypsin/EDTA for 3–5 min each at room temperature and washed with the growth medium.
2.4.1. Cell attachment and spreading
Cellular experiments were performed using five different groups of films: CS (control, 0% ZnO NPs), 1% ZnO NPs + CS, 5% ZnO NPs + CS, 10% ZnO NPs + CS, and 15% ZnO NPs + CS. Cell attachment and viability were studied as described below. For each cellular experiment four replicates were used per group. All types of films were sterilized under UV light for 20 min before starting cellular experiments. Five different types of sterilized films on glass substrates were placed in 24-well plates and seeded with OBs with 35,000 cells per well.
2.4.2. Cell viability and cytotoxicity
Attachment and viability of OBs on different films were studied using the Live/Dead cell assay (Molecular probes). At days two and five, the cells were washed with 500 μl Dulbecco's phosphate-buffered saline. Next, 500 μl of Calcein-AM/ethidium homodimer from Live/Dead assay was added to each well and incubated for 45 min. The number of live and dead cells from 10 randomly selected images was measured by ImageJ software.
2.5. Statistics
The data points on the plots for nanomechanical and cell attachment studies represent the means + standard deviation. The nanomechanical and cell attachment data was analyzed using One-way analysis of variance (ANOVA) with the SPSS (V. 17) software and p<0.05 (p denotes the probability) was considered statistically significant.
3. Results and discussion
3.1. Material characterization
3.1.1. Morphology of ZnO NPs
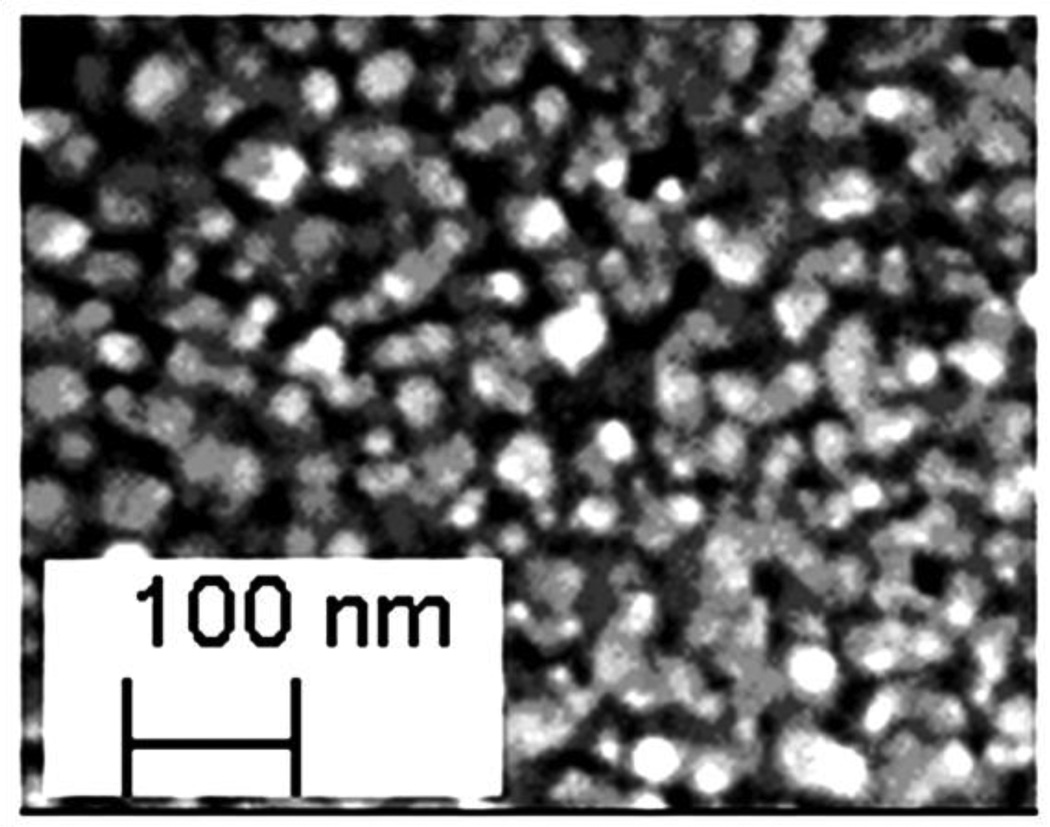
The ZnO nanostructures can be in different forms such as fibers, particles, wires and nanorods. Examination of ZnO morphology is important to understand the nano-scale properties of ZnO. Therefore, the morphology of ZnO nanostructures was studied using SEM as shown in Figure 1. The average size of ZnO NPs was 30 nm (Figure 1) which is also reported by the manufacturer (0.024 μm-0.071 μm). The ZnO NPs in the range of 10–50 nm exhibits antibacterial properties [13, 36].
Figure 1.
SEM image confirmed that ZnO nanostructures are formed as particles approximately 30 nm in diameter.
3.1.2. X-Ray diffraction analysis
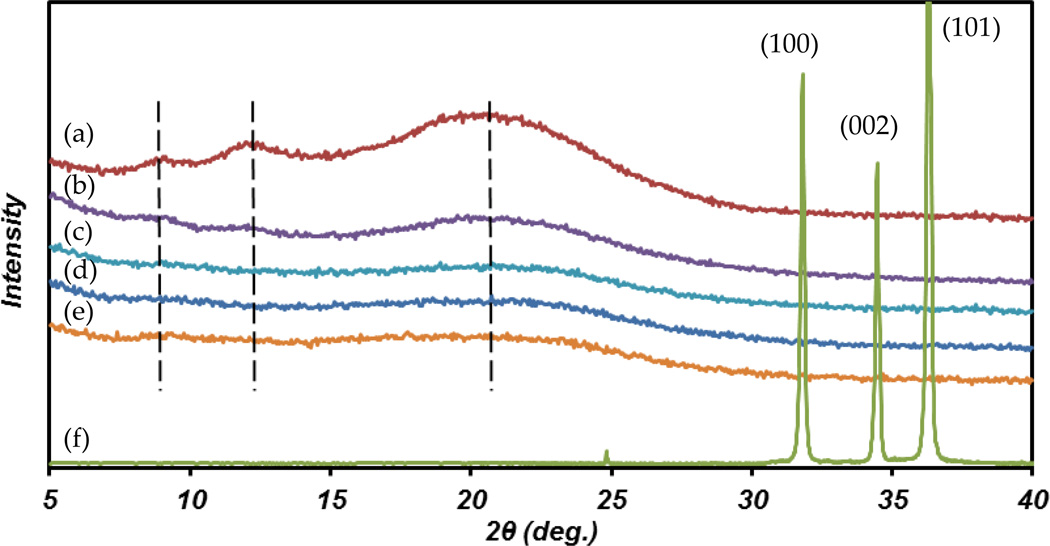
There are differently reported polymorphs structures for CS including “tendon- chitosan”, “annealed”, “noncrystalline”, etc. The tendon (hydrated) crystalline structure gives a reflection at 2θ=10 (or peaks around 8° and 12°) and the anhydrous (annealed) crystalline gives one peak at 2θ=15° [37]. Figure 2 presents the XRD patterns of CS only film, CS-ZnO NPs film and ZnO NPs. The CS only film shows characteristic wide peaks around 2θ=8.8°, 12.1° and 21.1°. The first two peaks correspond to the hydrated crystalline structure, while the other peak around 2θ=21.1° indicates the existence of an amorphous structure. Such a pattern characterized CS crystal which referred to as the “hydrate-amorphous” polymorph. Adding ZnO NPs decrease the crystalline structure of CS as shown in Figure 2. The peaks are more weak and wide as the ZnO NP percentage increases and this implies completely amorphous structure for higher percent of ZnO NPs incorporated CS films. In the range of 2θ=5°-40°, three strong peaks appeared at 32°, 34.4° and 36.4° for ZnO NPs in the XRD spectrum. These peaks correspond to (100), (002) and (101) planes, respectively [38]. Full width at half maximum (FWHM) of all peaks are small indicating high degree of crystallite orientations. Adding up to 15% ZnO NPs did not induce any ZnO corresponded peaks into CS-ZnO NPs films.
Figure 2.
XRD patterns of (a) CS only film, (b) 1% ZnO+CS film, (c) 5% ZnO+CS film, (d) 10% ZnO+CS film, (e) 15% ZnO+CS film and (f) ZnO powder.
3.1.3. Raman spectrum
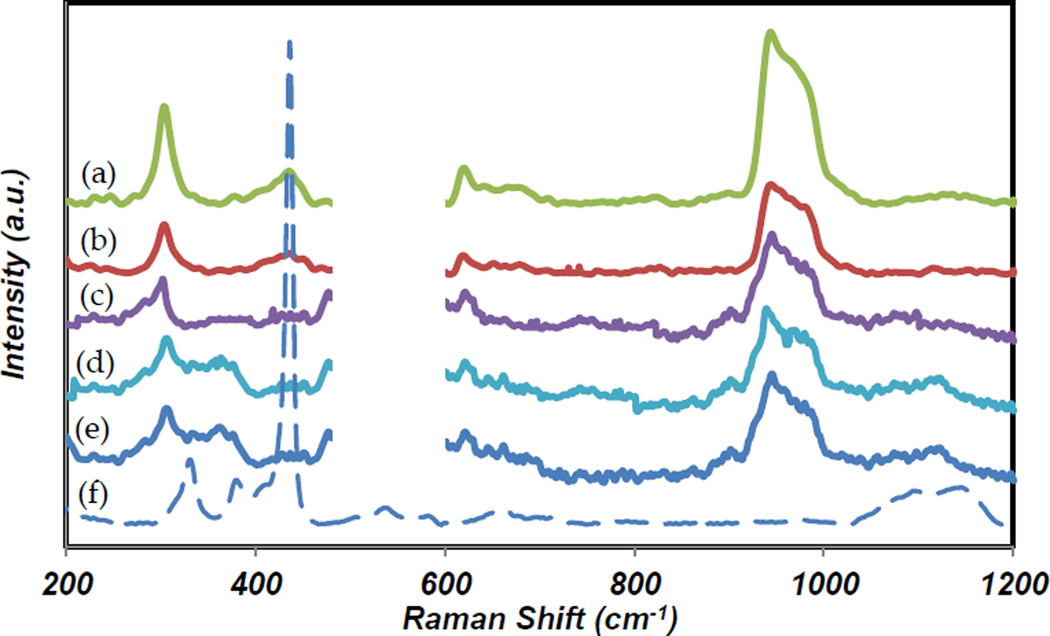
Figure 3 shows the Raman spectra of the CS only film, CS-ZnO NPs films and ZnO NPs. In the range of 200–1200 cm−1, two intense wide bands were observed for CS only and CS-ZnO NPs films, One band at 300–400 cm−1 and the other one at 950–1050 cm−1 [39]. The peak in a vicinity of 950 cm−1 is assigned to the bond of carbon with oxygen, carbon and nitrogen of the biopolymer [40]. Due to the high transparency of the films, pure CS and CS-ZnO NPs films were coated on silicon substrate for the best laser reflection. Thus, strong peak of silicon (~531 cm−1) was observed. The graph in the range of 500–600 cm−1 was removed in order to observe just the CS related peaks. Raman analysis was performed for ZnO NPs. ZnO NPs have a strong peak at 439 cm−1 and two smaller peaks at 328 cm−1 and 1135 cm−1. The first two peaks are from the zone-boundary phonons 3E2H –E2L and E2H mode of ZnO crystal, respectively [41]. Raman spectrums of CS-ZnO NPs films reveal the extra peak at 439 cm−1 due to the presence of ZnO NPs. In addition, the first CS peak at around 300 cm−1 becomes stronger and narrower.
Figure 3.
Raman spectra of (a) CS only film, (b) 1% ZnO+CS film, (c) 5% ZnO+CS film, (d) 10% ZnO+CS film, (e) 15% ZnO+CS film and (f) ZnO powder.
3.2. Nanomechanical properties - nanoindentation
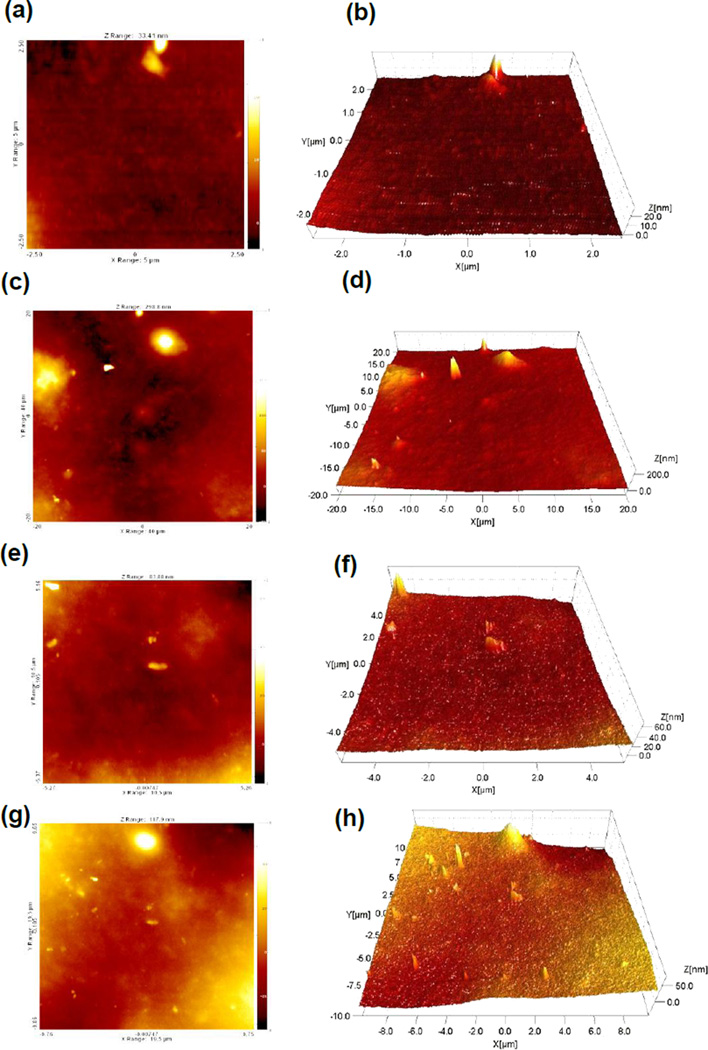
Information about surface roughness and topography of CS-ZnO NPs films cast on glass substrates was obtained using AFM. Surface properties of substrates are important for cell attachment and growth. Figure 4 shows the AFM top view image and three dimensional (3D) plot of the surface of the 1% (a,b), 5% (c,d), 10% (e,f) and 15% (g,h) ZnO NPs incorporated CS films in the nanoindentation test. Adding different concentrations of ZnO NPs increase the surface roughness of CS films. The average surface roughness of the films containing ZnO NPs, 1, 5, 10 and 15% was 11.8, 15.8, 16.4, and 19.1 nm, respectively. The AFM images verified that the surface of CS films containing ZnO NPs is homogeneous. No big difference in surface topography was observed due to the low percentage of ZnO NPs. Interestingly, the surface roughness increased due to the presence of ZnO NPs. This may be helpful for cell attachment [42] due to the effect of ZnO NPs on the CS film surface. The ZnO NPs are well distributed on the CS film surface during the film coating process. As it is shown in Figure 4, the ZnO NPs are almost distributed homogenously and the AFM images reveal the ZnO NPs in the CS films.
Figure 4.
AFM image of top view and 3D view for surface of 1% ZnO+CS film (a) and (b), 5% ZnO+CS film (c) and (d), 10% ZnO+CS film (e) and (f), 15% ZnO+CS film (g) and (h).
Theoretical calculations for nanomechanical properties are based on previously published equations [43, 44]. In Oliver-Pharr model which is described with more details in appendix 1, the film is considered as an elastoplastic material. To find the elastic modulus of the samples, the required parameters were derived from Scanning Probe Image Processor (SPIP) software.
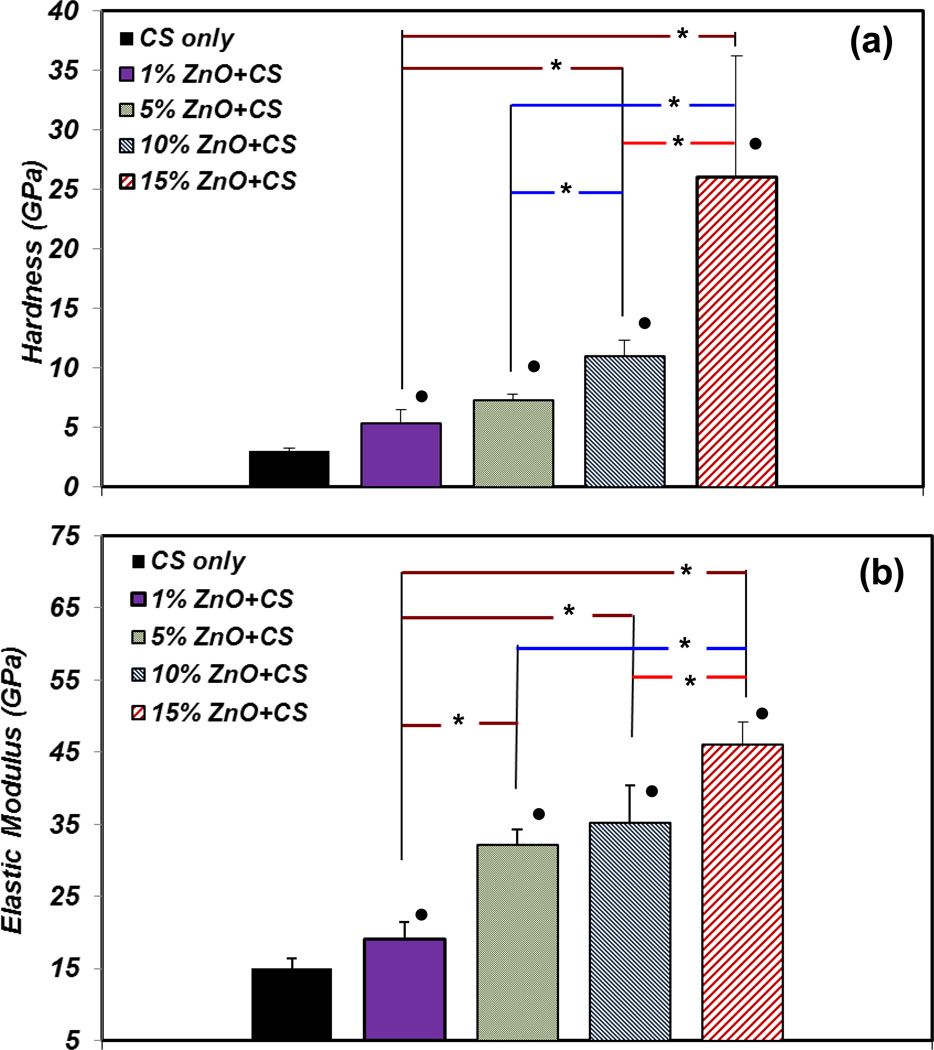
Figure 5(a) demonstrates the average hardness values for all the CS only film and ZnO NPs incorporated CS films. The average hardness of CS films increase with the increase of ZnO NPs incorporated. The average hardness of CS films containing 1, 5, 10 and 15% ZnO NPs are 5, 7, 11 and 26 GPa respectively. This value for CS only film is 2.6 GPa. The 15% ZnO NPs incorporated CS film showed a significantly higher average hardness compared to all other ZnO NPs incorporated samples (p<0.05). Moreover, there is a significant difference between pure CS films and other groups. In addition, the 10% ZnO NPs incorporated CS sample showed a significantly higher average hardness compared to 1% and 5% ZnO NPs incorporated samples (p<0.05). However, the hardness of 1% and 5% ZnO NPs incorporated samples did not exhibit any significant difference.
Figure 5.
Nanohardness (a) and elastic modulus (b) for different amount of ZnO NPs incorporated CS films. * denotes significant difference between CS films containing different percentage of ZnO NPs (p<0.05). ● denotes significant difference in CS films containing different percentage of ZnO NPs compared with CS only film (p<0.05). Nanohardeness and elastic modulus increase with the increase of ZnO NPs in the CS film.
The elastic modulus of ZnO NPs incorporated CS films is shown in Figure 5(b). Similar to the hardness results in, elastic modulus also increases with the increase of percentage of ZnO NPs in the CS films. The elastic modulus of 1, 5, 10, and 15% ZnO NPs incorporated CS films were 19, 32, 35, and 46 GPa, respectively. However, the elastic modulus for CS only film is 15 GPa. The 15% ZnO NP incorporated CS film has the highest elastic modulus among all the other samples. The 10% ZnO NPs incorporated sample shows a higher elastic modulus in comparison to the 1% ZnO NPs incorporated sample. The average of reported Young’s modulus value for ZnO NPs is between 210–340 MPa [25] which is significantly higher than CS. This result is in agreement with the reported tensile tests for ZnO deposited in other polymers [45].
3.3. Micromechanical properties - microindentation
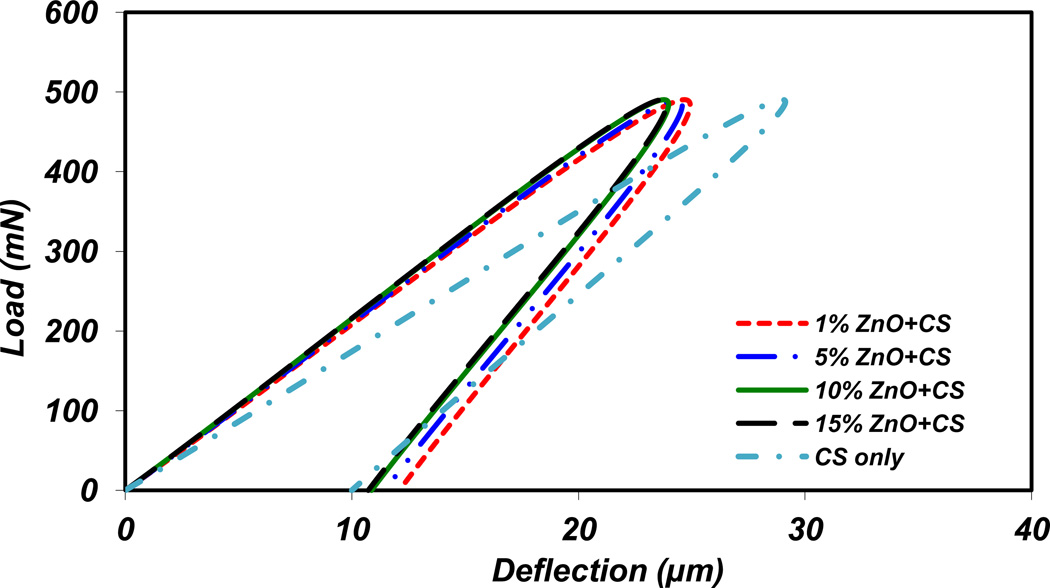
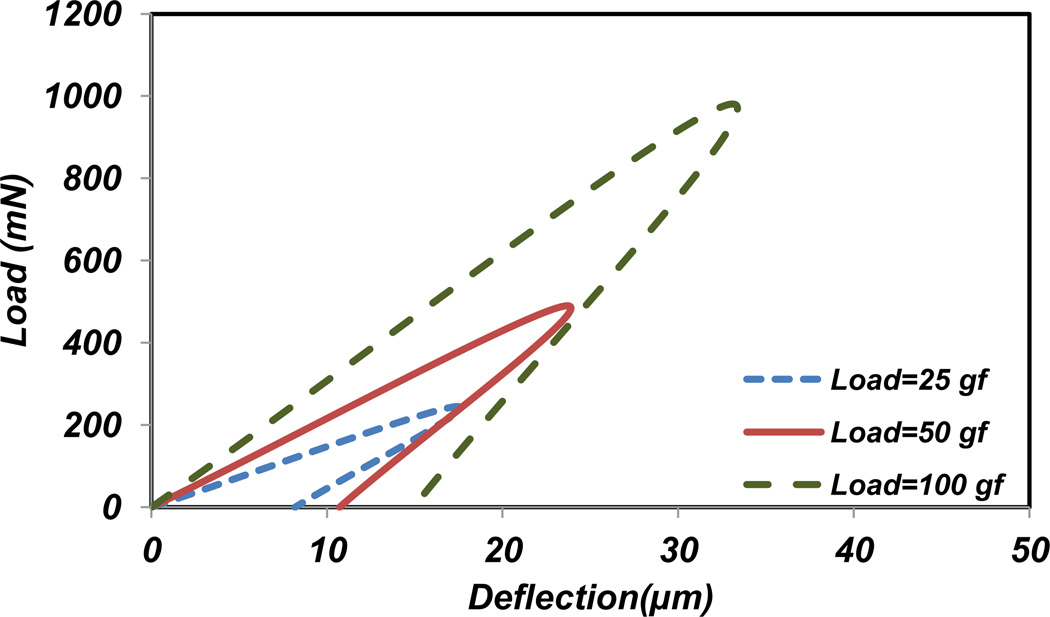
The deformation of material during loading was determined for different percentages of ZnO NPs incorporated CS films. Based on Vicker’s indenter geometry, the indent’s diagonal length was obtained [46]. According to nanoindentation results and calculations, the ratio of elastic elongation to plastic elongation (Contact stiffness (S)) for 1, 5, 10 and 15% of ZnO NPs incorporated films are 1.1, 1.3, 1.3 and 1.4, respectively. Moreover, this ratio for CS only film is 1.9. The loading-unloading curve for CS only, 1, 5, 10 and 15% of ZnO NPs incorporated CS films at 50 gf load is shown in Figure 6. As it is demonstrated in this figure, CS with lower percentage of ZnO NPs shows slightly softer material properties. This result shows that adding ZnO NPs increases the brittleness of samples in micro and nano scales. These fractions approximate the ratio of plastic deformation to total deformation of the materials. Regarding to this figure, deformation related to maximum force increases with the films containing lower percentages of ZnO NPs. In other words, by increasing the percentage of ZnO NPs a harder and more brittle film is formed. From another point of view, the effect of three different loads, 25, 50, and 100 gf, on the ZnO NPs incorporated CS films were examined. Figure 7 demonstrates the suggested loading-unloading curve for 15% ZnO NPs incorporated CS films. According to Figure 7, the slope of loading-unloading curve increases with higher loads. This behavior is almost the same for all other samples containing ZnO NPs.
Figure 6.
Loading- unloading curve in microhardness test for different amount of ZnO NPs incorporated CS films at 50 gf load.
Figure 7.
Loading- unloading curve in microhardness test for 15% ZnO NPs incorporated CS film with three different loads.
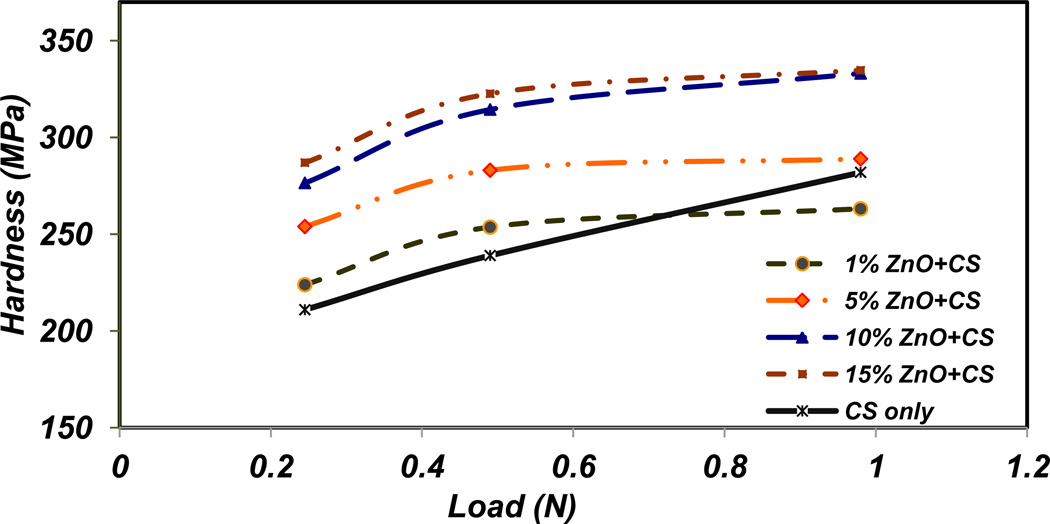
Figure 8 represents the results for Vicker’s microhardness under three different loads for all different percentages of ZnO NPs incorporated CS films and CS only film. The microhardness values increase with the increase of ZnO NPs amounts in the CS films at the same load. The samples containing 10 and 15% ZnO NPs have approximately the same hardness values. The hardness values also increase with the increase of loads for each sample. The microhardness values of 1, 5, 10, and 15% NPs incorporated CS samples under the applied load of 1 N are 260, 290, 328, and 330 GPa, respectively. Because CS only film is softer than other CS-ZnO NPs films, the effect of substrate is more obvious in this group of samples in higher applied loads. In Figure 8, the hardness of CS only film in 100 gf load is slightly higher than CS film with 1% ZnO NPs. The applied load is high enough for indenter to feel the hard substrate.
Figure 8.
Microhardness versus applied load for different amount of ZnO NPs incorporated CS films.
The hardness values from nanoindentation are higher compared to those derived from microindentation for all types of films. One of the main differences between the nanoindentation and microhardness tests is that the applied force was smaller in nanoindentation compared to the microindentation measurement. Similar behavior was reported for different types of materials including metals, ceramics and polymers [34, 47].
3.4. Cell viability
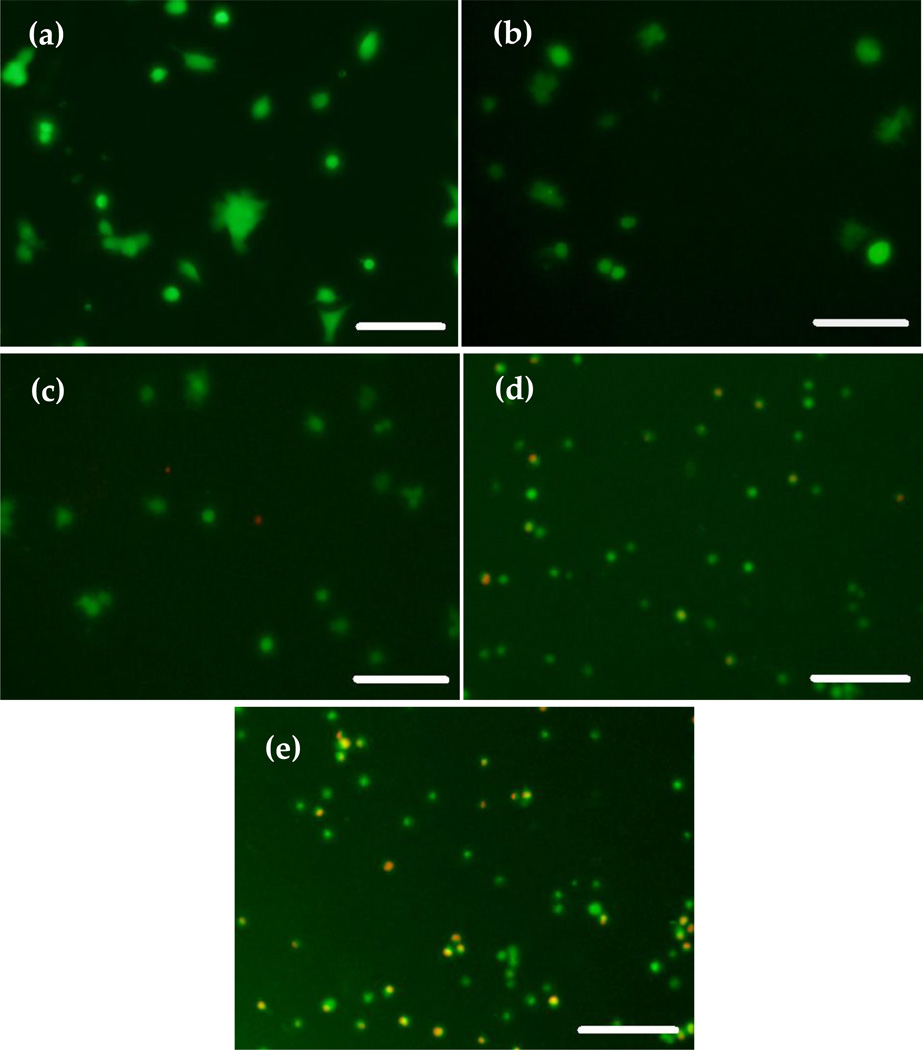
In order to obtain indications of cell viability on ZnO NPs, murine OBs were seeded on 24 well plates containing CS-ZnO NPs films at a density of 30,000 cells per well. Similar to the above mechanical property measurements, four different percentages of ZnO NPs, 1, 5, 10, and 15% were incorporated with CS films. Cell viability assay was performed using a Live/Dead cell assay (Molecular probes) after washing unattached cells with phosphate buffered saline (PBS) at day two and five (n=3). After treating with Live/Dead cell assay, live cells were stained with green and dead cells were stained with red. Figure 9 shows the fluorescence images of OBs for 0%, control (a), 1% (b), 5%, (c) 10% (d) and 15% (e) ZnO NPs incorporated CS films at day two. The OBs are attached to the control CS only film with all other ZnO NPs incorporated films at day two. The films containing 10% ZnO NPs show a few red cells compared to the control at day two (Figure 9(d)). More cells were dead in the sample containing 15% ZnO NPs (Figure 9(e)).
Figure 9.
Fluorescence microscopy images for OB attached to different types of films treated with Live/Dead cell assay at day two: (a) CS; (b) 1% ZnO+CS film; (c) 5% ZnO+CS film; (d) 10% ZnO+CS film; (e) 15% ZnO+CS film. Scale bar is 150 µm.
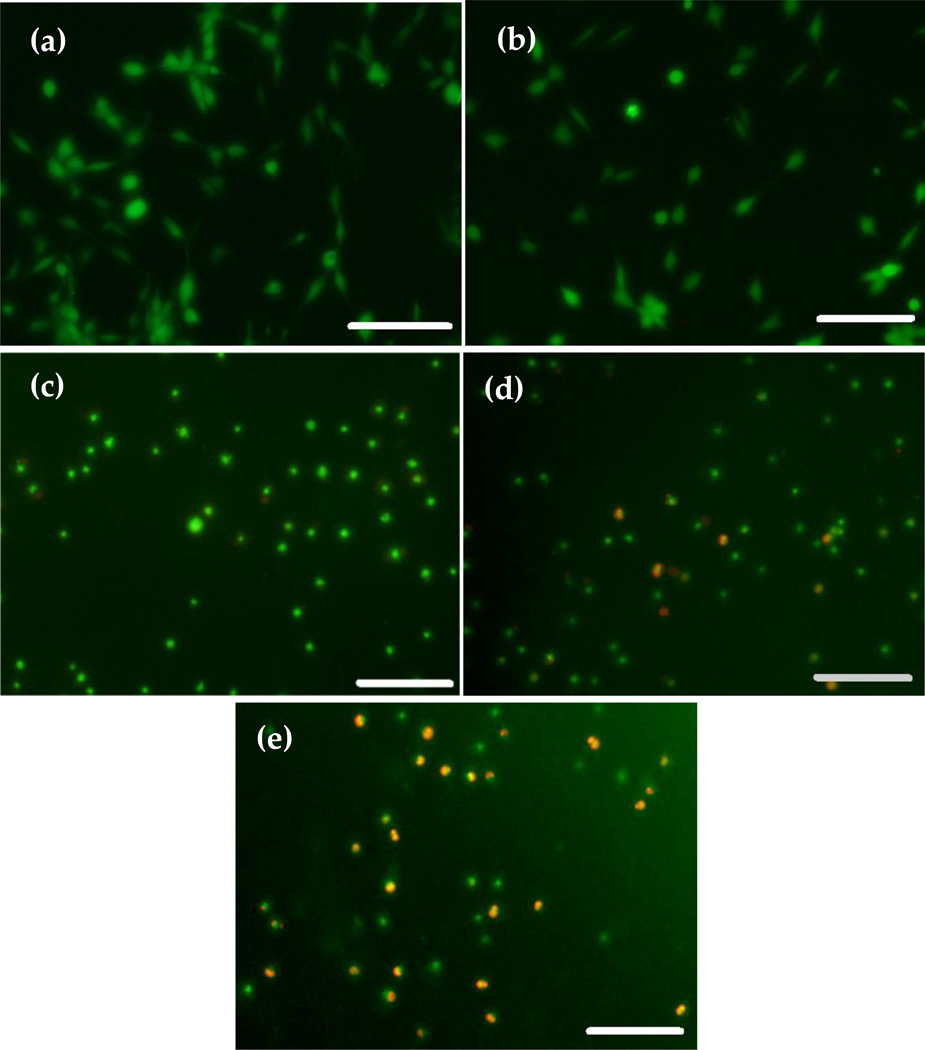
Figure 10 shows the fluorescence images of OBs for 0%, control (a), 1% (b), 5%, (c) 10% (d) and 15% (e) ZnO NPs incorporated CS films at day five. The OB spread in control (Figure 8(a)) and in 1% ZnO NPs incorporated sample (Figure 10(b)) with high cell viability at day five. However, the samples containing higher amounts of ZnO NPs (5%, 10% and 15%) did not show evidence of cell spreading at day five. In addition, the number of dead cells increases with the increase of ZnO NPs amount in the CS films (Figure 10(c), (d), (e)) at day five.
Figure 10.
Fluorescence microscopy images for OB attached to different types of films treated with Live/Dead cell assay at day five: (a) CS; (b) 1% ZnO+CS film; (c) 5% ZnO+CS film; (d) 10% ZnO+CS film; (e) 15% ZnO+CS film. Scale bar is 150 µm.
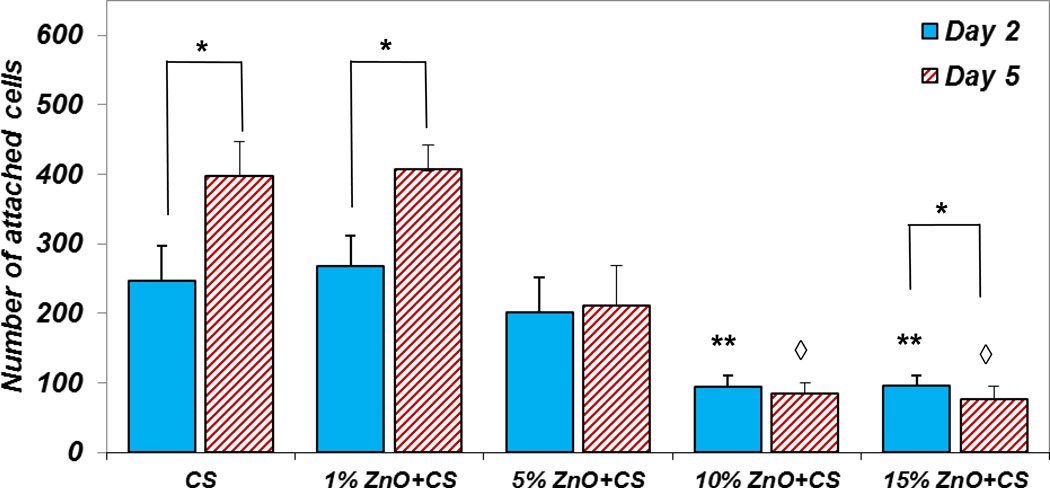
Figure 11 represents the cell attachment plot for all the groups, including CS (control) at days two and five. Cell attachment significantly increased for control films and 1% ZnO NPs incorporated CS films at day five compared to day two. When we increase the amount of ZnO NPs for 10 and 15% in the CS films, the number of cell attachment on those films was drastically reduced compared to the control. Even though the 5% ZnO NPs incorporated CS films did not show significantly lower cell attachment compared to the control films at day two, approximately 50% lower cell attachment was observed at day five. The obtained result is in agreement with previous studies [14, 17].
Figure 11.
The quantitative results for OB attachment on the different amount of ZnO NP incorporated CS films. This result shows the effect of different amount of ZnO NPs for OB attachment. * denotes statistically significant data for each group in different time points. ** and ◊ denote the statistical significance of cell attachment on different groups at day two and five compared to the CS control respectively.
This result suggests that cells are viable with CS film incorporated with lower amounts of ZnO NPs (1% w/w). The cytotoxicity of cells was observed in higher percentages of ZnO NPs (above 5% w/w) incorporated CS films; ZnO cytotoxicity was reported for many previous studies [18–20, 48]. It should be noted that in this investigation, ZnO NPs were used as received from the company (Sigma-Aldrich). We did not perform any surface modification treatment for the ZnO NPs but cell viability of ZnO NPs incorporated CS could potentially be improved if surface modified ZnO NPs were used. There were better micro and nanomechanical properties for the samples containing higher ZnO NPs. However, cell viability was poor in the higher ZnO NP containing CS films. Therefore, mechanical properties and cell viability should be optimized when polymer-ZnO NPs scaffolds or any other form is used for tissue regeneration applications. A recent study reported that when ZnO NPs incorporated into hydroxyapatite-CS cement, bone regeneration is enhanced in osseous defects in rabbit tibia [24]. It is worthwhile to study cell viability with ZnO NPs incorporated in matrices less than 5% w/w as well.
4. Conclusions
In this study we fabricated CS films with different percentages (1, 5, 10 and 15% w/w) of ZnO NPs using a solvent cast method. We were able to obtain homogeneous and smooth ZnO NPs incorporated CS films. SEM, XRD and Raman studies were used for material characterization. We investigated micro and nanomechanical properties of ZnO NPs incorporated films using microindentation and nanoindentation. The nanohardness, microhardness and elastic modulus derived from nanoindentation increase as a function of the amount of ZnO NPs incorporated with CS films. On the other hand, we observed that cell viability decreases on the CS films with increase of ZnO NPs. It should be noted that ZnO NPs were used as received, without further purification. That being said, there may be possibilities to increase the cell viability using further purified ZnO NPs. In conclusion, incorporation of ZnO NPs into the polymer matrices for biomedical applications, mechanical properties and cell viability needs optimization according to our results.
Highlights.
Chitosan-Zinc oxide nanocomposite films were fabricated using a simple method.
Material characterization methods showed adding Zinc oxide up to 15% does not change the crystal structure of chitosan.
Zinc oxide nanoparticles improve nano and micro mechanical properties of chitosan films.
Adding more than 5% w/w zinc oxide nanoparticles demonstrates cytotoxicity on osteoblast cells.
Acknowledgements
This work was supported by NSF grants numbers 0652024, 0928440 and NIH grant number DE019508.
Appendix 1
Nowadays, the common method which is used to find elastic modulus from nanoindentation is based on the Oliver-Pharr theory [43]. This method is widely used by scientists.
Important quantities in this method are as follows: The maximum indentation depth hmax includes elastic and plastic deformation. The depth at which the applied force becomes zero upon unloading is called hf, the depth hc is the contact depth at which the cross sectional area Ac is taken to calculate hardness and indentation modulus. The nanohardness of the sample HN is determined using the formula:
| (A.1) |
Where Fmax is the maximum applied load and Ac is the cross sectional area corresponding to the depth hc. The determination of the contact depth hc is given by:
| (A.2) |
Where S is the contact stiffness:
| (A.3) |
with being the slope of the unloading curve at the initial point of unloading. The reduced Young’s indentation modulus Er is a measure of the elastic properties of the tip sample system and can be calculated from the load-depth curves according to the formula:
| (A.4) |
For elastically deformable indenters, the reduced modulus Er can be generalized and is defined as:
| (A.5) |
Where Es and υs are the indentation modulus and Poisson ratio of the sample, Et and υt are the indentation modulus and Poisson ratio of the indenter tip. Since Et is much higher than Es the value of Er will hardly differ from Es.
For the indents at nano scale, the remaining area is difficult to be measured with the traditional optical microscopy because of a resolution that is too low. According to the probe geometry, the area as a function of depth can be expressed as:
| (A.6) |
Footnotes
Publisher's Disclaimer: This is a PDF file of an unedited manuscript that has been accepted for publication. As a service to our customers we are providing this early version of the manuscript. The manuscript will undergo copyediting, typesetting, and review of the resulting proof before it is published in its final citable form. Please note that during the production process errors may be discovered which could affect the content, and all legal disclaimers that apply to the journal pertain.
References
- 1.Wan Q, Li QH, Chen YJ, Wang TH, He XL, Li JP, Lin CL. Appl. Phys. Lett. 2004;84:3654. [Google Scholar]
- 2.Wang D, Chu X, Gong M. Nanotechnol. 2007;18:185601. [Google Scholar]
- 3.Kumar SA, Cheng HW, Chen SM, Wang SF. Mater. Sci. Eng. C. 2010;30:86. [Google Scholar]
- 4.Osmond MJ, Mccall MJ. Nanotoxicology. 2010;4:15. doi: 10.3109/17435390903502028. [DOI] [PubMed] [Google Scholar]
- 5.Nohynek GJ, Dufour EK, Roberts MS. Skin Pharmacol. Physiol. 2008;21:136. doi: 10.1159/000131078. [DOI] [PubMed] [Google Scholar]
- 6.Schilling K, Bradford B, Castelli D, Dufour E, Nash JF, Pape W, Schulte S, Tooley I, van den Bosch J, Schellauf F. Photochem. Photobiol. Sci. 2010;9:495. doi: 10.1039/b9pp00180h. [DOI] [PubMed] [Google Scholar]
- 7.Sudheesh Kumar P, Lakshmanan VK, Anilkumar T, Ramya C, Reshmi P, Unnikrishnan A, Nair SV, Jayakumar R. ACS Appl. Mater. Interfaces. 2012;4:2618. doi: 10.1021/am300292v. [DOI] [PubMed] [Google Scholar]
- 8.Hanley C, Layne J, Punnoose A, Reddy KM, Coombs I, Coombs A, Feris K, Wingett D. Nanotechnol. 2008;19:295103. doi: 10.1088/0957-4484/19/29/295103. [DOI] [PMC free article] [PubMed] [Google Scholar]
- 9.Wang H, Wingett D, Engelhard M, Feris K, Reddy K, Turner P, Layne J, Hanley C, Bell J, Tenne D, Wang C, Punnoose A. Mater. Sci. Mater. Med. J. 2009;20:11. doi: 10.1007/s10856-008-3541-z. [DOI] [PubMed] [Google Scholar]
- 10.Zhou J, Xu NS, Wang ZL. Adv. Mater. 2006;18:2432. [Google Scholar]
- 11.Colon G, Ward BC, Webster TJ. J. Biomed. Mater. Res. A. 2006;78A:595. doi: 10.1002/jbm.a.30789. [DOI] [PubMed] [Google Scholar]
- 12.Applerot G, Lipovsky A, Dror R, Perkas N, Nitzan Y, Lubart R, Gedanken A. Adv. Funct. Mater. 2009;19:842. [Google Scholar]
- 13.Padmavathy N, Vijayaraghavan R. Sci. Technol. Adv. Mater. 2008;9:035004. doi: 10.1088/1468-6996/9/3/035004. [DOI] [PMC free article] [PubMed] [Google Scholar]
- 14.Li Z, Yang R, Yu M, Bai F, Li C, Wang ZL. J. Phys. Chem. C. 2008;112:20114. [Google Scholar]
- 15.Aruoja V, Dubourguier H-C, Kasemets K, Kahru A. Sci. Total Environ. 2009;407:1461. doi: 10.1016/j.scitotenv.2008.10.053. [DOI] [PubMed] [Google Scholar]
- 16.Kasemets K, Ivask A, Dubourguier H-C, Kahru A. Toxicol. In Vitro. 2009;23:1116. doi: 10.1016/j.tiv.2009.05.015. [DOI] [PubMed] [Google Scholar]
- 17.Yang X, Liu X, Lu H, Zhang X, Ma L, Gao R, Zhang Y. Chem. Res. Toxicol. 2012;25:297. doi: 10.1021/tx2004823. [DOI] [PubMed] [Google Scholar]
- 18.Kubota Y, Shuin T, Kawasaki C, Hosaka M, Kitamura H, Cai R, Sakai H, Hashimoto K, Fujishima A. Br J Cancer. 1994;70:1107. doi: 10.1038/bjc.1994.456. [DOI] [PMC free article] [PubMed] [Google Scholar]
- 19.Heng B, Zhao X, Xiong S, Ng K, Boey F, Loo J. Arch. Toxicol. 2011;85:695. doi: 10.1007/s00204-010-0608-7. [DOI] [PubMed] [Google Scholar]
- 20.Deng X, Luan Q, Chen W, Wang Y, Wu M, Zhang H, Jiao Z. Nanotechnol. 2009;20:115101. doi: 10.1088/0957-4484/20/11/115101. [DOI] [PubMed] [Google Scholar]
- 21.Yin H, Casey PS, McCall MJ. J. Nanosci. Nanotechnol. 2010;10:7565. doi: 10.1166/jnn.2010.2833. [DOI] [PubMed] [Google Scholar]
- 22.Yan D, Yin G, Huang Z, Li L, Liao X, Chen X, Yao Y, Hao B. Langmuir. 2011;27:13206. doi: 10.1021/la2008107. [DOI] [PubMed] [Google Scholar]
- 23.Han Y, Kiat-amnuay S, Powers JM, Zhao Y. J. Prosthet. Dent. 2008;100:465. doi: 10.1016/S0022-3913(08)60266-8. [DOI] [PubMed] [Google Scholar]
- 24.Li S-C, Li Y-N. J. Appl. Polym. Sci. 2010;116:2965. [Google Scholar]
- 25.Hu G, Ma Y, Wang B. Mater. Sci. Eng. A. 2009;504:8. [Google Scholar]
- 26.Kato Y, Onishi H, Machida Y. Curr. Pharm. Biotechnol. 2003;4:303. doi: 10.2174/1389201033489748. [DOI] [PubMed] [Google Scholar]
- 27.Seol Y-J, Lee J-Y, Park Y-J, Lee Y-M, Ku Y, Rhyu I-C, Lee S-J, Han S-B, Chung C-P. Biotechnol. Lett. 2004;26:1037. doi: 10.1023/B:BILE.0000032962.79531.fd. [DOI] [PubMed] [Google Scholar]
- 28.Di Martino A, Sittinger M, Risbud MV. Biomaterials. 2005;26:5983. doi: 10.1016/j.biomaterials.2005.03.016. [DOI] [PubMed] [Google Scholar]
- 29.Li Z, Ramay HR, Hauch KD, Xiao D, Zhang M. Biomaterials. 2005;26:3919. doi: 10.1016/j.biomaterials.2004.09.062. [DOI] [PubMed] [Google Scholar]
- 30.Bhat A, Dreifke MB, Kandimalla Y, Gomez C, Ebraheim NA, Jayasuriya AC. Tissue Eng. Regen. Med. 2010;4:532. doi: 10.1002/term.270. [DOI] [PubMed] [Google Scholar]
- 31.Kim IY, Seo SJ, Moon HS, Yoo MK, Park IY, Kim BC, Cho CS. Biotechnol. Adv. 2008;26:1. doi: 10.1016/j.biotechadv.2007.07.009. [DOI] [PubMed] [Google Scholar]
- 32.Zainol I, Akil HM, Mastor A. Mater. Sci. Eng. C. 2009;29:292. [Google Scholar]
- 33.Kumar P, Abhilash S, Manzoor K, Nair S, Tamura H, Jayakumar R. Carbohydr. Polym. 2010;80:761. [Google Scholar]
- 34.Aryaei A, Jayatissa AH, Jayasuriya AC. J. Mech. Behav. Biomed. Mater. 2012;5:82. doi: 10.1016/j.jmbbm.2011.08.006. [DOI] [PMC free article] [PubMed] [Google Scholar]
- 35.Djurisic AB, Chen X, Leung YH, Ng AMC. J. Mater. Chem. 2012;22:6526. [Google Scholar]
- 36.Du W-L, Niu S-S, Xu Y-L, Xu Z-R, Fan C-L. Carbohydr. Polym. 2009;75:385. [Google Scholar]
- 37.Wang SF, Shen L, Zhang Wei-De, Tong YJ. Biomacromolecules. 2005;6:3067. doi: 10.1021/bm050378v. [DOI] [PubMed] [Google Scholar]
- 38.Song J, Zheng M, Yang Z, Chen H, Wang H, Liu J, Ji G, Zhang H, Cao J. Nanoscale Res. Lett. 2009;4:1512. doi: 10.1007/s11671-009-9428-1. [DOI] [PMC free article] [PubMed] [Google Scholar]
- 39.Vasconcelos HL, Camargo TP, Gonçalves NS, Neves A, Laranjeira M, Fávere VT. React. Funct. Polym. 2008;68:572. [Google Scholar]
- 40.Orrego C, Salgado N, Valencia J, Giraldo G, Giraldo O, Cardona C. Carbohydr. Polym. 2010;79:9. [Google Scholar]
- 41.Choopun S, Hongsith N, Mangkorntong P, Mangkorntong N. Physica E: Low-dimensional. Syst. Nanostructures. 2007;39:53. [Google Scholar]
- 42.Deligianni DD, Katsala ND, Koutsoukos PG, Missirlis YF. Biomaterials. 2000;22:87. doi: 10.1016/s0142-9612(00)00174-5. [DOI] [PubMed] [Google Scholar]
- 43.Oliver WC, Pharr GM. J. Mater. Res. 1992;7:1564. [Google Scholar]
- 44.Donnelly E, Baker SP, Boskey AL, van der Meulen MCH. J. Biomed. Mater. Res. A. 2006;77:426. doi: 10.1002/jbm.a.30633. [DOI] [PMC free article] [PubMed] [Google Scholar]
- 45.Wacharawichanant S, Thongyai S, Phutthaphan A, Eiamsam-ang C. Polym. Test. 2008;27:971. [Google Scholar]
- 46.Chandler H. Hardness Testing, Second ed. ASM International; 1999. [Google Scholar]
- 47.Qian L, Li M, Zhou Z, Yang H, Shi X. Surf. Coat. Technol. 2005;195:264. [Google Scholar]
- 48.Yang H, Liu C, Yang D, Zhang H, Xi Z. J. Appl. Toxicol. 2009;29:69. doi: 10.1002/jat.1385. [DOI] [PubMed] [Google Scholar]


