Abstract
The aortic sinus vortex is a classical flow structure of significant importance to aortic valve dynamics and the initiation and progression of calific aortic valve disease. We characterize the spatio-temporal characteristics of aortic sinus voxtex dynamics in relation to the viscosity of blood analog solution as well as heart rate. High resolution time-resolved (2KHz) particle image velocimetry was conducted to capture 2D particle streak videos and 2D instantaneous velocity and streamlines along the sinus midplane using a physiological but rigid aorta model fitted with a porcine bioprosthetic heart valve. Blood analog fluids used include a water-glycerin mixture and saline to elucidate the sensitivity of vortex dynamics to viscosity. Experiments were conducted to record 10 heart beats for each combination of blood analog and heart rate condition. Results show that the topological characteristics of the velocity field vary in time-scales as revealed using time bin averaged vectors and corresponding instantaneous streamlines. There exist small time-scale vortices and a large time-scale main vortex. A key flow structure observed is the counter vortex at the upstream end of the sinus adjacent to the base (lower half) of the leaflet. The spatio-temporal complexity of vortex dynamics is shown to be profoundly influenced by strong leaflet flutter during systole with a peak frequency of 200Hz and peak amplitude of 4 mm observed in the saline case. While fluid viscosity influences the length and time-scales as well as the introduction of leaflet flutter, heart rate influences the formation of counter vortex at the upstream end of the sinus. Higher heart rates are shown to reduce the strength of the counter vortex that can greatly influence the directionality and strength of shear stresses along the base of the leaflet. This study demonstrates the impact of heart rate and blood analog viscosity on aortic sinus hemodynamics.
Introduction
Calcific aortic valve disease (CAVD) affects a wide range of the population in the United States, leading to approximately 50,000 valve replacements each year [1]. Studies have shown that activation of inflammatory pathways can lead to calcification [2, 3], and while the exact mechanisms are not entirely understood, there exist strong correlations between mechanical factors, such as structural and fluid shear stresses, and endothelial inflammation. For example, many ex vivo studies have been conducted on excised leaflet tissue to examine the individual contribution of either wall shear stress [4-7] or mechanical stretching [8, 9] to calcification. Investigators identified low or oscillatory shear stress and increased mechanical strain as potential risk factors for CAVD. Furthermore, the altered mechanics in many of these experiments have led to an osteogenic phenotype within the leaflet fibrosa, suggesting that calcification is an active, rather than passive, process.
While these studies collectively make a strong case for mechanical regulation of CAVD, current imaging modalities are unable to capture the fine scale hemodynamics and leaflet kinematics within the aortic sinus. Recent advances in 4D MRI have made possible in vivo imaging over a single cardiac cycle, but limitations in spatial and temporal resolution still exist. Therefore in vitro quantitative visualization techniques such as particle image velocimetry (PIV) are currently used to more fully resolve aortic sinus flow patterns. Table 1 is a sampling of recent work involving in vivo and in vitro visualization of hemodynamics, giving insight into both the resolution and dynamic similarity capabilities of different studies.
Table 1.
Spatial and temporal resolution of various aortic valve visualization studies
| Author(s) | Year | Technique | Temporal Res | Spatial Res | Fluid | Notes |
|---|---|---|---|---|---|---|
| Saikrishnan et al. [10] |
2012 | PIV | 50 μs (peak systole) 1000 μs (diastole) |
16.6 microns/pixel 1600 × 1200 px |
Glycerin | Bicuspid valve, |
| Echo | 250 fps | 1280 × 1024 px | Glycerin | For leaflet tracking, bicuspid, |
||
| Leo et al. [11] | 2006 | PIV | 75 μs (systole) 500 μis (diastole) |
0.4 mm | Glycerin/sal ine |
Polymeric trileaflet valves, |
| Querzoli et al. [12] |
2010 | PIV | 250 Hz | 1.34 mm | Water | Prosthetic mitral valves, tuned to match physiologic Re and Wo numbers |
| Falahatpisheh, Kheradvar [13] |
2012 | Digital PIV | 1000 Hz | 1280 × 1024 px | Water | Studied left ventricle, pressure and flow conditions matched without similarity |
| Toger, Kanski, Carlsson [14] |
2012 | 4D PC-MRI | 50 ms | 3 × 3 × 3 mm | In vivo | Studied LV vortex ring |
| Bellofiore, Donohue, Quinlan [15] |
2011 | PIV (scaled up) |
1754 Hz (scaled) | 120 μm (scaled) | Water | Bileaflet MHV, scaled up geometry, dimensional analysis performed to demonstrate similarity to anatomically-sized water model, but not to blood viscosity |
| Kaminsky, Kallweit, Weber [16] |
2007 | PIV | 3000 Hz | 1.2 mm 1024 × 1024 px |
Glycerin | Bileaflet and tilting disc valves, |
| Strecker, Harloff, Wallis [17] |
2012 | 4D MRI | 40.8 ms | 1.7 × 2.0 × 2.2 mm | In vivo | Compared 1.5T and 3T strengths to visualize aorta |
| Markl, Frydrychowicz, Kozerke, Hope [18] |
2012 | 4D MRI | 40-50 ms | 2-2.5 mm | In vivo | General discussion of 4D MRI parameters for visualization of many different body regions |
A high resolution method for measuring flow through the aortic valve is necessary in order to ultimately determine mechanical leaflet stresses. This small region of interest can be narrowed down further to just the aortic sinus since calcification preferentially develops on the aortic side of the leaflet, a trend often attributed to differing wall shear stress values on the fibrosa and ventricularis [19]. While the well-established sinus vortex is a predominant flow feature [20], its temporal complexity as well as smaller-scale coherent structures govern the valve’s precise mechanical environment.
Additionally, numerous in vitro heart valve studies have used a water-glycerin solution as a viscosity-matching blood analog to more accurately elucidate hemodynamics (see Table 1).. Nevertheless, several studies utilized saline or low viscosity blood analog fluids (e.g. Table 1 and refs [21-23]) while maintaining physiological flow and pressure conditions with unknown implications on the valve dynamics due to their departure from dynamic scaling requirements. Further, fluid limitations exist in other areas of aortic valve research as well. For example, there is broad interest in development of tissue-engineered valves via bioreactors – devices which attempt to mimic in vivo conditions in an in vitro setup in order to grow new aortic valves. Such devices must employ a nutrient-rich fluid for the fresh tissue being grown, and therefore cannot use a glycerin based solution [24-26]. Thus there is a need to characterize the impact of Reynolds number and Womersley number mismatch on the sinus vortex dynamics.
The objective of this study is to (a) examine sinus vortex dynamics as well as leaflet motion at normal and elevated heart rates for blood viscosity matched water-glycerin solution, and (b) assess the extent to which the dynamics is impacted when lower viscosity saline is substituted as the blood analog fluid while maintaining physiological pressure and flow rate conditions. Given that this study is the first detailed time-resolved evaluation of sinus vortex dynamics, we elucidate sinus flow patterns and their evolution through the cardiac cycle under the above stated conditions.
Methods
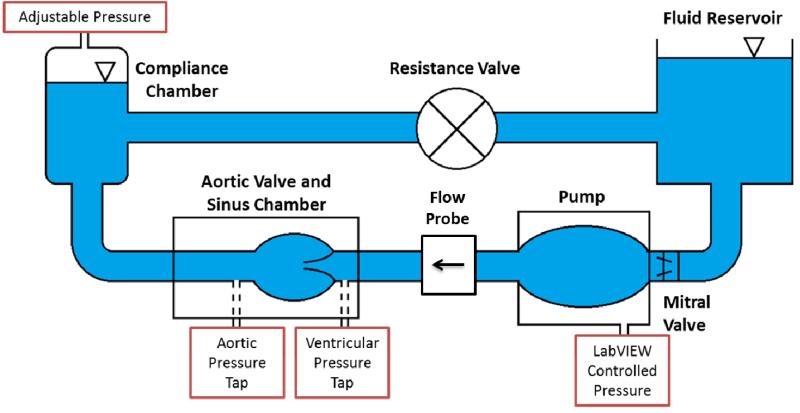
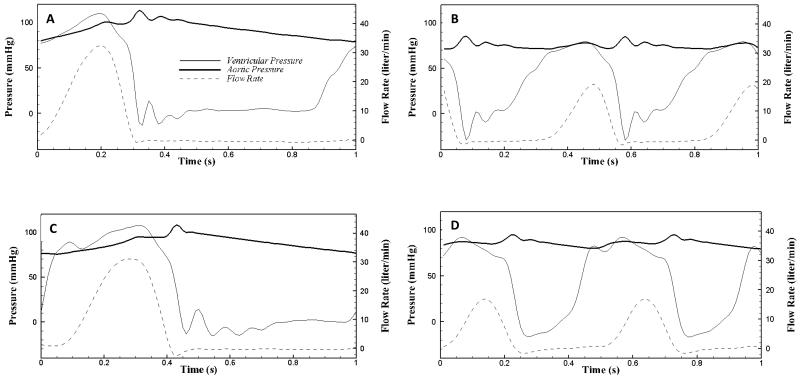
Two-dimensional in vitro particle image velocimetry (PIV) experiments were conducted to visualize fine scale aortic sinus hemodynamics. A 25 mm Medtronic Hancock II T505 (Medtronic, Minneapolis, MN, USA) porcine bioprosthetic aortic valve was mounted inside a clear, acrylic sinus chamber machined to mimic the outer walls of the aorta, based on Yap et al [27]. Dimensions of this chamber yielded a sinus radius of 19 mm, a sinus height of 21.6 mm, and an aortic radius of 12.7 mm. The chamber was inserted into the aortic position of a left heart simulator which also included a reservoir tank, mitral valve, pump, flow development region, systemic compliance chamber, and resistance valve (see Figure 1). Two different working fluids were used: saline and approximately 60/40 water/glycerin mixture by volume (density p = 1090 kg/m3 and kinematic viscosity = 3.88 cSt). An in-house LabVIEW program was used to control the pump which, in conjunction with compliance chamber and resistance valve, regulated the pressure and flow rate across the aortic valve. Flow rate was measured with an ultrasonic flow probe (Transonic Inc., Ithaca, NY), located between the pump and the aortic valve, and pressures were measured just upstream and downstream of the valve (see Figure 1) using Validyne pressure sensors (Validyne Engineering Corp., Northridge, CA). Flow and pressure waveforms were recorded in LabVIEW (see Figure 2) for both normal and elevated heart rates at physiological blood pressure (HR ~60/120 bpm; BP ~120/80 mmHg). The systolic time fraction was set to the nominal physiological values of 1/3 and 1/2 for the 60 bpm and 120bpm cases respectively. For each of the two blood analog fluids used, the flow loop was tuned to achieve physiologic pressures and flow rates. As such, there was a discrepancy in Reynolds and Womersley numbers between these two cases due to the contrasting viscosity of the fluids (see Table 2).
Figure 1.
Schematic of the left heart simulator.
Figure 2.
Pressure and flow waveforms for the (A) 60 bpm saline, (B) 120 bpm saline, (C) 60 bpm water-glycerin, and (D) 120 bpm water-glycerin experiments
Table 2.
Peak Reynolds number (based on bulk velocity and aorta diameter) and Womersley number for each case.
| Peak Reynolds number |
Womersley number |
|
|---|---|---|
|
Saline, 60bpm |
26,735 | 32 |
|
Saline, 120bpm |
15,874 | 45 |
|
Glycerin solution, 60bpm |
7,915 | ~16 |
|
Glycerin solution, 120bpm |
3,518 | ~23 |
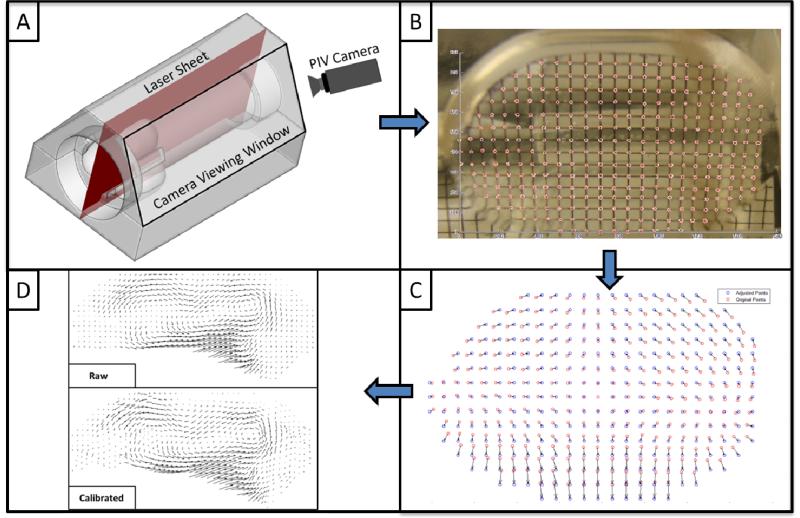
For visualization purposes, the flow was seeded with polyamide seeding particles (Dantec Dynamic Inc.) with a mean particle size of 20 μm. These particles were illuminated by a laser sheet, along the center plane of one sinus, created by a Nd:YLF Single Cavity Diode Pumped Solid State, High Repetition Rate Laser (Photonic Industries, Bohemia, NY) coupled with external spherical and cylindrical lenses. A high-speed CMOS camera (Photronix, Inc) was positioned at approximately a 60 degree angle to the laser sheet for optimal viewing of flow within a single sinus, with limited obstruction from valve stent posts (Figure 3).
Figure 3.
Schematic demonstrating the laser illumination with respect to (A) the acrylic aortic valve holder with sinuses; (B) sample calibration grid image; (C) displacement correction field from calibration grid; and (D) correction of raw vector fields.
Viewing Calibration
Due to differences in refractive index between air, acrylic, and the chosen blood analog fluid, an image calibration method was developed to “undeform” raw images. In order to accomplish this, a 1mm-resolution grid was inserted into the chamber along the centerline of the viewing sinus. A picture was taken from outside the sinus chamber and grid intersection points were picked manually. This array of points was then modified by translating individual points to form a regularly-spaced matrix, consistent with the actual 1mm-resolution grid, and vectors were computed from the deformed points to the “corrected” points. Bilinear interpolation was employed to compute the adjustment of any point within the sinus. Calibration was then applied to raw PIV images in order to shift them back to real “world coordinates” from their deformed “camera coordinates”. Figure 3 shows the difference in vector images corresponding to between original and corrected images to demonstrate the significance of this process.
Vector Calculation
The commercial PIV software, DaVis (LaVision, Germany) was used for data acquisition and processing. Velocity vectors were calculated using advanced PIV cross correlation approaches with a 50% overlap multi-pass approach starting from one 32×32 pixel interrogation followed by two 16×16 pixel interrogation passes. Post processing was performed using adaptive median filtering. The effective spatial resolution was 28 microns per pixel and the temporal resolution was 2000 Hz. Qualitative streak plots and quantitative vector plots were created for both normal and elevated heart rates. Additionally, the temporal complexity of turbulent coherent structures was examined by binning images across multiple frames. Bin sizes of 2.5, 10, and 50 milliseconds were used to elucidate both instantaneous and time-averaged flow features within the sinus. Binned techniques are well known to provide coherent structure information at different time-scales [28].
Leaflet Kinematics Tracking
Leaflet tip motion was tracked manually to within 56 μm accuracy (corresponding to +/− 2 pixels) across four trials (repeats) for each heart rate case. Radial distance from the aorta centerline was recorded and averaged across the four trials. From this data, average frequency and amplitude of leaflet oscillation were calculated as a function of time.
Results
The goal of this study was to visualize coherent vortex structures within the aortic sinus in order to give a better spatio-temporal picture of the leaflet mechanical environment and elucidate the impact of blood analog viscosity. Since this region is of high spatio-temporal complexity, sinus hemodynamics are best presented in both a qualitative and quantitative manner. Therefore, qualitative particle streak plots and quantitative vector plots were both created. Supplementary streak plot videos are included for both saline (60bpm and 120bpm) and water/glycerin (60bpm and 120bpm) as the working fluid, each for one entire cardiac cycle. A qualitative description is given first, based on these videos, followed by a more quantitative explanation of coherent structures based on time bin averaged velocity vectors and streamlines. Snapshots from qualitative videos are included to help clarify explanations of flow patterns that occur in the videos. Annotations included in these snapshots were manually superimposed (not PIV-calculated vectors) to point out flow structures that are generally more noticeable in the videos.
In addition, five key time points during the cardiac cycle have been identified, based on observation of unique flow patterns, to help simplify the explanation of complex sinus hemodynamics. These time points are as follows (times in reference to start of leaflet opening): early systole (75-100 ms, 60bpm; 30-50 ms, 120bpm), mid systole (150-175 ms, 60bpm; 75-95 ms, 120bpm), late systole (275-300 ms, 60bpm; 120-140 ms), early diastole (400-425 ms, 60bpm; 190-210 ms, 120bpm), and mid/late diastole (600-700 ms, 60bpm; 300-350 ms, 120bpm).
Qualitative Results - Saline
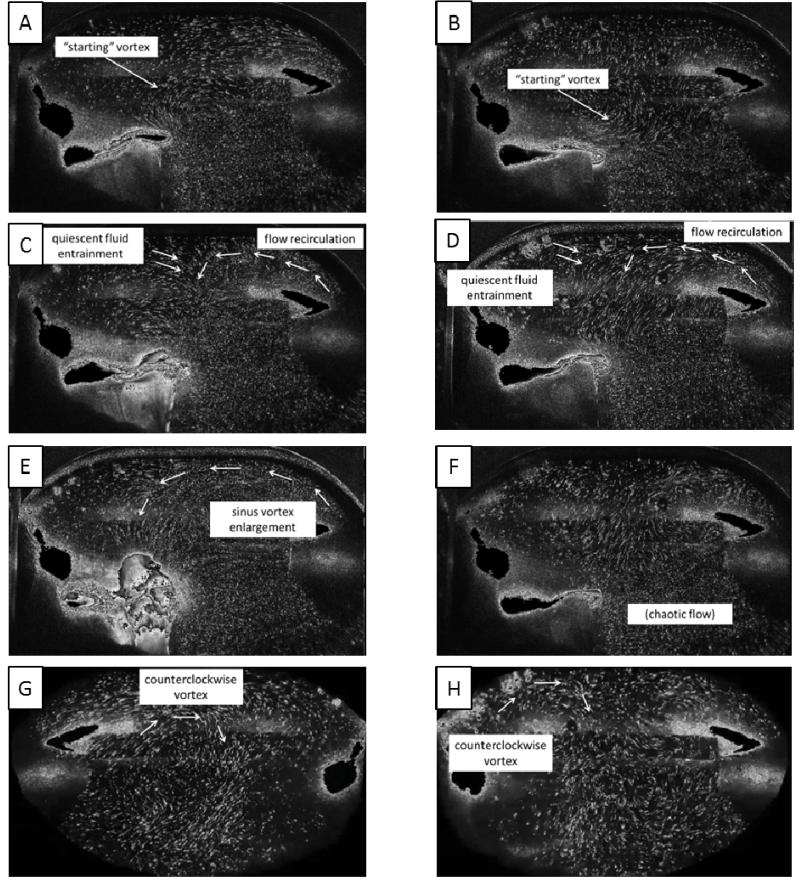
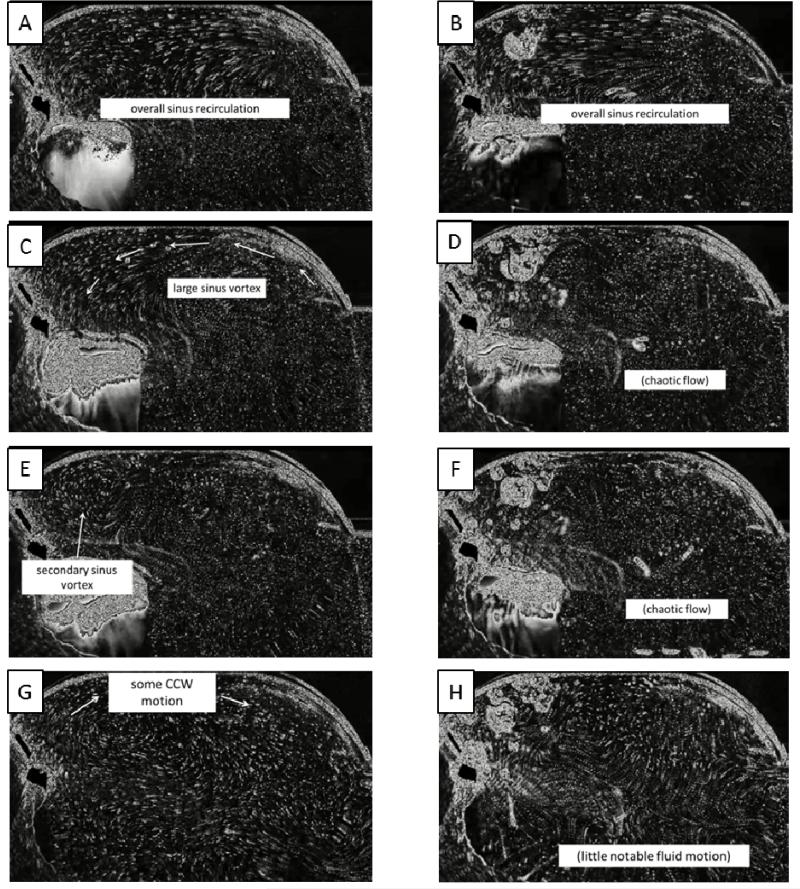
As seen in the streak plot videos, during early systole, after the valve has fully opened, a “starting” vortex sheds off the leaflet tip (Figures 4A and 4B), and it migrates with the flow toward the downstream wall of the sinus. Interaction of this vortex with the sinus wall helps drive a recirculating flow in the downstream region of the sinus. These patterns are apparent in both the 60 and 120 bpm cases.
Figure 4.
Qualitative flow descriptions for saline at 60 bpm (left column) and 120 bpm (right column)
Toward mid systole, a more noticeable overall sinus vortex develops which appears to be driven by the high-velocity free stream flow. Some secondary flow becomes visible as the primary vortex causes some entrainment of quiescent fluid from the upstream end of the sinus (Figures 4C and 4D). Also at this point, subtle differences between normal and elevated heart rates start to become evident. The primary vortex, present in both cases, is slightly smaller in the 120 bpm case and also appears to be positioned more near the downstream end of the sinus, although a much more chaotic sinus environment at elevated heart rate makes determination of coherent structures difficult.
During late systole, the primary vortex reaches deeper into the upstream end of the sinus, an event much more noticeable in the normal heart rate case (Figures 4E and 4F). This may be due to the limited time duration that the leaflets are open when the heart rate is elevated. As the leaflets begin to close, a secondary vortex of opposite rotation direction from the primary vortex forms due to accumulated momentum from previously mentioned entrainment.
As early diastole begins, just after leaflet closure, a clockwise-rotating vortex continues to build near the base (lower half) of the leaflet. This rotation eventually grows to fill the entire sinus during mid/late diastole (Figures 4G and 4H). Again, due to the limited time duration and also as a byproduct of lower flow rate, overall fluid velocities within the sinus appear lower in the 120 bpm case. Near the end of diastole there is little fluid motion within the sinus.
Qualitative Results - Water/Glycerin Mixture
Many of the same general flow patterns occur when a water/glycerin mixture is used as the working fluid. During early systole a “starting” vortex is still seen to shed off the leaflet tip and cause some recirculation in the downstream end of the sinus for both heart rate cases (Figures 5A and 5B). At mid systole a relatively smooth sinus vortex is prevalent for the 60bpm case whereas flow is much more unsteady in the 120bpm case (Figures 5C and 5D). By the end of systole, a secondary clockwise vortex at the upstream end of the sinus accompanies the main sinus vortex for the normal case while flow is still chaotic in the elevated case (Figures 5E and 5F). Immediately after leaflet closure there is some noticeable clockwise rotation that fills the sinus for the 60bpm case, but otherwise flow is relatively stagnant during all of diastole for both heart rates (Figures 5G and 5H).
Figure 5.
Qualitative flow descriptions for water-glycerin solution at 60 bpm (left column) and 120 bpm (right column)
Quantitative Results - Saline
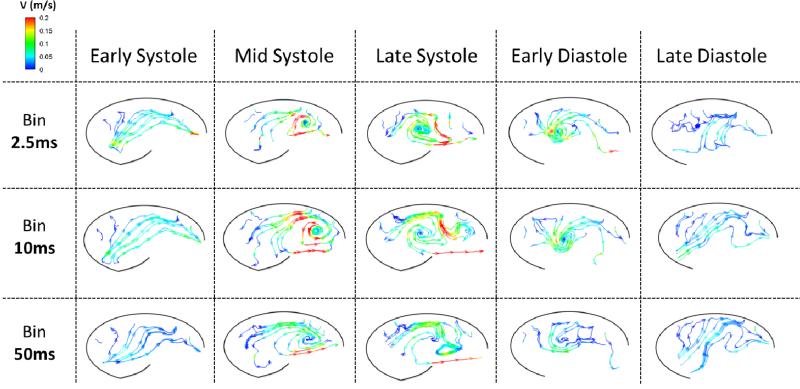
In order to capture a range of temporal scales, vector plots were created by binning different numbers of frames (See exemplary vector videos for the 60bpm saline case as supplementary videos). This was done across one cardiac cycle and videos of velocity vectors were created for bin sizes of 5, 20, and 100 frames (2.5 ms, 10 ms, and 50 ms, respectively). The effects of leaflet flutter during systole can clearly be seen when the bin is across 5 frames, however these effects are less noticeable at 20 and almost completely imperceptible when averaged across 100 frames at a time. In addition, a much more coherent sinus vortex can be seen when a larger bin is employed, but this also leads to smoothing out of smaller scale features. Diastolic flow patterns display much less spatio-temporal complexity. Specifically, there is weak clockwise circulation that develops just after leaflet closure and grows to envelop the entire sinus for the rest of diastole. Due to this relatively static vorticity pattern throughout diastole, varying bin size has less of an impact during this phase.
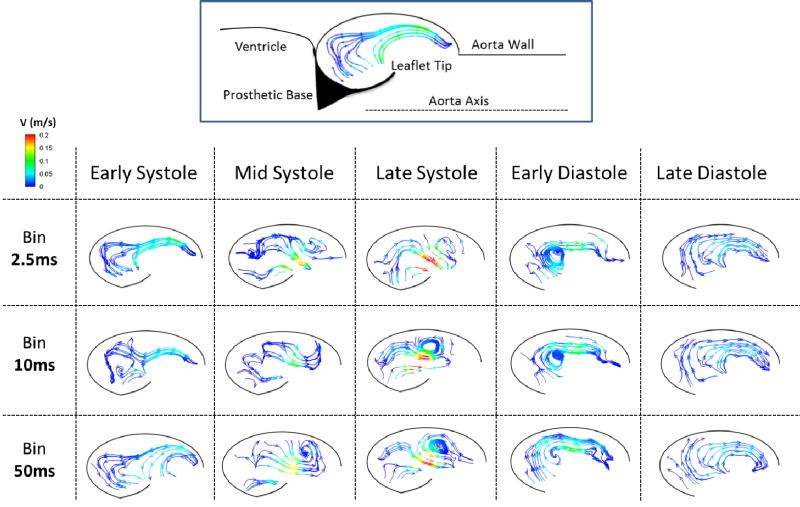
Streamlines were also created for these three different bin sizes and are presented at the five key time steps mentioned above. Figure 6 shows flow patterns for the regular heart rate case. In general, as the bin size is increased, the flow appears much smoother. Hemodynamics are time-averaged and therefore random turbulent fluctuations are cancelled out, yielding a smooth sinus vortex with a peak velocity magnitude of about 0.2 m/s for all bin sizes. Again, times of more complex flow are most impacted by changing bin size, which is evident by the similarities that exist at early systole versus the relatively large contrast between bin sizes during late systole. One flow feature apparent at all bin sizes is the entrainment of quiescent fluid from the upstream portion of the sinus past the leaflet and into the freestream flow, a trend which is especially noticeable during mid and late systole. During diastole, a vortex develops near the leaflet with an opposite rotation direction to that of the main systolic sinus vortex, and this diastolic vortex expands to fill the sinus. This initial vortex quickly dissipates, which is why it is more clearly seen at smaller bin sizes. The similarity across bin sizes at mid/late diastole indicates a temporally large-scale clockwise rotation within the entire sinus.
Figure 6.
Instantaneous streamlines colored by velocity magnitude for the 60bpm saline experiment corresponding to time averaged ‘bins’ (rows) at different phases in the cardiac cycle (columns).
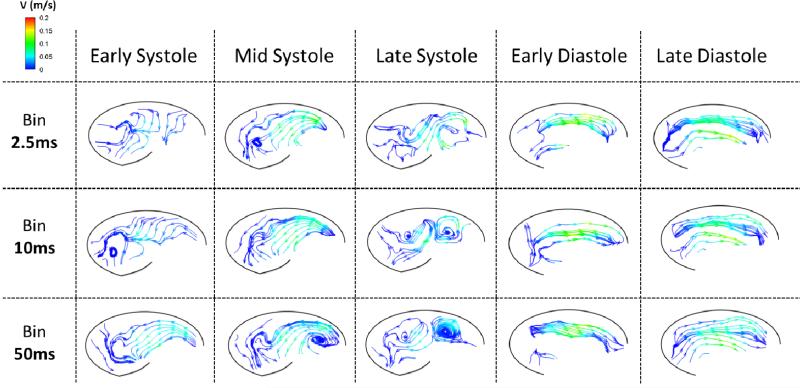
Figure 7 displays streamlines at the same time points and bin sizes as Figure 6 but for the case of elevated heart rate. Many similarities between these two cases exist, such as the development of a systolic vortex at the downstream end of the sinus, clockwise flow during diastole, and a general decrease in complexity as bin size is increased. Some differences are present, though. For example, a secondary, clockwise-rotating vortex develops at the upstream end of the sinus at late systole, which is not present in the normal heart rate case. Additionally, velocity magnitude is significantly lower during tachycardia due to a reduction in flow rate, with peak systolic velocity equal to approximately 0.15 m/s. Just after leaflet closure, the initial clockwise vortex initiated during late systole has already dissipated and the dominating flow during all of diastole is the same as that during mid/late diastole for the normal heart rate case.
Figure 7.
Instantaneous streamlines colored by velocity magnitude for the 120bpm saline experiment corresponding to time averaged ‘bins’ (rows) at different phases in the cardiac cycle (columns).
Quantitative Results - Water/Glycerin Mixture
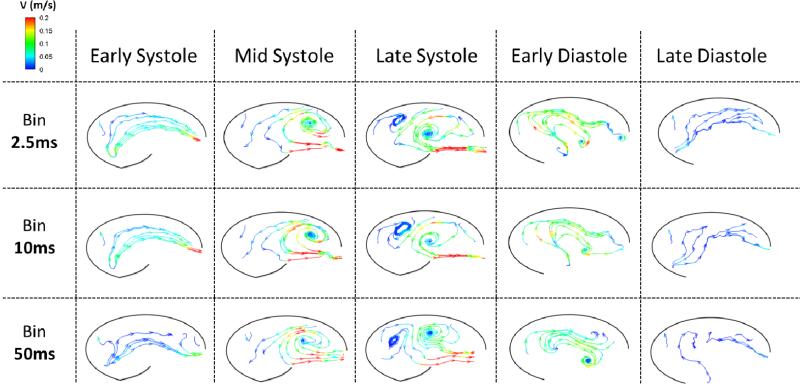
There was strong similarity across different bin sizes when water/glycerin was used, so vector videos are not presented for this fluid. However, small effects due to binning can still be seen in streamline plots for normal (Figure 8) and elevated (Figure 9) heart rates. Figure 8 shows a relatively strong sinus vortex that develops near the downstream end of the sinus and moves to the center of the sinus during systole for the normal heart rate case. Peak velocity within the sinus is around 0.2 m/s. There is a secondary vortex that forms at the upstream end of the sinus near the end of systole. General clockwise fluid motion is present throughout the sinus during early diastole, and almost all of this velocity is diffused by the end of diastole.
Figure 8.
Instantaneous streamlines colored by velocity magnitude for the 60bpm water-glycerin experiment corresponding to time averaged ‘bins’ (rows) at different phases in the cardiac cycle (columns).
Figure 9.
Instantaneous streamlines colored by velocity magnitude for the 120bpm water-glycerin experiment corresponding to time averaged ‘bins’ (rows) at different phases in the cardiac cycle (columns).
In the elevated heart rate case, Figure 9 shows the development of a slightly more turbulent sinus vortex. This vortex, as in the regular heart rate case, forms near the downstream end of the sinus and migrates upstream to the middle of the sinus as systole progresses. Velocity magnitudes within the sinus are similar at a maximum of about 0.2 m/s. One difference from the 60bpm case is that there is no secondary circulation near the base of the leaflet during systole. Diastolic flow patterns initially show some clockwise movement, which is quickly dissipated so that very little fluid motion is present at the end of diastole.
Leaflet Kinematics
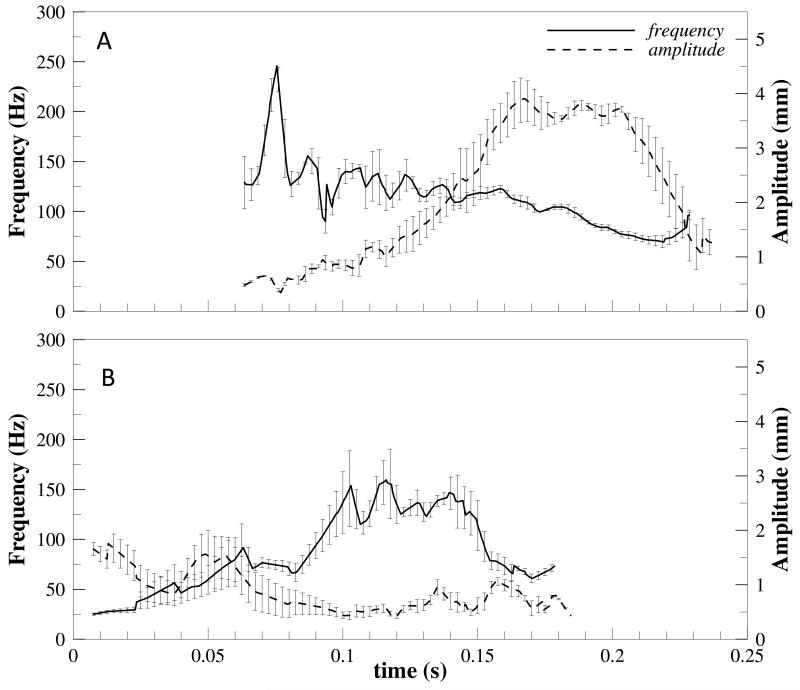
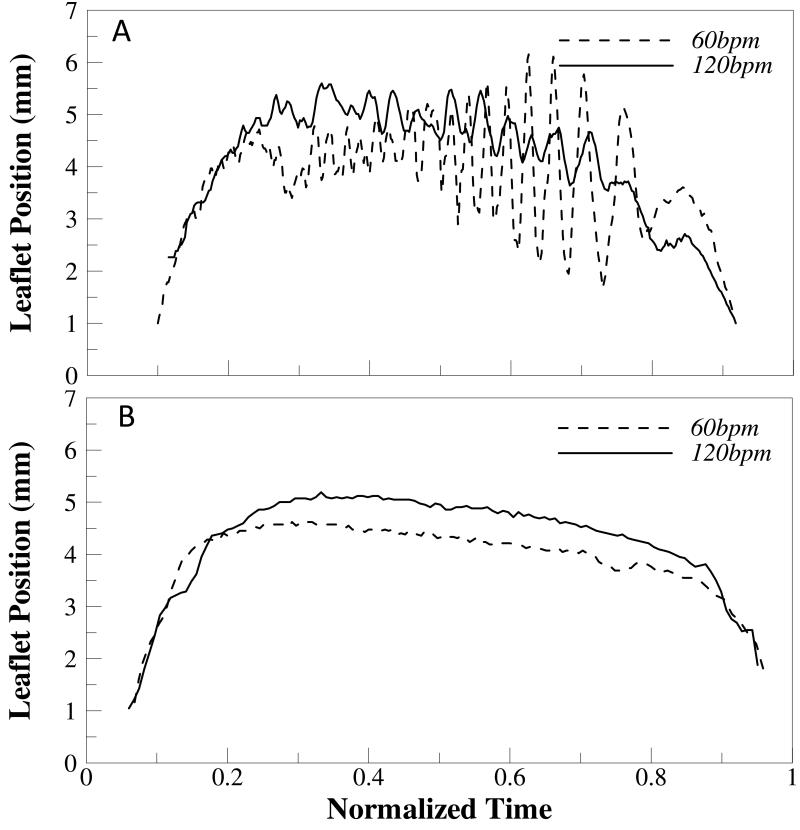
There is significant leaflet flutter present during systole in both the regular and elevated heart rate cases when saline is used as the working fluid. In the regular heart rate case, the leaflet starts to flutter just after fully opening at a relatively high frequency (~200Hz) and low amplitude (~0.5mm). These trends then reverse toward late systole as the frequency decreases (~50-100Hz) and amplitude of oscillation increases (~4mm) (see Figure 10). In the elevated heart rate case, results are similar but highly variable as indicated by the increased height of error bars in Figure 10b. However, it does appear that leaflet flutter frequency slightly increases throughout systole while amplitude decreases for the elevated heart rate case. When a water/glycerin mixture was used as the working fluid, no leaflet flutter was noticed. Figure 11 demonstrates this by showing radial leaflet position for all cases over time during systole.
Figure 10.
Leaflet tip oscillation frequency and amplitude for the saline experiment at heart rates of (A) 60bpm and (B) 120bpm.
Figure 11.
Leaflet tip position from centerline as a function of normalized time (0=opening; and 1= closing) for (A) saline and (B) water-glycerin experiments.
Discussion
Hemodynamic Complexity
Due to the relatively high spatio-temporal resolution of this study, we were able to elucidate novel fine-scale hemodynamics within the aortic sinus. For the saline case, flow is generally turbulent throughout systole so there are unsteady and aperiodic fluctuations within the sinus and also wide variability in the shape of the main sinus vortex. This can be clearly attributed to the higher Reynolds and Womersley numbers (Table 2). However, by binning across multiple frames we were able to replicate the smooth sinus vortex demonstrated in a number of previous studies (including 4D MRI) that lacked spatio-temporal resolution as well as in our study using water/glycerin. Likewise, some patterns, such as the growth of the sinus vortex until late systole, are present in this study as well as earlier studies [29]. Still, there exist differences between our water/glycerin results and these previous studies, most notably the size of the main sinus vortex. In this study, the vortex does migrate to the center of the sinus, but it still does not encompass the entire sinus. In fact, a secondary vortex of opposite rotation direction forms in the upstream end of the sinus for the 60bpm heart rate case. One likely reason for this discrepancy is the difference in resolution between the present study and many others. For example, Kilner et al. [30] were only able to capture 16 frames across the entire cardiac cycle (40-60 ms intervals).
Regular vs Elevated Heart Rate
While similar flow patterns exist, there are key hemodynamic differences between the regular and elevated heart rate conditions. A relatively large scale sinus vortex is present in both cases, but its peak size is smaller for the elevated heart rate condition based on visual observation. Similarly, velocity magnitude is generally lower at all points within the sinus throughout systole when heart rate is increased. Both of these trends are likely influenced by the decreased systolic time duration in the elevated heart rate condition, which does not allow the main sinus vortex to develop as much as the baseline case (although decreased flow at elevated heart rates also plays a role). One other key difference between these two conditions is the clockwise-rotating vortex that develops during late systole when heart rate is increased. This most likely occurs since the main sinus vortex is positioned closer to the downstream end of the sinus, so there is still room in the upstream portion of the sinus for a secondary opposite vortex to form even for the physiological Reynolds number. A result of this is that the velocity direction near the leaflet reverses direction due to this secondary rotation – a trend that could have implications for calcification.
Saline vs Water/Glycerin Mixture
There were a few key differences that occurred when using two separate working fluids while matching physiological criteria but breaking dynamic similarity. In general, vortex patterns were much smoother when a water/glycerin mixture was used as opposed to saline as expected. This difference is supported by our results across multiple bin sizes – large differences were present at different temporal scales for saline whereas they were not for water/glycerin – and is likely due to the lower Reynolds number of the water/glycerin mixture. Likewise, another interesting aspect of this study was leaflet motion. All saline trials showed significant leaflet flutter during systole, while no water/glycerin trials demonstrated any noticeable flutter.
Limitations
There are two major limitations of this study. The first is the use of a rigid aorta and aortic root. While this structure is compliant in nature, its movement is minimal compared to the highly dynamic leaflets and therefore not expected to play a large role in sinus hemodynamics. The second major limitation is the inability to capture the full 3D sinus hemodynamics. It is clear from the videos that there exists significant three-dimensional fluid motion, however novel flow features have still been captured. Future work will involve computational simulations to help elucidate these 3D flow patterns.
Conclusion
In this study, we elucidated complex sinus hemodynamics at a higher spatio-temporal resolution than previously shown for a compliant valve, which yielded novel flow patterns for a baseline case. We also demonstrated unique flow patterns for the case of elevated heart rate not present in the baseline condition that could have implications for leaflet calcification. Additionally, the effects of viscosity on sinus vorticity dynamics and leaflet kinematics were demonstrated and it was demonstrated that this factor could have major consequences for studies that use a non-physiologic blood analog as the working fluid without satisfying dynamic similarity. Incidentally, this study demonstrates a need for better computational simulations in order to capture time-resolved mechanical stress and fluid wall shear stress on the aortic side of the valve leaflet.
Supplementary Material
Acknowledgement
The authors gratefully acknowledge funding from National Institutes of Health (NIH) under Award Number R01HL119824, and the American Heart Association under award 11SDG5170011. The content is solely the responsibility of the authors and does not necessarily represent the official views of the NIH.
References
- 1.Freeman RV, Otto CM. Spectrum of calcific aortic valve disease - Pathogenesis, disease progression, and treatment strategies. Circulation. 2005;111(24):3316–3326. doi: 10.1161/CIRCULATIONAHA.104.486738. [DOI] [PubMed] [Google Scholar]
- 2.Hjortnaes J, New SEP, Aikawa E. Visualizing novel concepts of cardiovascular calcification. Trends in Cardiovascular Medicine. 2013;23(3):71–79. doi: 10.1016/j.tcm.2012.09.003. [DOI] [PMC free article] [PubMed] [Google Scholar]
- 3.Yip CYY, Simmons CA. The aortic valve microenvironment and its role in calcific aortic valve disease. Cardiovascular Pathology. 2011;20(3):177–182. doi: 10.1016/j.carpath.2010.12.001. [DOI] [PubMed] [Google Scholar]
- 4.Sucosky P, et al. Altered Shear Stress Stimulates Upregulation of Endothelial VCAM-1 and ICAM-1 in a BMP-4-and TGF-beta 1-Dependent Pathway. Arteriosclerosis Thrombosis and Vascular Biology. 2009;29(2):254–260. doi: 10.1161/ATVBAHA.108.176347. [DOI] [PMC free article] [PubMed] [Google Scholar]
- 5.Sun L, Rajamannan NM, Sucosky P. Design and Validation of a Novel Bioreactor to Subject Aortic Valve Leaflets to Side-Specific Shear Stress. Ann Biomed Eng. 2011;39(8):2174–2185. doi: 10.1007/s10439-011-0305-6. [DOI] [PMC free article] [PubMed] [Google Scholar]
- 6.Sun L, Chandra S, Sucosky P. Ex Vivo Evidence for the Contribution of Hemodynamic Shear Stress Abnormalities to the Early Pathogenesis of Calcific Bicuspid Aortic Valve Disease. Plos One. 2012;7(10) doi: 10.1371/journal.pone.0048843. [DOI] [PMC free article] [PubMed] [Google Scholar]
- 7.Miller JD, Weiss RM, Heistad DD. Calcific Aortic Valve Stenosis: Methods, Models, and Mechanisms. Circulation Research. 2011;108(11):1392–1412. doi: 10.1161/CIRCRESAHA.110.234138. [DOI] [PMC free article] [PubMed] [Google Scholar]
- 8.Balachandran K, et al. Elevated Cyclic Stretch Induces Aortic Valve Calcification in a Bone Morphogenic Protein-Dependent Manner. American Journal of Pathology. 2010;177(1):49–57. doi: 10.2353/ajpath.2010.090631. [DOI] [PMC free article] [PubMed] [Google Scholar]
- 9.Fisher CI, Chen J, Merryman WD. Calcific nodule morphogenesis by heart valve interstitial cells is strain dependent. Biomechanics and Modeling in Mechanobiology. 2013;12(1):5–17. doi: 10.1007/s10237-012-0377-8. [DOI] [PMC free article] [PubMed] [Google Scholar]
- 10.Saikrishnan N, et al. In Vitro Characterization of Bicuspid Aortic Valve Hemodynamics Using Particle Image Velocimetry. Ann Biomed Eng. 2012;40(8):1760–1775. doi: 10.1007/s10439-012-0527-2. [DOI] [PubMed] [Google Scholar]
- 11.Leo HL, et al. Fluid dynamic assessment of three polymeric heart valves using particle image velocimetry. Ann Biomed Eng. 2006;34(6):936–952. doi: 10.1007/s10439-006-9117-5. [DOI] [PubMed] [Google Scholar]
- 12.Querzoli G, Fortini S, Cenedese A. Effect of the prosthetic mitral valve on vortex dynamics and turbulence of the left ventricular flow. Physics of Fluids. 2010;22(4) [Google Scholar]
- 13.Falahatpisheh A, Kheradvar A. High-speed particle image velocimetry to assess cardiac fluid dynamics in vitro: From performance to validation. European Journal of Mechanics B-Fluids. 2012;35:2–8. [Google Scholar]
- 14.Toger J, et al. Vortex Ring Formation in the Left Ventricle of the Heart: Analysis by 4D Flow MRI and Lagrangian Coherent Structures. Ann Biomed Eng. 2012;40(12):2652–2662. doi: 10.1007/s10439-012-0615-3. [DOI] [PubMed] [Google Scholar]
- 15.Bellofiore A, Donohue EM, Quinlan NJ. Scale-up of an unsteady flow field for enhanced spatial and temporal resolution of PIV measurements: application to leaflet wake flow in a mechanical heart valve. Experiments in Fluids. 2011;51(1):161–176. [Google Scholar]
- 16.Kaminsky R, et al. Flow visualization through two types of aortic prosthetic heart valves using stereoscopic high-speed particle image velocimetry. Artificial Organs. 2007;31(12):869–879. doi: 10.1111/j.1525-1594.2007.00471.x. [DOI] [PubMed] [Google Scholar]
- 17.Strecker C, et al. Flow-sensitive 4D MRI of the thoracic aorta: Comparison of image quality, quantitative flow, and wall parameters at 1.5 T and 3 T. Journal of Magnetic Resonance Imaging. 2012;36(5):1097–1103. doi: 10.1002/jmri.23735. [DOI] [PubMed] [Google Scholar]
- 18.Markl M, et al. 4D flow MRI. Journal of Magnetic Resonance Imaging. 2012;36(5):1015–1036. doi: 10.1002/jmri.23632. [DOI] [PubMed] [Google Scholar]
- 19.Weinberg EJ, et al. Hemodynamic Environments from Opposing Sides of Human Aortic Valve Leaflets Evoke Distinct Endothelial Phenotypes In Vitro. Cardiovascular Engineering. 2010;10(1):5–11. doi: 10.1007/s10558-009-9089-9. [DOI] [PMC free article] [PubMed] [Google Scholar]
- 20.Peacock JA. AN INVITRO STUDY OF THE ONSET OF TURBULENCE IN THE SINUS OF VALSALVA. Circulation Research. 1990;67(2):448–460. doi: 10.1161/01.res.67.2.448. [DOI] [PubMed] [Google Scholar]
- 21.Weiler M, et al. Regional analysis of dynamic deformation characteristics of native aortic valve leaflets. Journal of Biomechanics. 2011;44(8):1459–1465. doi: 10.1016/j.jbiomech.2011.03.017. [DOI] [PMC free article] [PubMed] [Google Scholar]
- 22.Yap CH, Dasi LP, Yoganathan AP. Dynamic Hemodynamic Energy Loss in Normal and Stenosed Aortic Valves. Journal of Biomechanical Engineering-Transactions of the Asme. 2010;132(2) doi: 10.1115/1.4000874. [DOI] [PubMed] [Google Scholar]
- 23.Yap CH, et al. Dynamic deformation characteristics of porcine aortic valve leaflet under normal and hypertensive conditions. American Journal of Physiology-Heart and Circulatory Physiology. 2010;298(2):H395–H405. doi: 10.1152/ajpheart.00040.2009. [DOI] [PubMed] [Google Scholar]
- 24.Dumont K, et al. Design of a new pulsatile bioreactor for tissue engineered aortic heart valve formation. Artificial Organs. 2002;26(8):710–714. doi: 10.1046/j.1525-1594.2002.06931_3.x. [DOI] [PubMed] [Google Scholar]
- 25.Ruiz P, et al. In Vitro Cardiovascular System Emulator (Bioreactor) for the Simulation of Normal and Diseased Conditions With and Without Mechanical Circulatory Support. Artificial Organs. 2013;37(6):549–560. doi: 10.1111/aor.12109. [DOI] [PubMed] [Google Scholar]
- 26.Beelen MJ, Neerincx PE, van de Molengraft MJG. Control of an air pressure actuated disposable bioreactor for cultivating heart valves. Mechatronics. 2011;21(8):1288–1297. [Google Scholar]
- 27.Yap CH, et al. Experimental measurement of dynamic fluid shear stress on the aortic surface of the aortic valve leaflet. Biomechanics and Modeling in Mechanobiology. 2012;11(1-2):171–182. doi: 10.1007/s10237-011-0301-7. [DOI] [PMC free article] [PubMed] [Google Scholar]
- 28.Chrisohoides A, Sotiropoulos F. Experimental visualization of Lagrangian coherent structures in aperiodic flows. Physics of Fluids. 2003;15(3):L25–L28. [Google Scholar]
- 29.Kvitting JPE, et al. Flow patterns in the aortic root and the aorta studied with time-resolved, 3-dimensional, phase-contrast magnetic resonance imaging: Implications for aortic valve-sparing surgery. Journal of Thoracic and Cardiovascular Surgery. 2004;127(6):1602–1607. doi: 10.1016/j.jtcvs.2003.10.042. [DOI] [PubMed] [Google Scholar]
- 30.Kilner PJ, et al. HELICAL AND RETROGRADE SECONDARY FLOW PATTERNS IN THE AORTIC-ARCH STUDIED BY 3-DIRECTIONAL MAGNETIC-RESONANCE VELOCITY MAPPING. Circulation. 1993;88(5):2235–2247. doi: 10.1161/01.cir.88.5.2235. [DOI] [PubMed] [Google Scholar]
Associated Data
This section collects any data citations, data availability statements, or supplementary materials included in this article.


