

Abstract
It is well established that risk for developing psychosis is largely mediated by the influence of genes, but identifying precisely which genes underlie that risk has been problematic. Focusing on endophenotypes, rather than illness risk, is one solution to this problem. Impaired cognition is a well-established endophenotype of psychosis. Here we aimed to characterize the genetic architecture of cognition using phenotypically detailed models as opposed to relying on general IQ or individual neuropsychological measures. In so doing we hoped to identify genes that mediate cognitive ability which might also contribute to psychosis risk. Hierarchical factor models of genetically clustered cognitive traits were subjected to linkage analysis followed by QTL region-specific association analyses in a sample of 1,269 Mexican American individuals from extended pedigrees. We identified four genome wide significant QTLs, two for working and two for spatial memory, and a number of plausible and interesting candidate genes. The creation of detailed models of cognition seemingly enhanced the power to detect genetic effects on cognition and provided a number of possible candidate genes for psychosis.
Keywords: schizophrenia, genetics, cognition, GWAS, linkage
Introduction
Genetic factors are important for developing a psychotic disorder, the heritability for schizophrenia and bipolar disorder, the two most common psychotic illnesses, are both above 0.80 (Sullivan et al., 2003; McGuffin et al., 2003). While recent genome-wide association studies have successfully localized a number of statically significant risk loci, these findings only explain a fraction of the genetic variance associated with psychotic illnesses. A complementary approach for identifying psychosis risk genes is to use focus on endophenotype (Gottesman and Gould, 2003), heritable non-diagnostic measures that are genetically related to the illness. Comprehensive neuropsychological research has established cognitive impairment as an intrinsic feature of psychosis (Reichenberg and Harvey, 2007). Impairments are evident in numerous cognitive domains but one of the most consistently reported is in memory, particularly in working and spatial memory (Park and Holzman, 1992; Heinrichs and Zakzanis, 1998; Lee and Park, 2005; Glahn et al., 2003; Glahn et al., 2006). Cognition, and more specifically memory, has utility as an endophenotype of psychosis. There is substantial overlap between the genetic factors that mediate psychosis risk and those that mediate both general cognition and working memory ability (Toulopoulou et al., 2007; Toulopoulou et al., 2010; Owens et al., 2011). Plus, there are clear familial effects such that unaffected relatives exhibit spatial memory impairment that is intermediate between that of affected probands and healthy controls (Glahn et al., 2010; Glahn et al., 2007a; Bora et al., 2009; Hoff et al., 2005; Sitskoorn et al., 2004). Therefore, isolating genes for memory may be a fruitful approach for identifying psychosis risk genes.
Despite high heritability estimates for cognition and general intelligence (which vary between 50–80%), multiple attempts to isolate specific causative genes have been met with difficulty (Deary, 2012). The reasons for this are twofold. Firstly, the high heritability estimates reported for intelligence reflect the overall cumulative genetic effect on a trait but do not reveal the subtle complexities therein or the specific composition and architecture of the underlying causal genes (Almasy, 2003). Secondly there is substantial phenotypic complexity associated with intelligence which has been largely overlooked in molecular genetic studies, with most gene discovery studies focusing instead on measures of general IQ or individual neuropsychological tasks (Deary et al., 2009). Over a century of rigorous investigation into the sources of individual variation in cognitive ability has resulted in a consensus that the structure of cognition is best described as a three-tier taxonomy. This taxonomy is characterized by a general, or ‘g’, factor that subsumes several strongly and positively correlated cognitive domains onto which load individual neuropsychological tasks (Carroll, 1993). Typically, g accounts for over half of individual differences in cognitive ability but individual cognitive domains also reflect domain-specific abilities (Plomin and Spinath, 2002). This view is largely consistent with findings from cognitive neuroscience that suggest that specific domains are associated with relatively distinct brain circuits (Lenartowicz et al., 2010). This line of thought suggests that identifying genes that influence distinct cognitive domains may be more tractable than finding genes for general intelligence (van der Sluis et al., 2010), particularly given that a domain-specific approach is essentially a multivariate one and so it remains statistically more powerful than univariate analyses of individual neuropsychological tasks (Bearden and Freimer, 2006).
We report on linkage and association analyses for cognitive domains derived from neuropsychological measures in a sample of 1,269 individuals from large extended pedigrees. The aim of this study was to characterize in detail the genetic basis of cognition and in so doing, isolate potential risk genes for psychosis. We implemented an approach whereby individual traits were genetically clustered (versus the more conventional approach utilizing phenotype clustering) to create phenotypically detailed and genetically informed models of cognition including both a g factor and specific cognitive domains. These factors were then included in linkage and association analyses to reveal a series of genomic regions for distinct aspects of cognition.
Methods
Participants
The sample comprised 1,269 Mexican American individuals from extended pedigrees (75 families, average size 16.28 people, range = 2–131) as well as 58 spouses with no biological relationship to other individuals in the study. The sample was 63% female and had a mean age of 44.78 (SD = 15.19; range = 18–97). Individuals in this San Antonio Family Study cohort have actively participated in research for over 18 years and were randomly selected from the community with the constraints that they are of Mexican American ancestry, part of a large family, and live within the San Antonio region (see (Olvera et al., 2011) for recruitment details). The Mini International Psychiatric Interview (MINI-Plus) was administered to all individuals. The prevalence of psychiatric disorders in the present sample are as follows: Lifetime Depression (33%), Recurrent Depression (18%), Anxiety Disorders (19%), (Hypo)Mania (2%), Dysthmia (0.5%), Alcohol Disorders (32%), Substance Disorders (13%), Schizoaffective Disorder (0.7%), Schizophrenia (0.5%).
All participants provided written informed consent before participating in any aspect of the study.
Neuropsychological Assessment
As part of the “Genetics of Brain Structure and Function” protocol, each participant was required to complete a 90-minute neuropsychological test battery consisting of standard and computerized measures (Glahn et al., 2010; Glahn et al., 2007b). Eighteen neurocognitive variables were derived from thirteen separate neuropsychological tests, including measures of attention, executive processing, working memory, declarative memory, language processing, intelligence and emotional processing (see Table 1). In addition, the vocabulary and matrix reasoning subtests of the WASI were administered and a formal IQ measure was derived. Subjects were tested in their choice of language, of the entire sample 9% were tested in Spanish and the remainder were tested in English.
Table 1.
Description and heritability of cognitive traits.
| Trait | Primary Dependent Measure | h2 | Standard Error |
p-value |
|---|---|---|---|---|
| Digit Symbol Correct | No. of correctly identified digit-symbol pairs in 90 sec | 0.55 | 0.059 | 3.88 × 10⁻²⁷ |
| Letter Number Sequencing | No. of correctly recalled number-letter strings in numerical and alphabetical order | 0.55 | 0.060 | 4.57 × 10⁻²⁶ |
| Trails B | Time needed to connect alternating letters and numbers | 0.55 | 0.066 | 8.99 × 10⁻²³ |
| Letter Fluency | No. of words, beginning with specific letter, generated in 60 sec | 0.54 | 0.059 | 1.23 × 10⁻²⁶ |
| Facial Memory | No. of faces recognized during the Penn Face Memory Test | 0.52 | 0.068 | 3.96 × 10⁻²⁰ |
| Digit Span Backwards | No. of correctly recalled digit strings in reverse order of presentation | 0.48 | 0.066 | 2.56 × 10⁻¹⁸ |
| Digit Span Forwards | No. of correctly recalled digit strings in their original order of presentation | 0.48 | 0.060 | 1.61 × 10⁻²⁰ |
| Digit Symbol Memory | No. of correctly remembered digit-symbol pairs upon task completion | 0.42 | 0.066 | 7.64 × 10⁻¹⁵ |
| CVLT Learn | No. of items recalled during 5 exposures of 16-word list of CVLT | 0.40 | 0.064 | 2.80 × 10⁻¹⁴ |
| CVLT Delay | No. of list items recalled after 20-min delay | 0.37 | 0.059 | 1.42 × 10⁻¹⁴ |
| PCET Correct | No. of correctly matched shapes on PCET | 0.37 | 0.056 | 2.72 × 10⁻¹⁶ |
| Category Fluency | No. of animal names generated in 60 sec | 0.36 | 0.065 | 1.91 × 10⁻¹² |
| Emotion Recognition | No. of emotions correctly identified | 0.33 | 0.067 | 8.96 × 10⁻¹⁰ |
| CPT False Alarms | No. of false alarms during 6-min identical pairs CPT | 0.30 | 0.066 | 8.13 × 10−09 |
| CPT Hits | No. of hits during 6-min identical pairs CPT | 0.30 | 0.064 | 1.14 × 10−08 |
| Trails A | Time needed to connect letters in ascending order | 0.29 | 0.063 | 1.16 × 10−08 |
| SCAP | No. of correct responses on a spatial delayed response test | 0.27 | 0.063 | 1.00 × 10−07 |
| CVLT Semantic | Proximal recall of semantically related list items during 5 repeated exposures of 16-word list | 0.22 | 0.056 | 7.00 × 10−07 |
Abbreviations: CPT, Continuous Performance Test; CVLT, California Verbal Learning Test; PCET, Penn Conditional Exclusion Test
Data Analysis
Genotyping
Subjects were genotyped for approximately one million SNPs using Illumina HumanHap550v3, HumanExon510Sv1, Human1Mv1 and Human1M-Duov3 BeadChips, according to the Illumina Infinium protocol (Illumina, San Diego, CA). SNP loci were checked for Mendelian consistency utilizing SimWalk2 (Sobel and Lange, 1996). SNPs or samples exhibiting high calling rate failures or requiring excessive blanking (i.e., if <95% of the genotypes are retained) were eliminated from analyses. Missing genotypes were imputed according to Mendelian laws based on available pedigree data using MERLIN (Abecasis et al., 2002). Maximum likelihood techniques, accounting for pedigree structure, were used to estimate allelic frequencies (Boehnke, 1991). Estimates of allelic frequencies were formally tested and found to be in Hardy-Weinberg equilibrium. For linkage analyses, multipoint identity-by-descent (IBD) matrices were calculated based on 28,387 SNPs selected from the 1M GWAS panel as follows. Using genotypes for 345 founders, SNPs on each chromosome were selected to be at least 1kb apart, MAF >= 5%, and LD within a 100kb sliding window not exceeding |rho| = 0.15. The resulting selection averaged 7–8 SNPs/centimorgan. For each centimorgan location in the genome, multipoint IBD probability matrices were calculated using a stochastic Markov Chain Monte Carlo procedure implemented in the computer package, LOKI (Heath, 1997).
Quantitative Genetic Analyses
All genetic analyses were performed in SOLAR (Almasy and Blangero, 1998). SOLAR implements a maximum likelihood variance decomposition to determine the contribution of genes and environmental influence to a trait by modeling the covariance among family members as a function of genetic proximity. The genetic contribution to a trait is represented by the heritability, or h2, index. First, univariate variance decomposition analysis was applied to all individual neuropsychological variables and any trait with a h2<0.20 was dropped from subsequent analyses. All traits were normalized using an inverse Gaussian transformation. Age, age2, sex, testing language and the presence of major depressive disorder or an anxiety disorder were included as covariates and the residuals were retained for later analysis. Second, bivariate analysis was applied to all pairs of variables where the phenotypic covariance between two traits was decomposed into its genetic and environmental constituents to determine the extent they are influenced by shared genetic effects (e.g. genetic correlation).
Cognitive Modeling Analysis
Hierarchical cluster analysis, as implemented in R (R Development Core Team, 2011), was applied to the estimated genetic correlation matrix (described above) to establish groups of genetically related cognitive traits. Traits that share the greatest degree of genetic overlap were clustered together in domain-specific factors. First, the genetic correlation matrix was converted into a matrix of dissimilarity scores by subtracting the absolute value of each correlation from 1. Agglomerative clustering was then applied to this matrix of distance scores. This method of clustering begins with n clusters where each cluster represents a single item then, at each step, two clusters are fused together in accordance with the distance values. This analysis was interpreted using a dendrogram plot where similar traits are on the same limb of the tree and distinctly different traits are placed on other limbs (Crawley, 2007).
The resultant clusters of traits were then fit as confirmatory factor models using Mplus (Muthén and Muthén, 2011). This analysis was applied to the residuals from the univariate genetic analysis (where the effects of age, sex and testing language were covaried). To appropriately estimate standard errors and X2 statistics, family structure was taken into account using the cluster command in Mplus. Each factor model was assessed in terms of both model fit and the strength and significance of the factor loadings. Typically a significant X2 is suggestive of poor model fit. However given the large sample size, less weight was attributed to this index (Kline, 2005). The included model fit estimates were as follows: X2, RMSEA, CFI, TLI and SRMR. For RMSEA a value which is below .05 is considered excellent fit. For CFI and TLI a value greater than .90 is indicative of good fit and of .95 excellent fit. For SRMR a value below .10 is considered a good fit. Once a factor model was established factor scores were derived for each individual participant and saved for subsequent analysis.
Two model types were fitted to the cognitive data. Both models included domain specific and general factors but the relationships between the factors differed in each model. First, a hierarchical model was fit. This model assumed that the individual cognitive domains represent highly correlated facets of general intelligence, or g. Second, a non-hierarchical bi-factor model where the overlap between individual cognitive tests is captured by a g factor along with specific uncorrelated factors which represent domain-specific cognitive abilities independent of g (Holzinger and Swineford, 1937).
Linkage and Genome Wide Association Analyses
Quantitative trait linkage analysis was performed to localize specific chromosomal locations influencing cognitive factors (Almasy and Blangero, 1998). Model parameters were estimated using maximum likelihood. The hypothesis of significant linkage was assessed by comparing the likelihood of a classical additive polygenic model with that of a model allowing for both a polygenic component and a variance component due to linkage at a specific chromosomal location (as evidenced by the location-specific identity-by-descent probability matrix). The LOD score, given by the log10 of the ratio of the likelihoods of the linkage and the polygenic model, served as the test statistic for linkage. Genome-wide thresholds for linkage evidence were computed with correction for both the number of loci tested per genome and the effective number of traits. Briefly, using a method derived from (Feingold et. al., 1993), genome-wide p-value thresholds were computed as a function of the average marker density (linkage SNPs per centiMorgan) and the mean recombination frequency given the complexity of the specific pedigrees used in this study; these p-values were then converted to LOD scores. In our case, a LOD of 1.69 is required for suggestive significance (likely to happen by chance less than once in a genome-wide scan) and a LOD of 2.9 is required for genome-wide significance. These thresholds per linkage scan were further penalized for the effective number of traits, calculated using the method outlined by Cheverud (2001). (Simply dividing by the total number of traits would be over-conservative to the extent that they are correlated.) Applying this method to the genetic correlations between the factor scores reveals that we have 3.86 effective traits. Any region demonstrating potential pleiotropic effects (i.e., linkage to multiple traits) was further investigated using bivariate linkage (Almasy et al., 1997). The null hypothesis of linkage of a particular locus to both traits was tested against the alternative of linkage to neither by comparing the likelihoods of the relevant nested models; this joint test can be more powerful than the respective univariate tests if the traits are genetically correlated. The ln(likelihood ratio) statistic for this test is distributed as a mixture of 1 and 2 df chi-squares (Self and Liang, 1987); this p-value is converted to a 1 df equivalent LOD for ease of comparison to the univariate linkage tests.
Any genomic region meeting genome-wide significance for linkage was further assessed using association analysis of the cognitive trait and the genetic variants encapsulated by the linkage peak; association models included both the fixed effect of the focal SNP and the random effects of local and polygenic heritability (Blangero, 1993). Statistical significance levels were established according to the effective number of tested variants given the linkage disequilibrium (LD) structure in the region (Moskvina and Schmidt, 2008). In more detail the pairwise genotypic correlations are calculated in an effort to establish the effective number of independent tests carried out during association analysis. The Moskvina and Schmidt (2008) method, is considered a conservative method and entails computing the eigenvalues of the genotypic correlation matrix. A corrected p-value is obtained from a Bonferroni correction based on the nominal alpha (= 0.05) and the total number of independent tests.
Results
Genetic Analysis of Cognitive Measures
Heritability estimates for individual cognitive measures are shown in Table 1. All cognitive traits were found to be moderately to strongly heritable. The estimated pair-wise phenotypic and genetic correlations are shown in Table S1. Phenotypic correlations are predominantly moderate to strong, of which a substantial amount is due to genetic overlap.
Cognitive Factor Models
Figure 1 shows the results of the hierarchical cluster analysis applied to the genetic correlation matrix. Four main clusters emerged from the data including: Verbal Memory, Working Memory, Spatial Memory, and Executive Function.
FIG. 1.
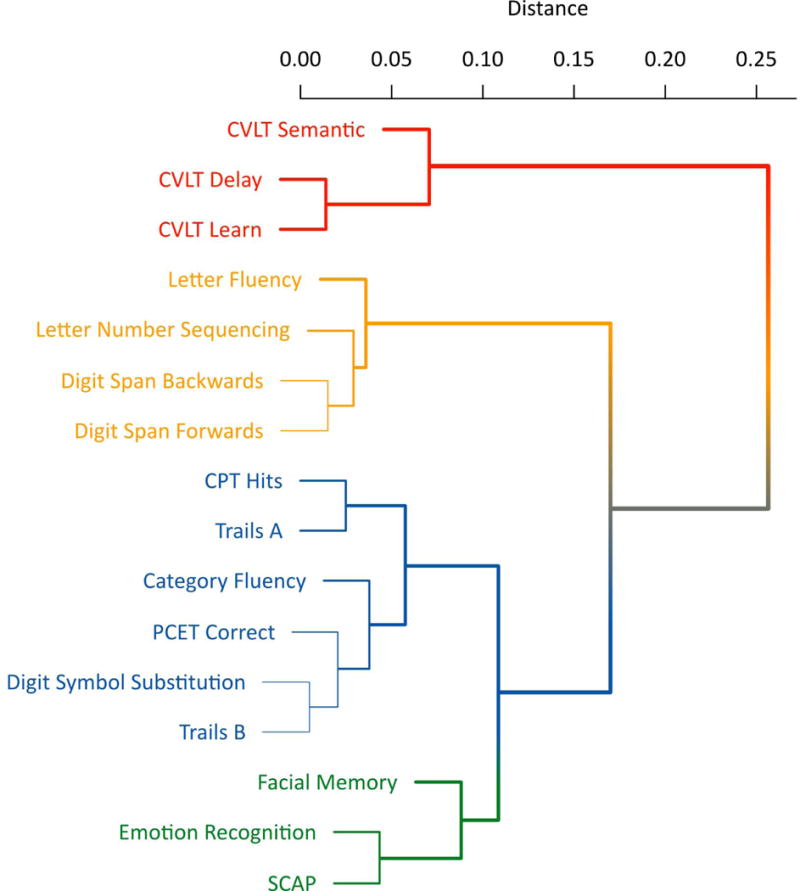
Dendrogram of the cluster analysis which depicts four clusters: verbal memory (red), working memory (yellow), executive function (blue) and spatial memory (green).
A model including the four clusters plus a g factor was fit to the neuropsychological data (see Figure 2A). The fit of this model was good, X2 was significant (X299= 343.850, p<.001) but other fit indices suggested that the model was a good fit (RMSEA = .049 (95%CI = .044 − .055, p = .579), CFI = .950, TLI = .940, SRMR = .042). All factor loadings were significant at the p<.001 level.
FIG. 2.
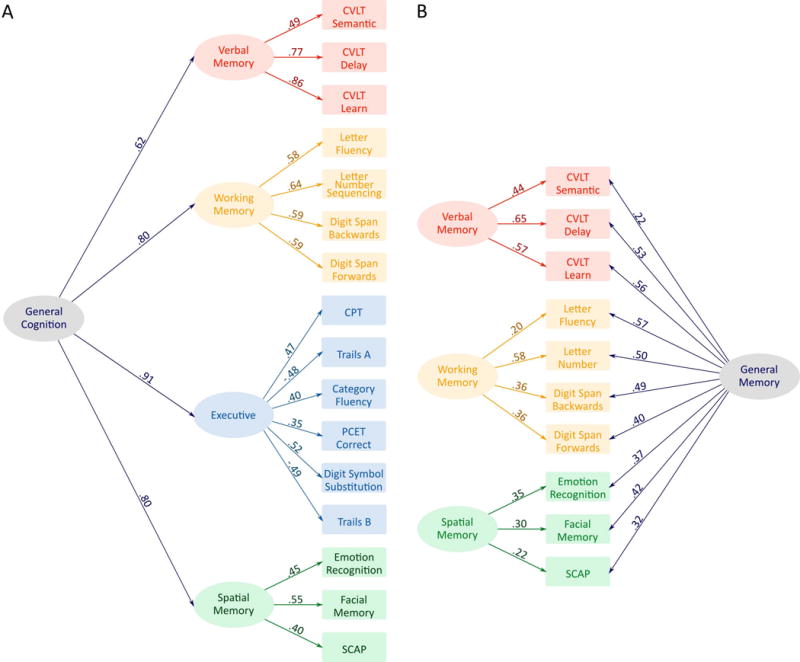
Statistical modelling of the cognitive data. A: The three-tier hierarchical general cognition model. B: The bifactor general memory model.
This model was re-specified as a bi-factor model where the g factor and memory factors were forced to be completely orthogonal (see Figure 2B). The executive factor was dropped as when measures from this factor were allowed to load on g, the loadings exceeded 1, suggesting multicollinearity between these measures and g. The model fit the data well, X2 was significant (X225= 58.873, p<.01) but other fit indices suggested that the model was a good fit (RMSEA = .036 (95%CI = .024 − .048, p = .977), CFI = .991, TLI = .984, SRMR = .023). All factor loadings were significant at the p<.001 level.
Linkage Analysis
QTL localization results are summarized by the maximum LOD scores observed for each factor in the hierarchical and non-hierarchical models as shown in Table 2. For the general cognition model, one factor exhibited genome-wide significant QTLs and the remaining factors showed suggestive significance. For working memory two clear linkage peaks emerged on chromosome 8, one at ~89 cM (LOD = 3.298, adjusted p = 0.007) and the other at ~142 cM (LOD = 4.239, adjusted p = 0.072) which suggests that there are QTLs associated with working memory at chromosomal locations 8q21.11–13 and 8q24.22 respectively (see Figure 3A). The verbal memory (LOD = 2.028) and spatial memory (LOD = 2.693) factors also showed suggestive significance at chromosomal locations 22q.11.21 and 7q36.1, respectively.
Table 2.
Heritability and top LOD scores for all factors derived from the two factor models.
| Model | Factor | h2 | Standard Error | p-value | LOD | Chrom | Loc | Location |
|---|---|---|---|---|---|---|---|---|
| General Cognition Hierarchical Model | Verbal Memory | .48 | .070 | 4.06 × 10⁻¹⁵ | 2.208 | 22 | 7 | 22q11.21 |
| Working Memory | .66 | .058 | 1.25 × 10⁻³² | 4.239 | 8 | 142 | 8q24.22 | |
| 3.298 | 8 | 89 | 8q21.11 | |||||
| Spatial Memory | .63 | .0623 | 4.07 × 10⁻²⁶ | 2.693 | 7 | 164 | 7q36.1 | |
| Executive Function | .65 | .059 | 2.86 × 10⁻³⁰ | 2.709 | 12 | 107 | 12q22 | |
| General Cognition | .68 | .058 | 1.16 × 10⁻³² | 2.737 | 12 | 108 | 12q22 | |
|
| ||||||||
| General Memory Bi-factor Model | Verbal Memory | .27 | .071 | 6.40 × 10−06 | 1.711 | 22 | 7 | 22q11.21 |
| Working Memory | .42 | .064 | 1.15 × 10⁻¹⁴ | 1.790 | 18 | 121 | 18q23 | |
| Spatial Memory | .21 | .071 | 1.48 × 10−04 | 3.763 | 17 | 94 | 17q23.2 | |
| 3.341 | 17 | 117 | 17q25.1 | |||||
| General Memory | .62 | .056 | 9.59 × 10⁻³³ | 2.593 | 8 | 92 | 8q21.13 | |
FIG. 3.
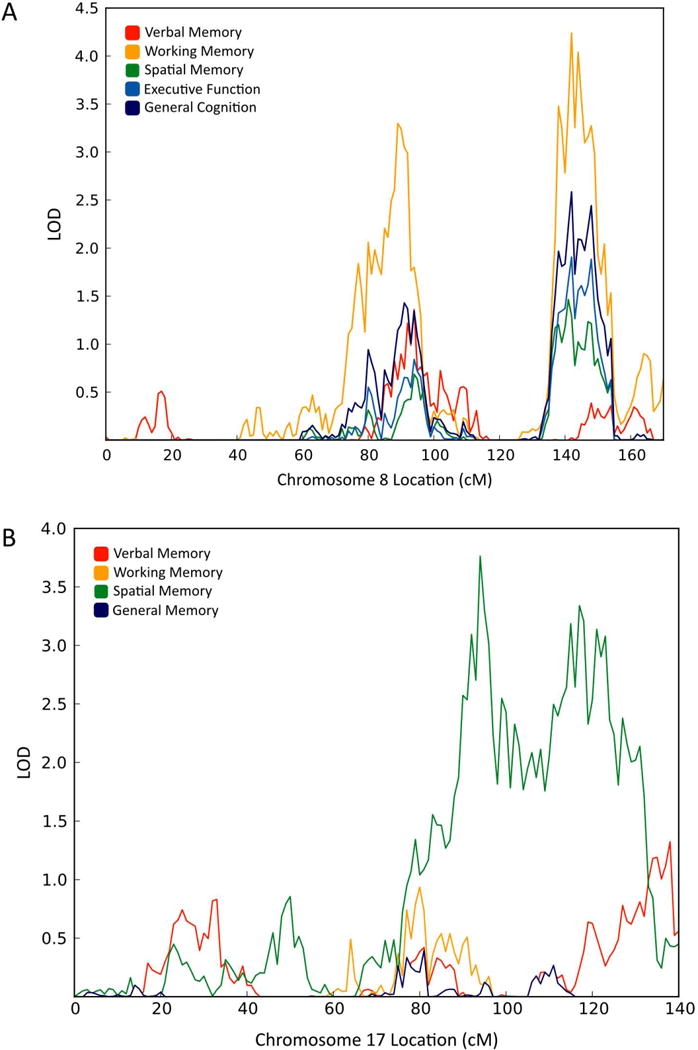
Linkage analysis. A: Chromosome 8 multipoint plot for all factors taken from the general cognition model where working memory exhibited two genome-wide significant QTLs. B: Chromosome 17 multipoint plot for all factors taken from the general memory model where spatial memory exhibited two genomewide.
When the memory factors of the hierarchical model were re-specified as a bi-factor model one factor exhibited a genome-wide significant QTL. The best univariate score for spatial memory was found on chromosome 17 at ~94cM (LOD = 3.763, adjusted p = 0.023) and a second linkage peak for spatial memory was found on chromosome 17 at ~117cM (LOD = 3.503, adjusted p = 0.065) suggesting QTLs for spatial memory at 17q22–24.2 and 17q25.1–3, respectively (see Figure 3B).
Inspection of Figure 3A strongly suggests pleiotropy where regions of chromosome 8 appear to be implicated in all aspects of cognition to some degree. Bivariate linkage analysis was employed over chromosome 8 to investigate these potential pleiotropic effects. Table 3 shows the results of the bivariate linkage analysis and the pleiotropy tests, both the bivariate LOD scores, all of which exceed the critical value of 2.9, and the pleiotropy tests suggest that there is complete pleiotropy on chromosome 8 between working memory and the other cognitive domains in the general cognition model in the region of 8q24.22.
Table 3.
Results of the bivariate linkage analysis.
| Phenotype | Bivariate LOD | Chrom | Loc | X2 | p |
|---|---|---|---|---|---|
| General Cognition | 3.1687 | 8 | 142 | 19.07 | 6.30 × 10−06 |
| Executive Function | 3.1988 | 8 | 142 | 18.46 | 8.65 × 10−06 |
| Spatial Memory | 3.1468 | 8 | 142 | 15.99 | 3.19 × 10−05 |
| Verbal Memory | 3.2332 | 8 | 142 | 12.82 | 1.71 × 10−04 |
QTL-specific Association Analysis
Association analysis was conducted for all genetic variants under each genome-wide significant QTL (see Table 4). For the working memory factor taken from the general cognition model, there were two significant QTLs on chromosome 8. For the first QTL, two variants met the adjusted significance level of 2.8×10⁻⁵ (total number of SNPS = 3549, effective number of SNPs = 1833). The first SNP rs2467774 is located at 80,675,246 bp which is 999 bp downstream of the gene HEY1 (hairy/enhancer-of-split related with YRPW motif 1) and had a p-value of 1.1×10⁻⁵; the second SNP rs723686 at 80,661,733 bp, was 13,513 bp downstream of HEY1 and had a p-value of 1.2×10⁻⁵ (see Figure 4).
Table 4.
Estimates of X2, size and direction of effect and variance explained for significant SNPs from the QTL-specific association analysis.
| SNP | X2 | p-value | β | Variance Explained |
|---|---|---|---|---|
| rs2467774 | 19.37 | 0.000011 | −0.22 | 0.024 |
| rs723686 | 19.18 | 0.000012 | −0.20 | 0.022 |
| rs9907597 | 17.51 | 0.000029 | 0.19 | 0.019 |
| rs12162165 | 16.77 | 0.000042 | 0.21 | 0.018 |
| rs1867467 | 16.78 | 0.000042 | 0.19 | 0.016 |
FIG. 4.
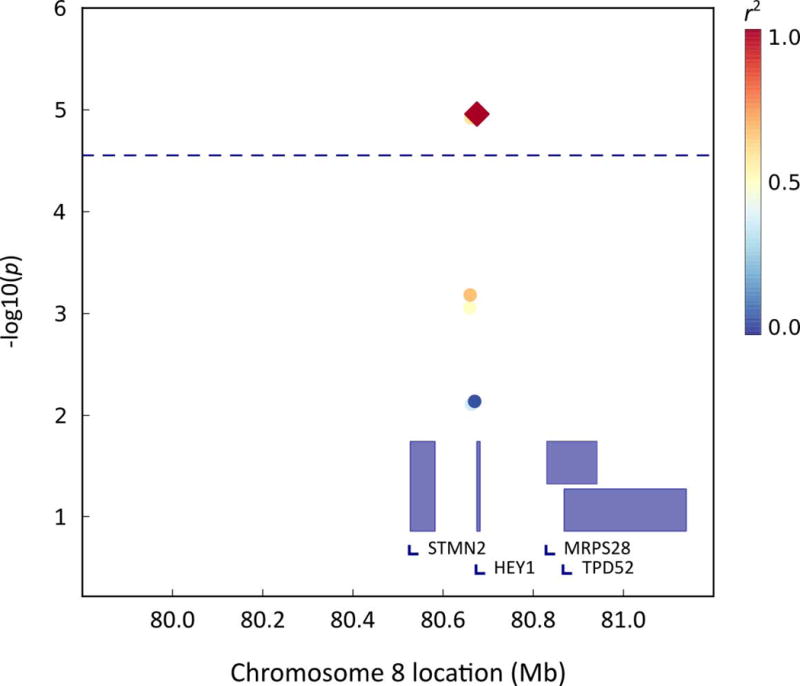
QTL-specific association analysis for the first genomewide significant QTL region associated with the working memory factor on chromosome 8.
For the spatial memory factor taken from the bi-factor model there were two significant QTLs on chromosome 17. For the first QTL, two variants met the adjusted significance level of 5.3×10⁻⁵ (total number of SNPs = 1927, effective number of SNPS = 960). The first SNP rs9907597 is located at 59,435,497 bp within the gene BCAS3 (breast carcinoma amplified sequence 3) and had a p-value of 2.9×10⁻⁵; the second SNP rs12162165 is located at 58,582,538 bp within the gene APPBP2 (amyloid beta precursor protein (cytoplasmic tail) binding protein 2) and had a p-value of 4.2×10⁻⁵ (see Figure 5A). For the second QTL on chromosome 17, one variant met the adjusted significance level of 4.9×10⁻⁵ (total number of SNPs = 1775, effective number of SNPs = 1038). The SNP rs1867467 is located at 74,959,497 bp, 13, 026 bp downstream of the gene MGAT5B (mannosyl (alpha-1,6-)-glycoprotein beta-1,6-N-acetyl-glucosaminyltransferase, isozyme B) and had a p-value of 4.2×10⁻⁵ (see Figure 5B).
FIG. 5.
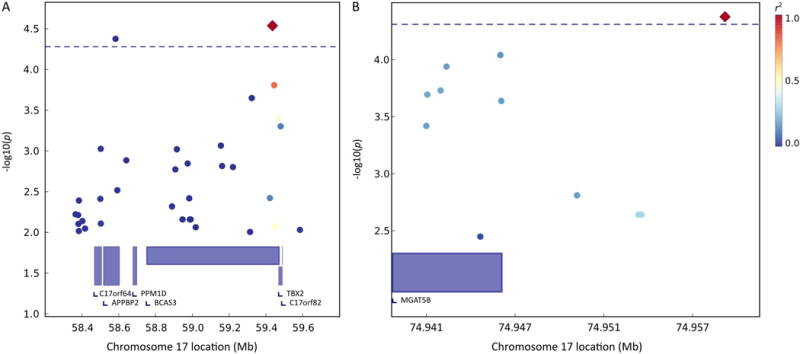
QTL-specific association analysis for the first (A) and second (B) genome-wide significant QTL regions associated with the spatial memory factor on chromosome 17.
Replication within the PGC schizophrenia data
Of the SNPs shown to be associated with cognition in the present manuscript one shows a significant association with schizophrenia risk in the GWA study published by the Psychiatric Genetics Consortium (PGC; Ripke et al, 2011). We checked the strength of association between the four SNPs shown to be associated with memory with schizophrenia risk using the Riopili (http://www.broadinstitute.org/mpg/ricopili/) database. Because we tested five SNPs a Bonferroni corrected α of 0.0100 was required. The SNP rs723686 on chromosome 8, which was significantly associated with working memory ability, also showed an association with schizophrenia risk (p = 0.00728; see Figure S1).
Discussion
Dissecting the genetic architecture of psychotic illnesses has been met with limited success when using diagnostic classification alone (Sullivan, 2005). This has led many in the field to focus instead on endophenotypes (Gottesman and Gould, 2003). In the present manuscript we used detailed phenotypic models of cognition to localize genetic influences on working and spatial memory in the hope that those genetic influences might have utility as candidates for future work in the field of psychiatric genetics. A hierarchical model revealed two QTLs on chromosome 8 (8q21.11–13 and 8q24.22) for working memory and showed pleiotropy with other cognitive domains while a bi-factor model revealed two QTLs on chromosome 17 (17q22–23.2 and 17q25.1) for spatial memory. Association analysis conducted in the region of those QTLs revealed five variants that were significantly associated with memory ability and of these, rs723686, showed an association with schizophrenia risk in the PGC data (p = 0.00728; see Figure S1).
Cognitive impairment meets the criteria, as outlined by Gottesmand and Gould (2003), for being an endophenotype of psychosis. Impairment is associated with psychosis in the population and is state-independent (Reichenberg and Harvey, 2007), it is heritable (Deary, 2012), and finally cognitive impairment and psychosis co-segregate within families (Toulopoulou et al., 2007; Toulopoulou et al., 2010; Owens et al., 2011, Glahn et al., 2010; Glahn et al., 2007a; Bora et al., 2009; Hoff et al., 2005; Sitskoorn et al., 2004). While the prevailing approach in psychiatric genetics has been to search for genes that directly influence illness risk, diagnostic status is relatively distal from the underlying causal physiological mechanism. In contrast an approach centered on endophenotypes shifts the focus from illness risk to allied phenotypes, or biomarkers, of the illness in the hope that the genetic architecture will be relatively less complex and thus easier to disentangle. Moreover, because endophenotypes vary within the normal population they are amenable to study in samples without focus on a specific illness. Of course cognitive ability is normally distributed and as a consequence cognitive dysfunction is widespread in the population. It is not the assertion of the present paper that psychosis explains normal variation in cognition. However, the strategy of focusing on normal variation has been successfully applied to the study of many complex diseases including heart disease (Kathiresan et al., 2009), obesity (Willer et al., 2009), diabetes (Cai et al., 2004), hypertension (Cho et al., 2009), osteoporosis (Kiel et al., 2007) and depression (Glahn et al., 2012).
Previous research has consistently implicated the chromosomal region 8q21.13, which captures the two variants (rs2467774 and rs723686) shown to be associated with working memory in the present study, in psychosis risk. Genome-wide linkage studies have found suggestive associations between this region and bipolar risk in adolescents (Doyle et al., 2010) and adults (Kerner et al., 2007), and DNA-methylation changes in this region are associated with major psychosis in adults (Mill et al., 2008). Members of the HEY gene family have been identified as mediators of psychotic-illness risk either directly or through well characterized dopamine pathway genes (Middleton et al., 2004; Fuke et al., 2005). Finally, structural variation in the region 8q21.3 is associated with autism risk which is interesting given the large amount of genetic overlap between psychosis and autism risk (Gilman et al., 2012; Marshall et al., 2008).
Association analysis at 8q21.13 with working memory revealed two common variants associated with the HEY1 gene, one 999 base pairs downstream (rs2467774) and the other ~13,000 base pairs downstream (rs723686). HEY1 is a transcription target of Notch and makes up part of the hairy and enhancer of split (HES) and Hairy/Enhancer-of-split-related with YRPW-like motif (HEY also called HERP) gene families (Bray and Bernard, 2010). These are basic helix-loop-helix genes which are highly expressed in the developing brain where they maintain neural precursor cells, mediating neurogenesis and differentiation during neurodevelopment (Kokubo et al., 1999; Leimeister et al., 1999; Sakamoto et al., 2003). This gene family continues to be expressed in the adult brain and is involved in neurogenesis throughout the lifespan (Stump et al., 2002; Elliott et al., 2001). Notch receptors are primarily activated by two ligand types, Delta and Jagged, with activation resulting in intramembrane cleavage of the Notch receptor where the intracellular domain (NCID) replaces transcriptional co-repressors with activators that in turn trigger expression of HEY and HES genes via the transcription factor RBPJκ (Fischer and Gessler, 2007). The Notch signaling pathway has previously been implicated in memory (Costa et al., 2005). For example, in drosophila with a mutant form of Notch that specifically affects the intracellular domain necessary for transcription, formation of long-term memory is impaired (Ge et al., 2004). Similarly, mice with heterozygous mutations in RBPJκ exhibit deficits in spatial memory (Costa et al., 2003).
Notch signaling has also been implicated in Alzheimer’s disease, a neurological disorder with a devastating impact on memory and increased production and accumulation of amyloid β-protein in brain (Selkoe, 2001). Although Notch involvement is typically associated with presenilin-dependent γ-secretase activity, recent research has shown an association between HEY1 over-expression and reduced amyloid β metabolism (De Strooper et al., 1999; Leal et al., 2012). This ties in neatly with the significant association for spatial memory and the gene APPBP2 (variant rs12162165) located at 17q23.2, which is functionally associated with the processing of amyloid precursor protein (Nagase et al., 1996). Overall, these results are interesting because while Notch (and amyloid β) has been implicated in memory in animal models and in humans affected by neurological illness such as Alzheimer’s, this is the first time that this association has been paper to highlight the potential importance of HEY1 in this context.
Association was seen between spatial memory and BCAS3 at 17q23.2, a gene which is amplified and over-expressed in breast cancers and is moderately expressed in the brain (Barlund et al., 2002). Relatively little is known about the function of the protein beyond its involvement in breast cancer and there are no known homologs (Gururaj et al., 2006). Structural abnormalities in the genomic region 17q32.2 have been associated with mild to moderate developmental delay and microcephaly in a handful of case studies (Ballif et al., 2010; Nimmakayalu et al., 2011). In addition, we found evidence for association with an intergenic SNP (~13kb downstream of MGAT5B) and spatial memory. Although it is unlikely that this variant directly influences gene expression, our current understanding of how genetic regulation is controlled is limited. Epigenetic factors, such as DNA methylation, histone modification and non-coding RNA influence gene regulation in ways that we do not currently comprehend. The identification of variation in intergenic regions, which may influence phenotypes such as spatial memory, may represent an as yet unknown spectrum of variants that regulate gene or protein expression. Suffice to say that given the strong link between the working memory QTL and psychosis, this region on chromosome 17 might be of particular interest in future psychosis research. A possible link between breast cancer and both bipolar disorder and schizophrenia risk may exist, such that there is strong genetic competition between the disorders where cancer causes over-proliferation of cells and psychosis putatively causes cell death as is described by Rzhetsky and colleagues (Rzhetsky et al., 2007). Interestingly, the breast cancer drug tamoxifen has been shown to be effective in the treatment of bipolar (Kulkarni et al., 2006; Amrollahi et al., 2011).
This study shows that by using detailed phenotypic models of cognition it is possible to localize genetic influences on memory. Furthermore it is possible that modeling the data in this way has contributed to the literature showing that the chromosomal region 8q21.13 is important for psychosis risk and furthermore highlights HEY1 as being of particular interest within this region. The present study demonstrates that one SNP, located 13kb upstream of HEY1, shows an association with working memory and also shows an association with schizophrenia risk in the PGC sample. Identifying these genetic influences was made possible by focusing on QTLs that influence cognitive domains rather than on g or general intelligence. The genetic signal for g was weaker than for the cognitive domains and in fact, the bi-factor model shows that a genetic signal for spatial memory only emerged when the variance associated with general cognition was removed from the individual domains and modeled as a separate factor. Moreover, given that bivariate linkage demonstrated pleiotropy between working memory and the other cognitive domains including g these findings suggest that focusing on cognitive domains may in fact be an effective strategy for isolating genes for general intelligence.
An interesting feature of the present population is that they are of non-Caucasian origins. This is interesting because the findings, at least for one SNP identified to be associated with working memory, appears to be generalizable to the Caucasian population employed by the PGC. However, one potential limitation of the sample used in the present study is that, because it has been randomly ascertained from the general population, it is subject to common mental illness. However, anxiety and depression were included as covariates and neither alcohol nor substance use disorders co-varied significantly with the working or spatial memory factors which showed significant linkage in the present study and moreover their inclusion did not change the either the linkage or association results. However, education and socioeconomic influences were not co-varied for in the present study and this should be remembered as a potential weakness of the present study.
In summary, the linkage and association findings presented in this manuscript highlight the use of detailed phenotypic models for finding genes for cognition and in so doing these findings contribute to the literature showing that the chromosomal region 8q21.13, and more specifically HEY1, is important for psychosis risk. This suggests a new methodology for identifying genes for cognition as an endophenotype of psychosis, one which attempts to model cognitive domains taking into account both phenotypic and genetic factors, thus maximizing their potential as endophenotypes for mental ill-health.
Supplementary Material
Acknowledgments
Financial support for this study was provided by the National Institute of Mental Health grants MH078143 (PI: DC Glahn), MH078111 (PI: J Blangero), and MH083824 (PI: DC Glahn). SOLAR is supported by NIMH grant MH059490 (J Blangero).
References
- Abecasis GR, Cherny SS, Cookson WO, Cardon LR. Merlin–rapid analysis of dense genetic maps using sparse gene flow trees. Nat Genet. 2002;30:97–101. doi: 10.1038/ng786. [DOI] [PubMed] [Google Scholar]
- Almasy L. Quantitative risk factors as indices of alcoholism susceptibility. Ann Med. 2003;35:337–343. doi: 10.1080/07853890310004903. [DOI] [PubMed] [Google Scholar]
- Almasy L, Blangero J. Multipoint quantitative-trait linkage analysis in general pedigrees. Am J Hum Genet. 1998;62:1198–1211. doi: 10.1086/301844. [DOI] [PMC free article] [PubMed] [Google Scholar]
- Amrollahi Z, Rezaei F, Salehi B, Modabbernia AH, Maroufi A, Esfandiari GR, Naderi M, Ghebleh F, Ahmadi-Abhari SA, Sadeghi M, Tabrizi M, Akhondzadeh S. Double-blind, randomized, placebo-controlled 6-week study on the efficacy and safety of the tamoxifen adjunctive to lithium in acute bipolar mania. J Affect Disord. 2011;129:327–331. doi: 10.1016/j.jad.2010.08.015. [DOI] [PubMed] [Google Scholar]
- Ballif BC, Theisen A, Rosenfeld JA, Traylor RN, Gastier-Foster J, Thrush DL, Astbury C, Bartholomew D, McBride KL, Pyatt RE, Shane K, Smith WE, Banks V, Gallentine WB, Brock P, Rudd MK, Adam MP, Keene JA, Phillips JA, 3rd, Pfotenhauer JP, Gowans GC, Stankiewicz P, Bejjani BA, Shaffer LG. Identification of a recurrent microdeletion at 17q23.1q23.2 flanked by segmental duplications associated with heart defects and limb abnormalities. Am J Hum Genet. 2010;86:454–461. doi: 10.1016/j.ajhg.2010.01.038. [DOI] [PMC free article] [PubMed] [Google Scholar]
- Barlund M, Monni O, Weaver JD, Kauraniemi P, Sauter G, Heiskanen M, Kallioniemi OP, Kallioniemi A. Cloning of BCAS3 (17q23) and BCAS4 (20q13) genes that undergo amplification, overexpression, and fusion in breast cancer. Genes Chromosomes Cancer. 2002;35:311–317. doi: 10.1002/gcc.10121. [DOI] [PubMed] [Google Scholar]
- Bearden CE, Freimer NB. Endophenotypes for psychiatric disorders: Ready for primetime? Trends Genet. 2006;22:306–313. doi: 10.1016/j.tig.2006.04.004. [DOI] [PubMed] [Google Scholar]
- Blangero J. Statistical genetic approaches to human adaptability. Human Biology. 1993;65(6):941–966. [PubMed] [Google Scholar]
- Boehnke M. Allele frequency estimation from data on relatives. Am J Hum Genet. 1991;48:22–25. [PMC free article] [PubMed] [Google Scholar]
- Bora E, Yucel M, Pantelis C. Cognitive endophenotypes of bipolar disorder: A meta-analysis of neuropsychological deficits in euthymic patients and their first-degree relatives. J Affect Disord. 2009;113:1–20. doi: 10.1016/j.jad.2008.06.009. [DOI] [PubMed] [Google Scholar]
- Bray S, Bernard F. Notch targets and their regulation. Curr Top Dev Biol. 2010;92:253–275. doi: 10.1016/S0070-2153(10)92008-5. [DOI] [PubMed] [Google Scholar]
- Cabeza R, Nyberg L. Imaging cognition II: An empirical review of 275 PET and fMRI studies. J Cogn Neurosci. 2000;12:1–47. doi: 10.1162/08989290051137585. [DOI] [PubMed] [Google Scholar]
- Cai G, Cole SA, Bastarrachea RA, Maccluer JW, Blangero J, Comuzzie AG. Quantitative trait locus determining dietary macronutrient intakes is located on human chromosome 2p22. Am J Clin Nutr. 2004;80:1410–1414. doi: 10.1093/ajcn/80.5.1410. [DOI] [PubMed] [Google Scholar]
- Carroll JB. Cambridge. New York, NY: Cambridge University Press; 1993. Human cognitive abilities: A survey of factor-analytic studies; p. 819. [Google Scholar]
- Cheverud JM. A simple correction for multiple comparisons in interval mapping genome scans. Heredity (Edinb) 2001;87:52–58. doi: 10.1046/j.1365-2540.2001.00901.x. [DOI] [PubMed] [Google Scholar]
- Cho YS, Go MJ, Kim YJ, Heo JY, Oh JH, Ban HJ, Yoon D, Lee MH, Kim DJ, Park M, Cha SH, Kim JW, Han BG, Min H, Ahn Y, Park MS, Han HR, Jang HY, Cho EY, Lee JE, Cho NH, Shin C, Park T, Park JW, Lee JK, Cardon L, Clarke G, McCarthy MI, Lee JY, Lee JK, Oh B, Kim HL. A large-scale genome-wide association study of asian populations uncovers genetic factors influencing eight quantitative traits. Nat Genet. 2009;41:527–534. doi: 10.1038/ng.357. [DOI] [PubMed] [Google Scholar]
- Costa RM, Drew C, Silva AJ. Notch to remember. Trends Neurosci. 2005;28:429–435. doi: 10.1016/j.tins.2005.05.003. [DOI] [PubMed] [Google Scholar]
- Costa RM, Honjo T, Silva AJ. Learning and memory deficits in notch mutant mice. Curr Biol. 2003;13:1348–1354. doi: 10.1016/s0960-9822(03)00492-5. [DOI] [PubMed] [Google Scholar]
- Crawley MJ. The R book. Chichester: Wiley; 2007. [Google Scholar]
- De Strooper B, Annaert W, Cupers P, Saftig P, Craessaerts K, Mumm JS, Schroeter EH, Schrijvers V, Wolfe MS, Ray WJ, Goate A, Kopan R. A presenilin-1-dependent gamma-secretase-like protease mediates release of notch intracellular domain. Nature. 1999;398:518–522. doi: 10.1038/19083. [DOI] [PubMed] [Google Scholar]
- Deary IJ. Intelligence. Annu Rev Psychol. 2012;63:453–482. doi: 10.1146/annurev-psych-120710-100353. [DOI] [PubMed] [Google Scholar]
- Deary IJ, Johnson W, Houlihan LM. Genetic foundations of human intelligence. Hum Genet. 2009;126:215–232. doi: 10.1007/s00439-009-0655-4. [DOI] [PubMed] [Google Scholar]
- Doyle AE, Biederman J, Ferreira MA, Wong P, Smoller JW, Faraone SV. Suggestive linkage of the child behavior checklist juvenile bipolar disorder phenotype to 1p21, 6p21, and 8q21. J Am Acad Child Adolesc Psychiatry. 2010;49:378–387. [PMC free article] [PubMed] [Google Scholar]
- Elliott RC, Khademi S, Pleasure SJ, Parent JM, Lowenstein DH. Differential regulation of basic helix-loop-helix mRNAs in the dentate gyrus following status epilepticus. Neuroscience. 2001;106:79–88. doi: 10.1016/s0306-4522(01)00198-1. [DOI] [PubMed] [Google Scholar]
- Feingold E, Brown PO, Siegmund D. Gaussian models for genetic linkage analysis using complete high-resolution maps of identity by descent. Am J Hum Genet. 1993;53:234–251. [PMC free article] [PubMed] [Google Scholar]
- Fischer A, Gessler M. Delta-notch–and then? protein interactions and proposed modes of repression by hes and hey bHLH factors. Nucleic Acids Res. 2007;35:4583–4596. doi: 10.1093/nar/gkm477. [DOI] [PMC free article] [PubMed] [Google Scholar]
- Fuke S, Sasagawa N, Ishiura S. Identification and characterization of the Hesr1/Hey1 as a candidate trans-acting factor on gene expression through the 3′ non-coding polymorphic region of the human dopamine transporter (DAT1) gene. J Biochem. 2005;137:205–216. doi: 10.1093/jb/mvi020. [DOI] [PubMed] [Google Scholar]
- Ge X, Hannan F, Xie Z, Feng C, Tully T, Zhou H, Xie Z, Zhong Y. Notch signaling in drosophila long-term memory formation. Proc Natl Acad Sci USA. 2004;101:10172–10176. doi: 10.1073/pnas.0403497101. [DOI] [PMC free article] [PubMed] [Google Scholar]
- Gilman SR, Chang J, Xu B, Bawa TS, Gogos JA, Karayiorgou M, Vitkup D. Diverse types of genetic variation converge on functional gene networks involved in schizophrenia. Nat Neurosci. 2012 doi: 10.1038/nn.3261. [DOI] [PMC free article] [PubMed] [Google Scholar]
- Glahn DC, Almasy L, Barguil M, Hare E, Peralta JM, Kent JW, Jr, Dassori A, Contreras J, Pacheco A, Lanzagorta N, Nicolini H, Raventos H, Escamilla MA. Neurocognitive endophenotypes for bipolar disorder identified in multiplex multigenerational families. Arch Gen Psychiatry. 2010;67:168–177. doi: 10.1001/archgenpsychiatry.2009.184. [DOI] [PMC free article] [PubMed] [Google Scholar]
- Glahn DC, Almasy L, Blangero J, Burk GM, Estrada J, Peralta JM, Meyenberg N, Castro MP, Barrett J, Nicolini H, Raventos H, Escamilla MA. Adjudicating neurocognitive endophenotypes for schizophrenia. American Journal of Medical Genetics B Neuropsychiatric Genetics. 2007a;144B:242–249. doi: 10.1002/ajmg.b.30446. [DOI] [PubMed] [Google Scholar]
- Glahn DC, Almasy L, Blangero J, Burk GM, Estrada J, Peralta JM, Meyenberg N, Castro MP, Barrett J, Nicolini H, Raventos H, Escamilla MA. Adjudicating neurocognitive endophenotypes for schizophrenia. Am J Med Genet B Neuropsychiatr Genet. 2007b;144B:242–249. doi: 10.1002/ajmg.b.30446. [DOI] [PubMed] [Google Scholar]
- Glahn DC, Bearden CE, Cakir S, Barrett JA, Najt P, Serap Monkul E, Maples N, Velligan DI, Soares JC. Differential working memory impairment in bipolar disorder and schizophrenia: Effects of lifetime history of psychosis. Bipolar Disord. 2006;8:117–123. doi: 10.1111/j.1399-5618.2006.00296.x. [DOI] [PubMed] [Google Scholar]
- Glahn DC, Curran JE, Winkler AM, Carless MA, Kent JW, Jr, Charlesworth JC, Johnson MP, Goring HH, Cole SA, Dyer TD, Moses EK, Olvera RL, Kochunov P, Duggirala R, Fox PT, Almasy L, Blangero J. High dimensional endophenotype ranking in the search for major depression risk genes. Biol Psychiatry. 2012;71:6–14. doi: 10.1016/j.biopsych.2011.08.022. [DOI] [PMC free article] [PubMed] [Google Scholar]
- Glahn DC, Therman S, Manninen M, Huttunen M, Kaprio J, Lonnqvist J, Cannon TD. Spatial working memory as an endophenotype for schizophrenia. Biol Psychiatry. 2003;53:624–626. doi: 10.1016/s0006-3223(02)01641-4. [DOI] [PubMed] [Google Scholar]
- Gottesman II, Gould TD. The endophenotype concept in psychiatry: Etymology and strategic intentions. Am J Psychiatry. 2003;160:636–645. doi: 10.1176/appi.ajp.160.4.636. [DOI] [PubMed] [Google Scholar]
- Green AE, Kraemer DJ, Deyoung CG, Fossella JA, Gray JR. A gene-brain-cognition pathway: Prefrontal activity mediates the effect of COMT on cognitive control and IQ. Cereb Cortex. 2012 doi: 10.1093/cercor/bhs035. [DOI] [PubMed] [Google Scholar]
- Gururaj AE, Singh RR, Rayala SK, Holm C, den Hollander P, Zhang H, Balasenthil S, Talukder AH, Landberg G, Kumar R. MTA1, a transcriptional activator of breast cancer amplified sequence 3. Proc Natl Acad Sci USA. 2006;103:6670–6675. doi: 10.1073/pnas.0601989103. [DOI] [PMC free article] [PubMed] [Google Scholar]
- Heath SC. Markov chain monte carlo segregation and linkage analysis for oligogenic models. Am J Hum Genet. 1997;61:748–760. doi: 10.1086/515506. [DOI] [PMC free article] [PubMed] [Google Scholar]
- Heinrichs RW, Zakzanis KK. Neurocognitive deficit in schizophrenia: A quantitative review of the evidence. Neuropsychology. 1998;12:426–445. doi: 10.1037//0894-4105.12.3.426. [DOI] [PubMed] [Google Scholar]
- Hoff AL, Svetina C, Maurizio AM, Crow TJ, Spokes K, DeLisi LE. Familial cognitive deficits in schizophrenia. Am J Med Genet B Neuropsychiatr Genet. 2005;133B:43–49. doi: 10.1002/ajmg.b.30120. [DOI] [PubMed] [Google Scholar]
- Holzinger KJ, Swineford S. The bi-factor method. Psychometrika. 1937;47:51–54. [Google Scholar]
- Kathiresan S, Willer CJ, Peloso GM, Demissie S, Musunuru K, Schadt EE, Kaplan L, Bennett D, Li Y, Tanaka T, Voight BF, Bonnycastle LL, Jackson AU, Crawford G, Surti A, Guiducci C, Burtt NP, Parish S, Clarke R, Zelenika D, Kubalanza KA, Morken MA, Scott LJ, Stringham HM, Galan P, Swift AJ, Kuusisto J, Bergman RN, Sundvall J, Laakso M, Ferrucci L, Scheet P, Sanna S, Uda M, Yang Q, Lunetta KL, Dupuis J, de Bakker PI, O’Donnell CJ, Chambers JC, Kooner JS, Hercberg S, Meneton P, Lakatta EG, Scuteri A, Schlessinger D, Tuomilehto J, Collins FS, Groop L, Altshuler D, Collins R, Lathrop GM, Melander O, Salomaa V, Peltonen L, Orho-Melander M, Ordovas JM, Boehnke M, Abecasis GR, Mohlke KL, Cupples LA. Common variants at 30 loci contribute to polygenic dyslipidemia. Nat Genet. 2009;41:56–65. doi: 10.1038/ng.291. [DOI] [PMC free article] [PubMed] [Google Scholar]
- Kerner B, Brugman DL, Freimer NB. Evidence of linkage to psychosis on chromosome 5q33–34 in pedigrees ascertained for bipolar disorder. Am J Med Genet B Neuropsychiatr Genet. 2007;144B:74–78. doi: 10.1002/ajmg.b.30402. [DOI] [PubMed] [Google Scholar]
- Kiel DP, Demissie S, Dupuis J, Lunetta KL, Murabito JM, Karasik D. Genome-wide association with bone mass and geometry in the framingham heart study. BMC Med Genet. 2007;8(Suppl 1):S14. doi: 10.1186/1471-2350-8-S1-S14. [DOI] [PMC free article] [PubMed] [Google Scholar]
- Kline RB. Principles and practice of structural equation modeling. New York; London: Guilford; 2005. [Google Scholar]
- Kokubo H, Lun Y, Johnson RL. Identification and expression of a novel family of bHLH cDNAs related to drosophila hairy and enhancer of split. Biochem Biophys Res Commun. 1999;260:459–465. doi: 10.1006/bbrc.1999.0880. [DOI] [PubMed] [Google Scholar]
- Kulkarni J, Garland KA, Scaffidi A, Headey B, Anderson R, de Castella A, Fitzgerald P, Davis SR. A pilot study of hormone modulation as a new treatment for mania in women with bipolar affective disorder. Psychoneuroendocrinology. 2006;31:543–547. doi: 10.1016/j.psyneuen.2005.11.001. [DOI] [PubMed] [Google Scholar]
- Leal MC, Surace EI, Holgado MP, Ferrari CC, Tarelli R, Pitossi F, Wisniewski T, Castano EM, Morelli L. Notch signaling proteins HES-1 and hey-1 bind to insulin degrading enzyme (IDE) proximal promoter and repress its transcription and activity: Implications for cellular abeta metabolism. Biochim Biophys Acta. 2012;1823:227–235. doi: 10.1016/j.bbamcr.2011.09.014. [DOI] [PMC free article] [PubMed] [Google Scholar]
- Lee J, Park S. Working memory impairments in schizophrenia: A meta-analysis. J Abnorm Psychol. 2005;114:599–611. doi: 10.1037/0021-843X.114.4.599. [DOI] [PubMed] [Google Scholar]
- Leimeister C, Externbrink A, Klamt B, Gessler M. Hey genes: A novel subfamily of hairy- and enhancer of split related genes specifically expressed during mouse embryogenesis. Mech Dev. 1999;85:173–177. doi: 10.1016/s0925-4773(99)00080-5. [DOI] [PubMed] [Google Scholar]
- Lenartowicz A, Kalar DJ, Congdon E, Poldrack RA. Towards an ontology of cognitive control. Topics in Cognitive Science. 2010;2:678–692. doi: 10.1111/j.1756-8765.2010.01100.x. [DOI] [PubMed] [Google Scholar]
- Marshall CR, Noor A, Vincent JB, Lionel AC, Feuk L, Skaug J, Shago M, Moessner R, Pinto D, Ren Y, Thiruvahindrapduram B, Fiebig A, Schreiber S, Friedman J, Ketelaars CE, Vos YJ, Ficicioglu C, Kirkpatrick S, Nicolson R, Sloman L, Summers A, Gibbons CA, Teebi A, Chitayat D, Weksberg R, Thompson A, Vardy C, Crosbie V, Luscombe S, Baatjes R, Zwaigenbaum L, Roberts W, Fernandez B, Szatmari P, Scherer SW. Structural variation of chromosomes in autism spectrum disorder. Am J Hum Genet. 2008;82:477–488. doi: 10.1016/j.ajhg.2007.12.009. [DOI] [PMC free article] [PubMed] [Google Scholar]
- McGuffin P, Rijsdijk F, Andrew M, Sham P, Katz R, Cardno A. The heritability of bipolar affective disorder and the genetic relationship to unipolar depression. Arch Gen Psychiatry. 2003;60:497–502. doi: 10.1001/archpsyc.60.5.497. [DOI] [PubMed] [Google Scholar]
- Middleton FA, Pato MT, Gentile KL, Morley CP, Zhao X, Eisener AF, Brown A, Petryshen TL, Kirby AN, Medeiros H, Carvalho C, Macedo A, Dourado A, Coelho I, Valente J, Soares MJ, Ferreira CP, Lei M, Azevedo MH, Kennedy JL, Daly MJ, Sklar P, Pato CN. Genomewide linkage analysis of bipolar disorder by use of a high-density single-nucleotide-polymorphism (SNP) genotyping assay: A comparison with microsatellite marker assays and finding of significant linkage to chromosome 6q22. Am J Hum Genet. 2004;74:886–897. doi: 10.1086/420775. [DOI] [PMC free article] [PubMed] [Google Scholar]
- Mill J, Tang T, Kaminsky Z, Khare T, Yazdanpanah S, Bouchard L, Jia P, Assadzadeh A, Flanagan J, Schumacher A, Wang SC, Petronis A. Epigenomic profiling reveals DNA-methylation changes associated with major psychosis. Am J Hum Genet. 2008;82:696–711. doi: 10.1016/j.ajhg.2008.01.008. [DOI] [PMC free article] [PubMed] [Google Scholar]
- Muthén LK, Muthén BO. Mplus user’s guide. Los Angeles, CA: Muthén & Muthén; 2011. [Google Scholar]
- Nagase T, Seki N, Ishikawa K, Ohira M, Kawarabayasi Y, Ohara O, Tanaka A, Kotani H, Miyajima N, Nomura N. Prediction of the coding sequences of unidentified human genes. VI. the coding sequences of 80 new genes (KIAA0201-KIAA0280) deduced by analysis of cDNA clones from cell line KG-1 and brain. DNA Res. 1996;3:321–9. 341–54. doi: 10.1093/dnares/3.5.321. [DOI] [PubMed] [Google Scholar]
- Moskvina V, Schmidt KM. On multiple-testing correction in genome-wide association studies. Genet Epidemiol. 2008;32(6):567–573. doi: 10.1002/gepi.20331. [DOI] [PubMed] [Google Scholar]
- Niendam TA, Laird AR, Ray KL, Dean YM, Glahn DC, Carter CS. Meta-analytic evidence for a superordinate cognitive control network subserving diverse executive functions. Cognitive, Affective, & Behavioral Neuroscience. 2012;12:241–268. doi: 10.3758/s13415-011-0083-5. [DOI] [PMC free article] [PubMed] [Google Scholar]
- Nimmakayalu M, Major H, Sheffield V, Solomon DH, Smith RJ, Patil SR, Shchelochkov OA. Microdeletion of 17q22q23.2 encompassing TBX2 and TBX4 in a patient with congenital microcephaly, thyroid duct cyst, sensorineural hearing loss, and pulmonary hypertension. Am J Med Genet A. 2011;155A:418–423. doi: 10.1002/ajmg.a.33827. [DOI] [PubMed] [Google Scholar]
- Olvera RL, Bearden CE, Velligan DI, Almasy L, Carless MA, Curran JE, Williamson DE, Duggirala R, Blangero J, Glahn DC. Common genetic influences on depression, alcohol, and substance use disorders in mexican-american families. Am J Med Genet B Neuropsychiatr Genet. 2011;156B:561–568. doi: 10.1002/ajmg.b.31196. [DOI] [PMC free article] [PubMed] [Google Scholar]
- O’Reilly RC, Rudy JW. Conjunctive representations in learning and memory: Principles of cortical and hippocampal function. Psychol Rev. 2001;108:311–345. doi: 10.1037/0033-295x.108.2.311. [DOI] [PubMed] [Google Scholar]
- Owens SF, Picchioni MM, Rijsdijk FV, Stahl D, Vassos E, Rodger AK, Collier DA, Murray RM, Toulopoulou T. Genetic overlap between episodic memory deficits and schizophrenia: Results from the maudsley twin study. Psychol Med. 2011;41:521–532. doi: 10.1017/S0033291710000942. [DOI] [PubMed] [Google Scholar]
- Park S, Holzman PS. Schizophrenics show spatial working memory deficits. Arch Gen Psychiatry. 1992;49:975–982. doi: 10.1001/archpsyc.1992.01820120063009. [DOI] [PubMed] [Google Scholar]
- Plomin R, Spinath FM. Genetics and general cognitive ability (g) Trends Cogn Sci. 2002;6:169–176. doi: 10.1016/s1364-6613(00)01853-2. [DOI] [PubMed] [Google Scholar]
- R Development Core Team. R: A language and environment for statistical computing. R Foundation for Statistical Computing; 2011. [Google Scholar]
- Rasmus F. Genes, brain, and cognition: A roadmap for the cognitive scientist. Cognition. 2006;101:247–269. doi: 10.1016/j.cognition.2006.04.003. [DOI] [PubMed] [Google Scholar]
- Reichenberg A, Harvey PD. Neuropsychological impairments in schizophrenia: Integration of performance-based and brain imaging findings. Psychol Bull. 2007;133:833–858. doi: 10.1037/0033-2909.133.5.833. [DOI] [PubMed] [Google Scholar]
- Rijsdijk FV, Vernon PA, Boomsma DI. Application of hierarchical genetic models to Raven and WAIS subtests: A dutch twin study. Behav Genet. 2002;32:199–210. doi: 10.1023/a:1016021128949. [DOI] [PubMed] [Google Scholar]
- Rzhetsky A, Wajngurt D, Park N, Zheng T. Probing genetic overlap among complex human phenotypes. Proc Natl Acad Sci USA. 2007;104:11694–11699. doi: 10.1073/pnas.0704820104. [DOI] [PMC free article] [PubMed] [Google Scholar]
- Sakamoto M, Hirata H, Ohtsuka T, Bessho Y, Kageyama R. The basic helix-loop-helix genes Hesr1/Hey1 and Hesr2/Hey2 regulate maintenance of neural precursor cells in the brain. J Biol Chem. 2003;278:44808–44815. doi: 10.1074/jbc.M300448200. [DOI] [PubMed] [Google Scholar]
- chizophrenia Psychiatric Genome-Wide Association Study (GWAS) Consortium. Genome-wide association study identifies five new schizophrenia loci. Nat Genet. 2011;43:969–976. doi: 10.1038/ng.940. [DOI] [PMC free article] [PubMed] [Google Scholar]
- Self SG, Liang KY. Asymptotic properties of maximum likelihood estimators and likelihood ratio tests under nonstandard conditions. Journal of the American Statistical Association. 1987;82(398):605–610. [Google Scholar]
- Selkoe DJ. Alzheimer’s disease results from the cerebral accumulation and cytotoxicity of amyloid beta-protein. J Alzheimers Dis. 2001;3:75–80. doi: 10.3233/jad-2001-3111. [DOI] [PubMed] [Google Scholar]
- Sitskoorn MM, Aleman A, Ebisch SJ, Appels MC, Kahn RS. Cognitive deficits in relatives of patients with schizophrenia: A meta-analysis. Schizophr Res. 2004;71:285–295. doi: 10.1016/j.schres.2004.03.007. [DOI] [PubMed] [Google Scholar]
- Sobel E, Lange K. Descent graphs in pedigree analysis: Applications to haplotyping, location scores, and marker-sharing statistics. Am J Hum Genet. 1996;58:1323–1337. [PMC free article] [PubMed] [Google Scholar]
- Stump G, Durrer A, Klein AL, Lutolf S, Suter U, Taylor V. Notch1 and its ligands delta-like and jagged are expressed and active in distinct cell populations in the postnatal mouse brain. Mech Dev. 2002;114:153–159. doi: 10.1016/s0925-4773(02)00043-6. [DOI] [PubMed] [Google Scholar]
- Sullivan PF. The genetics of schizophrenia. PLoS Med. 2005;2:e212. doi: 10.1371/journal.pmed.0020212. [DOI] [PMC free article] [PubMed] [Google Scholar]
- Sullivan PF, Kendler KS, Neale MC. Schizophrenia as a complex trait: Evidence from a meta-analysis of twin studies. Arch Gen Psychiatry. 2003;60:1187–1192. doi: 10.1001/archpsyc.60.12.1187. [DOI] [PubMed] [Google Scholar]
- Toulopoulou T, Goldberg TE, Mesa IR, Picchioni M, Rijsdijk F, Stahl D, Cherny SS, Sham P, Faraone SV, Tsuang M, Weinberger DR, Seidman LJ, Murray RM. Impaired intellect and memory: A missing link between genetic risk and schizophrenia? Arch Gen Psychiatry. 2010;67:905–913. doi: 10.1001/archgenpsychiatry.2010.99. [DOI] [PubMed] [Google Scholar]
- Toulopoulou T, Picchioni M, Rijsdijk F, Hua-Hall M, Ettinger U, Sham P, Murray R. Substantial genetic overlap between neurocognition and schizophrenia: Genetic modeling in twin samples. Arch Gen Psychiatry. 2007;64:1348–1355. doi: 10.1001/archpsyc.64.12.1348. [DOI] [PubMed] [Google Scholar]
- van der Sluis S, Verhage M, Posthuma D, Dolan CV. Phenotypic complexity, measurement bias, and poor phenotypic resolution contribute to the missing heritability problem in genetic association studies. PLoS One. 2010;5:e13929. doi: 10.1371/journal.pone.0013929. [DOI] [PMC free article] [PubMed] [Google Scholar]
- Weinberger DR. Imaging networks and genetic networks 2012 [Google Scholar]
- Willer CJ, Speliotes EK, Loos RJ, Li S, Lindgren CM, Heid IM, Berndt SI, Elliott AL, Jackson AU, Lamina C, Lettre G, Lim N, Lyon HN, McCarroll SA, Papadakis K, Qi L, Randall JC, Roccasecca RM, Sanna S, Scheet P, Weedon MN, Wheeler E, Zhao JH, Jacobs LC, Prokopenko I, Soranzo N, Tanaka T, Timpson NJ, Almgren P, Bennett A, Bergman RN, Bingham SA, Bonnycastle LL, Brown M, Burtt NP, Chines P, Coin L, Collins FS, Connell JM, Cooper C, Smith GD, Dennison EM, Deodhar P, Elliott P, Erdos MR, Estrada K, Evans DM, Gianniny L, Gieger C, Gillson CJ, Guiducci C, Hackett R, Hadley D, Hall AS, Havulinna AS, Hebebrand J, Hofman A, Isomaa B, Jacobs KB, Johnson T, Jousilahti P, Jovanovic Z, Khaw KT, Kraft P, Kuokkanen M, Kuusisto J, Laitinen J, Lakatta EG, Luan J, Luben RN, Mangino M, McArdle WL, Meitinger T, Mulas A, Munroe PB, Narisu N, Ness AR, Northstone K, O’Rahilly S, Purmann C, Rees MG, Ridderstrale M, Ring SM, Rivadeneira F, Ruokonen A, Sandhu MS, Saramies J, Scott LJ, Scuteri A, Silander K, Sims MA, Song K, Stephens J, Stevens S, Stringham HM, Tung YC, Valle TT, Van Duijn CM, Vimaleswaran KS, Vollenweider P, Waeber G, Wallace C, Watanabe RM, Waterworth DM, Watkins N, Wellcome Trust Case Control Consortium. Witteman JC, Zeggini E, Zhai G, Zillikens MC, Altshuler D, Caulfield MJ, Chanock SJ, Farooqi IS, Ferrucci L, Guralnik JM, Hattersley AT, Hu FB, Jarvelin MR, Laakso M, Mooser V, Ong KK, Ouwehand WH, Salomaa V, Samani NJ, Spector TD, Tuomi T, Tuomilehto J, Uda M, Uitterlinden AG, Wareham NJ, Deloukas P, Frayling TM, Groop LC, Hayes RB, Hunter DJ, Mohlke KL, Peltonen L, Schlessinger D, Strachan DP, Wichmann HE, McCarthy MI, Boehnke M, Barroso I, Abecasis GR, Hirschhorn JN, Genetic Investigation of ANthropometric Traits Consortium Six new loci associated with body mass index highlight a neuronal influence on body weight regulation. Nat Genet. 2009;41:25–34. doi: 10.1038/ng.287. [DOI] [PMC free article] [PubMed] [Google Scholar]
- Zola-Morgan S, Squire LR. Neuroanatomy of memory. Annu Rev Neurosci. 1993;16:547–563. doi: 10.1146/annurev.ne.16.030193.002555. [DOI] [PubMed] [Google Scholar]
Associated Data
This section collects any data citations, data availability statements, or supplementary materials included in this article.