Abstract
Objective
To characterize the visual phenotype caused by mutations in the BTB-Kelch protein, KLHL7, responsible for the RP42 form of autosomal dominant retinitis pigmentosa (RP).
Methods
Comprehensive ophthalmic testing included visual acuity, static visual field, kinetic visual field, dark adaptometry, full-field electroretinography, spectral-domain optical coherence tomography, and fundus photography. Longitudinal visual function data (range, 15–27 years) were available for some of the affected individuals.
Results
We report a phenotypic assessment of 3 unrelated families, each harboring different KLHL7 mutations (c.458C>T, c.449G>A, and c.457G>A). The fundi showed classic signs of RP. Best-corrected visual acuity was 20/50 or better in at least one eye up to age 65 years Static and kinetic visual fields showed concentric constriction to central 10° to 20° by age 65 years; 2 patients with Goldmann perimetry exhibited bilateral visual field retention in the far periphery. Both rod and cone full-field electroretinographic amplitudes were substantially lower than normal, with a decline rate of 3% per year in cone 31-Hz flicker response. Rod and cone activation and inactivation variables were abnormal. Spectral-domain optical coherence tomography indicated retention of foveal inner segment-outer segment junction through age 65 years.
Conclusions
Mutations in KLHL7 are associated with a late-onset form of autosomal dominant retinal degeneration that preferentially affects the rod photoreceptors. Full-field electroretinographic findings, including recovery kinetics, are consistent with those observed in other forms of autosomal dominant RP.
Clinical Relevance
The phenotypes are similar among patients with 3 types of KLHL7 mutations (c.458C>T, c.449G>A, and c.457G>A). Strong retention of foveal function and bilateral concentric constriction of visual fields with far periphery sparing may guide mutation screening in autosomal dominant RP.
Retinitis pigmentosa (RP) IS a heterogeneous group of diseases associated with initial degeneration of photoreceptors and eventual loss of retinal pigment epithelium (RPE). The fundus exhibits characteristic signs, including bone spicule pigmentation, arteriolar attenuation, and waxy optic pallor. Night vision loss and visual field constriction are typical functional changes. One form of inheritance pattern is autosomal dominant RP (adRP). To date, 19 genes have been found to cause adRP in patients, including the KLHL7 gene identified in 2009 by our group.1 The form of disease associated with KLHL7 mutations is RP42 (RetNet [http://www.sph.uth.tmc.edu/retnet/disease.htm]). Mutations in the KLHL7 gene (location, 7p15.3) are estimated to account for less than 2% of adRP cases. The original study1 identified disease-causing KLHL7 mutations in 5 unrelated families, 3 of which were seen at the Retina Foundation of the Southwest. Three different mutations in KLHL7 were discovered in these 5 families, including c.458C>T (p.Ala153Val), c.449G>A (p.Ser150Asn), and c.457G>A (p.Ala153Thr). Two (c.449G>A, and c.457G>A) were found only in patients from the Retina Foundation of the Southwest.
The phenotype associated with the c.458C>T mutation in KLHL7 was recently described.2 The phenotype associated with the other 2 mutations has not been reported previously. Herein, we present a comprehensive assessment of visual function in 3 families (RFS038, RFS073, and RFS061), each harboring a different mutation in KLHL7 (c.458C>T, c.449G>A, and c.457G>A, respectively).
METHODS
PATIENTS
Patients included in this study were originally referred to the Retina Foundation of the Southwest by ophthalmologists specializing in retinal diseases. Blood samples were obtained for genetic screening after obtaining informed consent. After identification of KLHL7 mutations, patients were invited back to the Retina Foundation of the Southwest for comprehensive assessment. In family RFS038, three affected members were available (all male, with age at ascertainment of 45, 50, and 76 years), whereas only the probands were available in families RFS073 (female, with ages at ascertainment of 59 years) and RFS061 (male, with age at ascertainment of 35 years). The tenets of the Declaration of Helsinki were followed, and all the individuals gave written informed consent after a full explanation of the tests and procedures. All the procedures were approved by The University of Texas Southwestern institutional review board.
CLINICAL EXAMINATION
Best-corrected visual acuity was measured with the electronic visual acuity tester using the Early Treatment of Diabetic Retinopathy Study algorithm.3 To examine differences in color discrimination, the Hardy-Rand-Rittler pseudoisochromatic plates and Roth 28-hue desaturated panel test were used. Central visual fields were measured using a Humphrey visual field analyzer (30-2 SITA Fast Program; Humphrey Instruments, San Leandro, California). Peripheral visual fields were measured with Goldmann perimetry using III-4-e and V-4-e light stimulus sizes. After pupil dilation (tropicamide, 1.0%; and phenylephrine hydrochloride, 2.5%) and 30-minute dark adaptation, thresholds were measured with a Goldmann-Weekers dark adaptometer using an 11° achromatic test target located 7° inferior to fixation. Subsequently, full-field electroretinography (ERG) recordings were obtained using the International Society for Clinical Electrophysiology of Vision standard protocol,4 a-wave protocol,5,6 and paired-flash protocol.7–9 After ERG testing, spectral-domain optical coherence tomography (OCT) (Spectralis HRA-OCT, version 5.3.3.0; Heidelberg Engineering, Heidelberg, Germany) was performed. High-speed mode was used to acquire line images from the horizontal meridian. Each image was 30° in length and comprised a mean of 100 frames. Fundus autofluorescence was also obtained in 1 patient with geographic atrophy (GA). Finally, fundus photography (60° by CF-60UD; Canon USA Inc, Lake Success, New York) was captured using an imaging system (MRP; Escalon Medical Group, New Berlin, Wisconsin).
SEGMENTATION OF OCT
Optical coherence tomography images were exported into tagged image file format (from Spectralis HRA-OCT), which also provided the scaling for the acquired OCT images. A custom-designed OCT segmentation program built in IGOR Pro (IGOR Pro 6.12; WaveMetrics, Inc, Lake Oswego, Oregon) was used to profile and measure the thickness of total retina and retinal layers represented in the OCT images. The following thicknesses were measured from the horizontal image of the left eye: retinal nerve fiber layer, total retina (neural retina plus RPE), OS+(photoreceptor outer segment and RPE), and REC+(RPE, photoreceptor outer segment, inner segment, outer nuclear layer, and outer plexiform layer).10 The segmentation approach and strategy were comparable to the software (MATLAB based; MathWorks, Natick, Massachusetts) developed by Hood et al.10
GENETIC TESTING
Genomic DNA was amplified (AmpliTaq Gold 360 master mix; Applied Biosystems, Foster City, California) using standard amplification conditions. The polymerase chain reaction product was treated before sequencing (ExoSapIt; USB, Cleveland, Ohio). Clean polymerase chain reaction product was sequenced (BigDye Terminator version 1.1), treated (BigDye Xterminator), and run on an automated capillary sequencer (3730XL or 3500) (all from Applied Biosystems). Sequence analysis was performed using a software program (SeqScape version 2.7, Applied Biosystems).
RESULTS
PEDIGREES
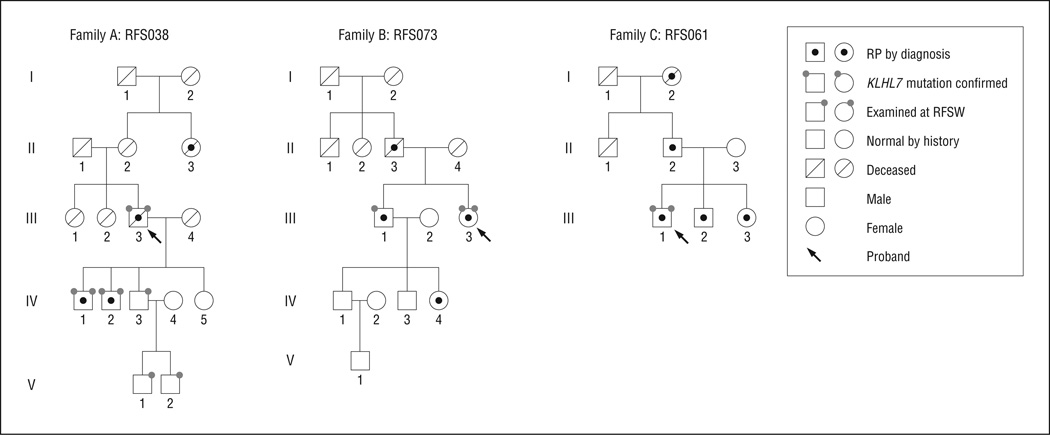
Figure 1 shows pedigrees for the 3 families with mutations in the KLHL7 gene. All 3 families demonstrate adRP transmission patterns spanning 3 generations. The pro-band (III-3) of family A (RFS038) was first ascertained at age 76 years. Three sons (IV-1, IV-2, and IV-3) and 2 grandsons (V-1 and V-2) of the proband (III-3) were also examined. Retinitis pigmentosa was diagnosed in 2 of the sons (IV-1 and IV-2), while the other son (IV-3) and grandchildren (V-1 and V-2) showed normal fundus appearance and normal ERG results. Genetic sequencing of the KLHL7 gene revealed a c.458C>T mutation in affected members of family A, which predicts a p.Ala153Val change at the protein level.1 In family B (RFS073) and family C (RFS061), only the probands were available for on-site examination. Genetic sequencing identified a c.449G>A (p.Ser150Asn) mutation in the KLHL7 gene in family B and a c.457G>A (p.Ala153Thr) mutation in family C.1 The mean (SD) age at ascertainment was 53.0 (15.5) years, with the median age at 50 years.
Figure 1.
Pedigrees of 3 families with KLHL7 mutations. RFSW indicates Retina Foundation of the Southwest; RP, retinitis pigmentosa.
FUNDUS APPEARANCE
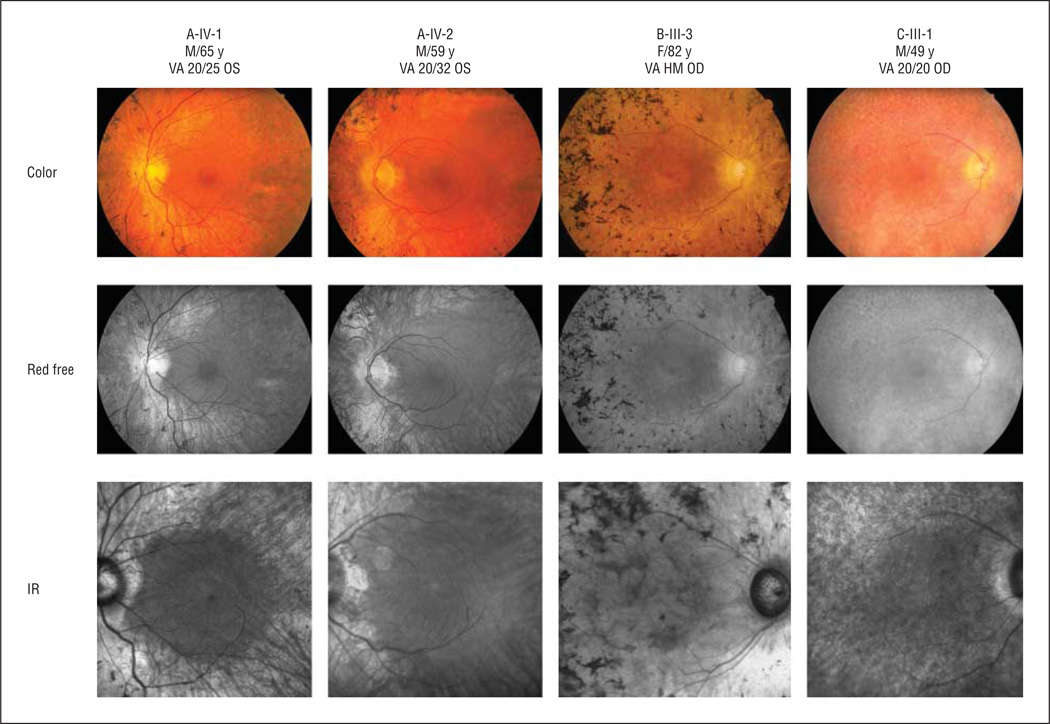
Figure 2 shows the fundus appearance for 4 patients with a KLHL7 mutation. All patients showed characteristic retinal bone spicule pigmentation. The color fundus image (first row), red-free fundus image (second row), and infrared fundus image (third row) showed classic signs of RP, including clear loss of retinal tissue in the periphery, bone spicule pigmentation, arteriolar attenuation, and waxy optic pallor. The right eye of B-III-3 exhibited funduscopic evidence of GA, including macular hypofluorescence visualized by fundus autofluorescence imaging.
Figure 2.
Fundus appearance of patients carrying KLHL7 mutations. In all patients, classic signs of retinitis pigmentosa were obvious, including bone spicule pigmentation, arteriolar attenuation, and waxy optic pallor. Asteroid hyalosis was found in the right eye of C-III-1. B-III-3 showed evidence of geographic atrophy, especially in the infrared (IR) image. The color fundus image (first row), red-free fundus image (second row), and IR fundus image (third row) showed classic signs of retinitis pigmentosa. HM indicates hand motions; VA, visual acuity.
CLINICAL FINDINGS
Table 1summarizes the phenotypic results attained during the most recent visits. For patients 65 years or younger (A-IV-1, A-IV-2, and C-III-1), best-corrected visual acuity was 20/50 or better in at least one eye. At age 76 years, A-III-3 had visual acuity of 20/60 OS but could observe hand motion only in the right eye, possibly because of cataract. B-III-3 was the oldest individual among 3 affected families. At age 82 years, her visual acuity was hand motion in the right eye and counting figures in the left eye. This finding is consistent with the development of GA in both eyes of this patient. In addition, IV-1 and IV-2 of family A showed nonspecific color vision deficiency. Night vision loss was one of the major complaints among patients carrying the KLHL7 mutation. The mean (SD) dark-adapted thresholds were 6.1 (0.3), 3.1 (0.3), and 2.2 (0.2) log micro-apostilibs for A-III-3, A-IV-1, and A-IV-2, respectively, at their most recent visits, which were above the mean (SD) normal value of 1.75 (0.25) log micro-apostilibs.11
Table 1.
Basic Clinical Findings in Family Members Carrying KLHL7 Mutations
| Visual Acuity | |||
|---|---|---|---|
| Family Member | Sex/Age, y | OD | OS |
| A-III-3 | M/76 | HM | 20/60 |
| A-IV-1 | M/65 | 20/20 | 20/20 |
| A-IV-2 | M/59 | 20/32 | 20/32 |
| B-III-3 | F/82 | HM | CF |
| C-III-1 | M/49 | 20/20 | 20/50 |
Abbreviations: CF, counting fingers; HM, hand motion.
These patients identified with KLHL7 mutations have been observed for up to 27 years. In general, visual acuity reduction did not manifest until 50 years of age. Four of 5 patients had visual acuity better than 20/50 in at least one eye through their 60s. Visual acuity showed minimal change over 15 years in A-IV-1 (from age 50–65 years), A-IV-2 (45–59 years), and C-III-1 (35–49 years). Rapid deterioration of visual acuity was observed only in III-3 of family B, who carried the c.449G>A mutation in the KLHL7 gene. The visual acuity in the left eye dropped from 20/40 at age 59 years to 20/200 at age 74 years, presumably because of the development of GA.
VISUAL FIELDS
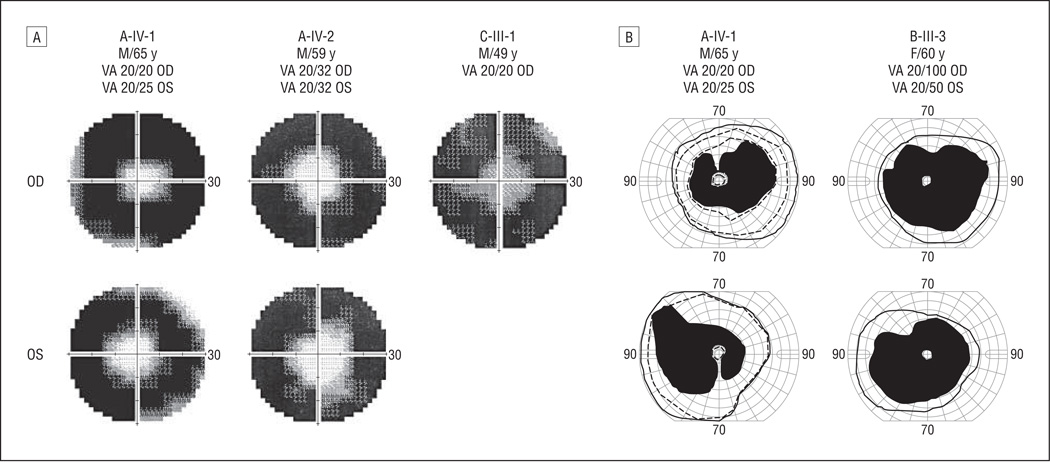
Visual field restriction was the initial motivation for all 3 probands to seek medical attention. Static visual field testing (Humphrey; Carl Zeiss, Inc, Dublin, California) was used to measure the central visual field loss. Figure 3A shows the visual field in the central 60° in A-IV-1 (age, 65 years), A-IV-2 (age, 59 years), and C-III-1 (age, 49 years) at their most recent visits. Visual field diameters were retained in the central 20° in IV-1 and IV-2 of family A. Quantitatively, the reduction in total visual field sensitivity from normal ranged from 85% to 94% in these 2 patients (Table 1). Preserved visual field was less than 10° in the right eye of C-III-1 at age 49 years, with 90% reduction in total visual field sensitivity. The most recent Humphrey visual field test for B-III-3 was at age 63 years, when her central visual field was constricted to less than 10°.
Figure 3.
Restricted visual fields in the central 60° among patients with KLHL7 mutations. A, Three patients (age range, 49–65 years) showed restricted visual fields to central 10° to 20° using the Humphrey visual field analyzer protocol (30-2 SITA Fast Program; Humphrey Instruments, San Leandro, California). High-density regions represent lost visual fields; gray regions indicate transitional zones. B, Goldmann perimetry shows visual field retention in the far periphery (solid lines indicates V-4-e; dashed lines, III-4-e). VA indicates visual acuity.
Goldmann perimetry was available for 2 patients (A-IV-1 and B-III-3). Figure 3B shows the pericentral scotomas in these 2 patients. For A-IV-1 at age 65 years, Goldmann perimetry (V-4-e) showed visual field retention of 70° to 90° temporally and 35° to 55° nasally in addition to the central 10° field. The III-4-e stimulus size was also used for this patient. The resulting visual field (dashed line) was slightly smaller than that when using the V-4-e stimulus size: visual field remains between 70° to 80° temporally and 35° to 50° nasally in addition to central 10°. For B-III-3 at age 60 years, Goldmann perimetry showed visual fields preserved between 65° and 80° temporally in both eyes in addition to 10° central vision. Therefore, results from Goldmann perimetry showed that these 2 patients retained fields in the far periphery in addition to the central field.
Longitudinal data for static perimetry were available for A-IV-1 and A-IV-2. Preserved central visual field showed no change in A-IV-1 between age 62 years (central 20°) and age 64 years (central 20°). However, preserved central visual field constricted from 30° to 20° between age 56 and 59 years in A-IV-2.
FULL-FIELD ERG
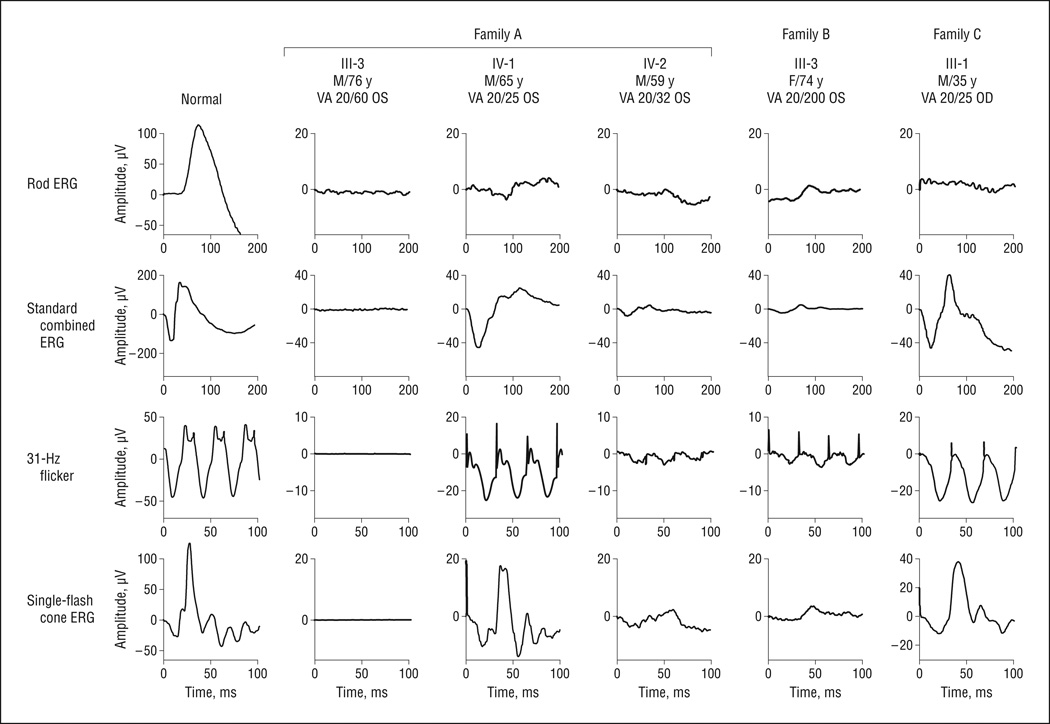
Figure4 shows the ERG waveforms most recently recorded from individuals in the 3 families using the International Society for Clinical Electrophysiology of Vision standard protocol. The proband of family A (III-3 [76-year-oldmale]) had nondetectable ERG signals. The 2 sons with the c.458C>T mutation (IV-1 and IV-2) showed reduced rod amplitudes and delayed 31-Hz flicker implicittimes (Figure4 and Table 2). Probands of family B (III-3) and family C (III-1) also exhibit ERG changes characteristic of RP. Assummarized in Table 2, all patients showed reduced ERG amplitude and delayed 31-Hz flicker implicit time. For C-III-1 at age 35 years, ERG rod response was nondetectable. The 31-Hz response amplitude (25 µV) was reduced 61% from the age-matched mean normal of 65 µV.12 The 31-Hz flicker implicit time (38 milliseconds) was significantly delayed from the age-matched normal upper limit of 32 milliseconds. Longitudinal data showed that the rod response amplitudes in these patients were reduced by at least 92% from the mean normal at ascertainment. At their most recent visits, rod responses were not detectable in any patient except A-IV-1 (rod amplitude, 5 µV). However, preserved cone 31-Hz flicker amplitudes at their most recent visits were a mean (SD) of 23.5% (21.0%) (range, 5%–58%) of age-matched normal values. The mean (SD) decline in light-adapted 31-Hz flicker response was 3.0% (3.0%) per year.
Figure 4.
Most recent International Society for Clinical Electrophysiology of Vision standard full-field electroretinography (ERG) waveforms recorded in 3 families harboring KLHL7 mutations. Compared with a full-field electroretinogram recorded from a healthy individual, patients with KLHL7 mutations showed reduced amplitude and delayed timing to all stimuli. VA indicates visual acuity.
Table 2.
Full-Field Electroretinographic Findings in Left Eyes of Family Members Carrying KLHL7 Mutations
| 31-Hz Flicker | |||||
|---|---|---|---|---|---|
| Age, y | Rod Response,µV | Maximal Response, µV | Amplitude, µV | Annual Loss, % | 31-Hz Implicit Time, ms |
| A-III-3 | |||||
| 76 | NDa | NDa | NDb | NA | NA |
| A-IV-1 | 0.5 | ||||
| 50 | 9.0 | NAc | 29 | 34 | |
| 62 | 7.0 | 81 | 26 | 37 | |
| 65 | 4.6 | 61 | 27 | 36 | |
| A-IV-2 | 6.0 | ||||
| 45 | 4.3 | 34 | 17 | 38 | |
| 56 | NDa | 19 | 6 | 39 | |
| 59 | NDa | 14 | 3 | 33 | |
| B-III-3 | 3.0 | ||||
| 59 | 3.7 | 30 | NA | NA | |
| 60 | 2.9 | 27 | NA | NA | |
| 61 | NDa | 28 | 4 | 40 | |
| 62 | NDa | 35 | 2 | 43 | |
| 63 | NDa | 21 | NA | NA | |
| 74 | NDa | 10 | 3 | 42 | |
| C-III-1 | |||||
| 35 | NDa | 45 | 25 | NA | 38 |
Abbreviations: NA, not available; ND, nondetectable.
Nondetectable at criterion amplitude of 3.0 µV.
Nondetectable at criterion amplitude 0.1 µV.
Data unavailable at International Society for Clinical Electrophysiology of Vision standard flash intensity.
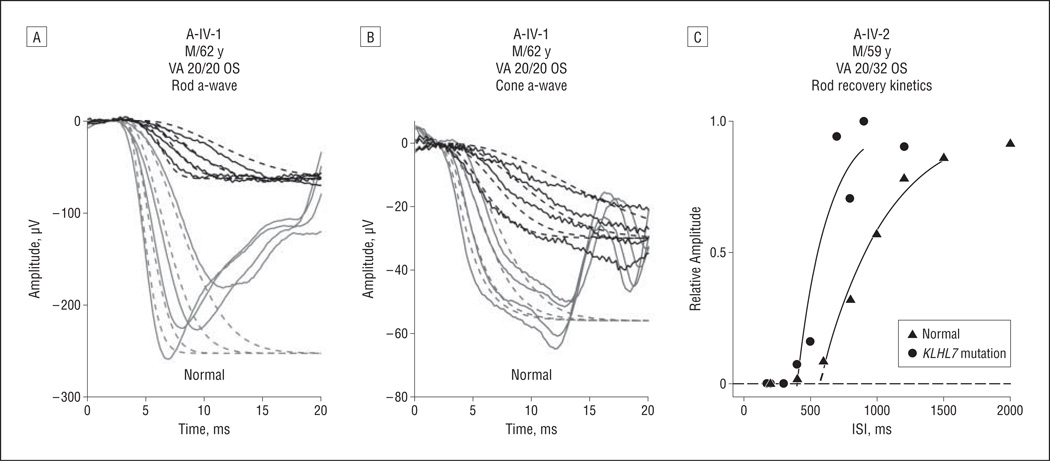
To measure rod and cone activation, we derived maximum amplitude and sensitivity from a-wave responses to high-intensity flashes. Figure 5 A shows rod-only responses to 4 intensities in A-IV-1 at age 62 years. Representative normal responses are shown for comparison. Dashed lines show the best fit of the Hood and Birch model to the data13,14; values for sensitivity and maximum amplitude are given in Table 3. Cone-only responses to the same 4 stimuli are shown in Figure 5B. Except for the earliest visit for A-IV-1, rod sensitivity values were consistently lower than normal. Similarly, cone sensitivity values were lower than normal at most visits.
Figure 5.
Photoreceptor activation and inactivation kinetics in patients with KLHL7 mutations. A and B, Representative derived rod-only (A) and cone-only (B) a-waves to 4 high intensities (3.2, 3.6, 4.1, and 4.4 log micro-apostilibs) in A-IV-1 and in a healthy individual are shown. Solid lines indicates a-wave waveforms; dashed lines, model fit.13,14 Derived rod-only waveforms were obtained by subtracting cone components from dark-adapted waveforms.7 C, Rod recovery kinetics were measured using the paired-flash protocol.7–9 Recovery of rod a-waves was shown in A-IV-2 and in a healthy individual. Recovery kinetics were fitted with an exponential model to derive the rod inactivation fit variable values,7–9 which are indicated by the dashed lines extending from the fitted solid lines. A-IV-1 exhibited shorter-than-normal recovery, with the rod inactivation fit variable of 402 milliseconds for A-IV-2, which is shorter than normal.9 VA indicates visual acuity.
Table 3.
Rod and Cone Activation and Inactivation in Left Eyes of Family Members Carrying KLHL7 Mutations
| Rod Activation Fit | Cone Activation Fit | |||
|---|---|---|---|---|
| Age, y | Sensitivity | Maximum Amplitude | Sensitivity | Maximum Amplitude |
| A-IV-1 | ||||
| 50 | 1.00 | 1.47 | 1.65 | 1.40 |
| 62 | 0.49 | 1.80 | 0.40 | 1.48 |
| 65 | 0.44 | 1.80 | 0.65 | 1.52 |
| A-IV-2 | ||||
| 45 | 0.70 | 1.29 | 0.96 | 1.33 |
| 56 | 0.51 | 1.30 | 0.89 | 1.17 |
| 59 | 0.23 | 1.00 | 0.47 | 1.11 |
| C-III-1 | ||||
| 35 | 0.82 | 1.50 | 1.65 | 1.40 |
Figure 5C shows results from paired-flash experiments in A-IV-2 compared with those of a representative healthy individual. The rod inactivation fit variable values were 421 and 402 milliseconds for A-IV-1 and AIV-2, respectively, at their most recent visits, which were shorter than the mean (SD) normal value of 525 (90) milliseconds (Figure 5C).
OCT FINDINGS
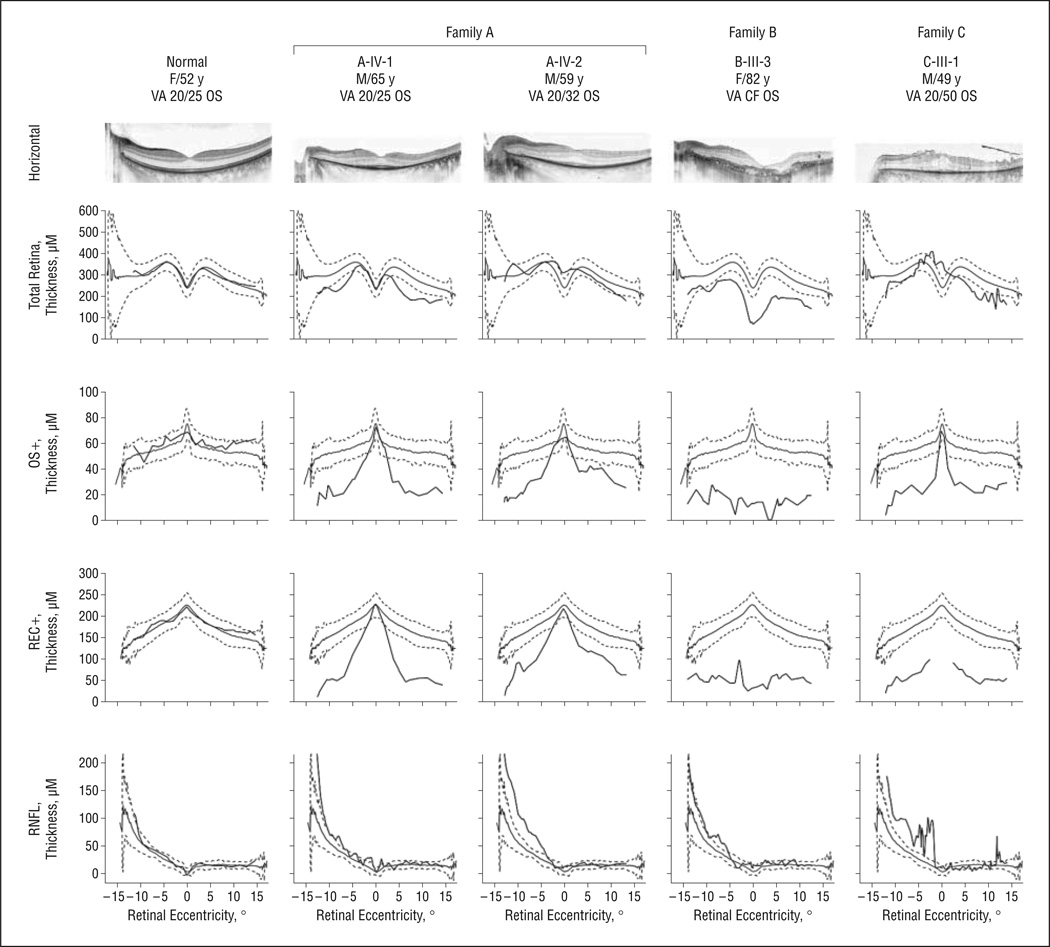
Figure 6 shows a 30° spectral-domain OCT image from the horizontal meridian of the left eye in each patient. In images from A-IV-1 (age, 65 years) and A-IV-2 (age, 59 years), the inner segment–outer segment junction region is only intact within the fovea, consistent with the loss of photoreceptors in the parafoveal region.10,15 Cystoid macular edema was evident only in C-III-1 at age 49 years (Figure 6). The thickness profile of total retina (neural retina thickness plus RPE thickness) falls mostly within the normal range (gray lines indicate the mean [2 SD]) for patients other than B-III-3, who showed thinner-than-normal foveal thickness in total retina at age 82 years. However, OS+ and REC+ thickness profiles revealed significant reduction in the photoreceptor layer in all 4 patients, nasally and temporally. Three patients with remaining central vision (A-IV-1, A-IV-2, and CIII-1) showed normal OS+ and REC+ thickness in the fovea except for REC+ thickness in C-III-1. B-III-3, with reduced vision because of GA, showed thinner-than-normal foveal thickness. The thickness profile of retinal nerve fiber layer appears irregular and tends to be thicker than normal nasally in these patients.
Figure 6.
Spectral-domain optical coherence tomography images acquired from patients carrying KLHL7 mutations (central 30° and horizontal meridian). Images were segmented to show the thickness profile of retinal nerve fiber layer (RNFL), total retina (neural retina plus retinal pigment epithelium), OS+ (photoreceptor outer segment and retinal pigment epithelium), and REC+ (retinal pigment epithelium, photoreceptor outer segment, inner segment, outer nuclear layer, and outer plexiform layer). CF indicates counting fingers; VA, visual acuity.
COMMENT
The mean age at ascertainment of adRP among these patients was 53.0 years, with a median age of 50 years. It has been previously reported that the mean age at onset of adRP, defined as when RP was diagnosed by an ophthalmologist, was 36.9 years, with the median age at 40 years.16 For all types of RP, the mean age at onset was 35.1 years, with the median age at 36.5 years.16 Based on these facts and subjective reports from the patients, it seems that the retinal degeneration associated with KLHL7 mutations has a late onset. In patients for whom longitudinal data were available, progression of visual acuity loss and visual field constriction was slow. In the 2 patients with Goldmann visual field analysis, visual field loss (c.458C>T or c.449G>A) spares the far periphery, which is consistent with a previous study2 based on a family carrying the c.458C>T mutation in the KLHL7 gene. Visual acuity in the left eye of B-III-3 showed a drop from 20/40 at age 59 years to 20/200 at age 74 years in association with GA that developed in this patient. Other patients showed visual acuity better than 20/50 in their 60s.
Similar to other forms of RP, both rodand cone full-field ERG amplitudes were significantly reduced, and31-Hz flicker ERG timing was significantly delayed. The ERG findings are in agreement with the previous studies1,2 based on a single Swedish family harboring a c.458C>T mutation in the KLHL7gene. The diminished cone-mediated response amplitudes shown inFigure4 suggest cone degeneration, which explains the nonspecific color vision deficiency summarized in Table 1. The annual rate of decline in cone 31-Hz flicker response among patients with KLHL7 mutations was 3%, which is lower than the mean10%per year decline that was previously reported among patients with RP.11,17–19
Mutations in the KLHL7 gene seem to be associated with a form of adRP that preferentially affects rod photoreceptors. According to longitudinal data, all patients exhibited significant elevation in dark-adapted threshold at ascertainment. This suggests that night vision loss had developed long before the initial visit. Rod ERG amplitudes to International Society for Clinical Electrophysiology of Vision standard stimuli were severely attenuated or absent. Rod photoreceptor responses to high-intensity stimuli showed decreased sensitivity and gain variables, consistent with previous evidence in adRP.20 A shorter-than-normal photoresponse, consistent with faster-than-normal recovery kinetics, is in agreement with findings in adRP associated with other mutations.9
The remaining photoreceptor thickness indexed by OS+ and REC+ matches well with the visual acuity retained. As shown in Figure 6, preservation of foveal photoreceptor layer predicts a visual acuity of 20/50 or better. On the other hand, the proband (III-3) of family B had no preserved photoreceptor structure in the fovea, which is consistent with visual acuity limited to hand motion sensitivity. Segmented OCT thicknesses (OS+ and REC+) seem to be better indicators of visual acuity than total retinal thickness. For example, the cystoid macular edema present in C-III-1 led to the normal total retinal thickness in the fovea. The thickening of retinal nerve fiber layer in patients with RP shown in Figure 6 is in agreement with what was previously reported.10
In summary, we characterized the visual phenotype of patients with adRP caused by mutations in the BTB-Kelch gene, KLHL7. The mutations described in this study include c.458C>T, c.449G>A, and c.457G>A; the latter two have not been characterized previously. We found that the visual phenotype is similar among patients with these mutations. Late onset, slow progression, strong retention of foveal function, and bilateral concentric constriction of the visual fields with far periphery sparing may guide mutation screening in adRP.
Acknowledgments
Funding/Support: This study was supported by grants from the Foundation Fighting Blindness and NEI R01 09076 from the National Eye Institute.
Footnotes
Author Contributions: Dr Birch had full access to all the data in the study and takes responsibility for the integrity of the data and the accuracy of the data analysis.
Financial Disclosure: None reported.
REFERENCES
- 1.Friedman JS, Ray JW, Waseem N, et al. Mutations in a BTB-Kelch protein, KLHL7, cause autosomal-dominant retinitis pigmentosa. Am J Hum Genet. 2009;84:792–800. doi: 10.1016/j.ajhg.2009.05.007. [DOI] [PMC free article] [PubMed] [Google Scholar]
- 2.Hugosson T, Friedman JS, Ponjavic V, Abrahamson M, Swaroop A, Andrèasson S. Phenotype associated with mutation in the recently identified autosomal dominant retinitis pigmentosa KLHL7 gene. Arch Ophthalmol. 2010;128(6):772–778. doi: 10.1001/archophthalmol.2010.98. [DOI] [PMC free article] [PubMed] [Google Scholar]
- 3.Beck RW, Moke PS, Turpin AH, et al. A computerized method of visual acuity testing: adaptation of the early treatment of diabetic retinopathy study testing protocol. Am J Ophthalmol. 2003;135(2):194–205. doi: 10.1016/s0002-9394(02)01825-1. [DOI] [PubMed] [Google Scholar]
- 4.Marmor MF, Fulton AB, Holder GE, Miyake Y, Brigell M, Bach M. International Society for Clinical Electrophysiology of Vision. ISCEV Standard for full-field clinical electroretinography (2008 update) Doc Ophthalmol. 2009;118(1):69–77. doi: 10.1007/s10633-008-9155-4. [DOI] [PubMed] [Google Scholar]
- 5.Hood DC, Birch DG. The A-wave of the human electroretinogram and rod receptor function. Invest Ophthalmol Vis Sci. 1990;31(10):2070–2081. [PubMed] [Google Scholar]
- 6.Hood DC, Birch DG. Assessing abnormal rod photoreceptor activity with the a-wave of the electroretinogram: applications and methods. Doc Ophthalmol. 1996–1997;92(4):253–267. doi: 10.1007/BF02584080. [DOI] [PubMed] [Google Scholar]
- 7.Birch DG, Hood DC, Nusinowitz S, Pepperberg DR. Abnormal activation and inactivation mechanisms of rod transduction in patients with autosomal dominant retinitis pigmentosa and the pro-23-his mutation. Invest Ophthalmol Vis Sci. 1995;36(8):1603–1614. [PubMed] [Google Scholar]
- 8.Pepperberg DR, Birch DG, Hood DC. Photoresponses of human rods in vivo derived from paired-flash electroretinograms. Vis Neurosci. 1997;14(1):73–82. doi: 10.1017/s0952523800008774. [DOI] [PubMed] [Google Scholar]
- 9.Wen Y, Locke KG, Hood DC, Birch DG. Rod photoreceptor temporal properties in retinitis pigmentosa. Exp Eye Res. 2011;92(3):202–208. doi: 10.1016/j.exer.2010.12.014. [DOI] [PMC free article] [PubMed] [Google Scholar]
- 10.Hood DC, Lin CE, Lazow MA, Locke KG, Zhang X, Birch DG. Thickness of receptor and post-receptor retinal layers in patients with retinitis pigmentosa measured with frequency-domain optical coherence tomography. Invest Ophthalmol Vis Sci. 2009;50(5):2328–2336. doi: 10.1167/iovs.08-2936. [DOI] [PMC free article] [PubMed] [Google Scholar]
- 11.Birch DG, Anderson JL, Fish GE. Yearly rates of rod and cone functional loss in retinitis pigmentosa and cone-rod dystrophy. Ophthalmology. 1999;106(2):258–268. doi: 10.1016/S0161-6420(99)90064-7. [DOI] [PubMed] [Google Scholar]
- 12.Birch DG, Hood DC, Locke KG, Hoffman DR, Tzekov RT. Quantitative electroretinogram measures of phototransduction in cone and rod photoreceptors: normal aging, progression with disease, and test-retest variability. Arch Ophthalmol. 2002;120(8):1045–1051. doi: 10.1001/archopht.120.8.1045. [DOI] [PubMed] [Google Scholar]
- 13.Hood DC, Birch DG. Rod phototransduction in retinitis pigmentosa: estimation and interpretation of parameters derived from the rod a-wave. Invest Ophthalmol Vis Sci. 1994;35(7):2948–2961. [PubMed] [Google Scholar]
- 14.Hood DC, Birch DG. Phototransduction in human cones measured using the a-wave of the ERG. Vision Res. 1995;35(20):2801–2810. doi: 10.1016/0042-6989(95)00034-w. [DOI] [PubMed] [Google Scholar]
- 15.Birch DG, Williams PD, Callanan D, Wang R, Locke KG, Hood DC. Macular atrophy in birdshot retinochoroidopathy: an optical coherence tomography and multifocal electroretinography analysis. Retina. 2010;30(6):930–937. doi: 10.1097/IAE.0b013e3181c720b4. [DOI] [PMC free article] [PubMed] [Google Scholar]
- 16.Tsujikawa M, Wada Y, Sukegawa M, et al. Age at onset curves of retinitis pigmentosa. Arch Ophthalmol. 2008;126(3):337–340. doi: 10.1001/archopht.126.3.337. [DOI] [PubMed] [Google Scholar]
- 17.Berson EL. Long-term visual prognoses in patients with retinitis pigmentosa: the Ludwig von Sallmann lecture. Exp Eye Res. 2007;85(1):7–14. doi: 10.1016/j.exer.2007.03.001. [DOI] [PMC free article] [PubMed] [Google Scholar]
- 18.Berson EL, Rosner B, Weigel-DiFranco C, Dryja TP, Sandberg MA. Disease progression in patients with dominant retinitis pigmentosa and rhodopsin mutations. Invest Ophthalmol Vis Sci. 2002;43(9):3027–3036. [PubMed] [Google Scholar]
- 19.Mendes HF, van der Spuy J, Chapple JP, Cheetham ME. Mechanisms of cell death in rhodopsin retinitis pigmentosa: implications for therapy. Trends Mol Med. 2005;11(4):177–185. doi: 10.1016/j.molmed.2005.02.007. [DOI] [PubMed] [Google Scholar]
- 20.Tzekov RT, Locke KG, Hood DC, Birch DG. Cone and rod ERG phototransduction parameters in retinitis pigmentosa. Invest Ophthalmol Vis Sci. 2003;44(9):3993–4000. doi: 10.1167/iovs.02-1104. [DOI] [PubMed] [Google Scholar]


