

Abstract
During development and regeneration, tissues emerge from coordinated sequences of stem cell renewal, specialization and assembly that are orchestrated by cascades of regulatory signals. The complex and dynamic in vivo milieu cannot be replicated using standard in vitro techniques. Microscale technologies now offer potential for conducting highly controllable and sophisticated experiments at biologically relevant scales, with real-time insights into cellular responses. We developed a microbioreactor providing time sequences of space-resolved gradients of multiple molecular factors in three-dimensional (3D) cell culture settings, along with a versatile, high-throughput operation and imaging compatibility. A single microbioreactor yields up to 120 data points, corresponding to 15 replicates of a gradient with 8 concentration levels. Embryoid bodies (EBs) obtained from human embryonic and induced pluripotent stem cells (hESC, hiPSC) were exposed to concentration gradients of Wnt3a, Activin A, BMP4 and their inhibitors, to get new insights into the early-stage fate specification and mesodermal lineage commitment. We were able to evaluate the initiation of mesodermal induction by measuring and correlating the gene expression profiles to the concentration gradients of mesoderm-inducing morphogens. We propose that the microbioreactor systems combining spatial and temporal gradients of molecular and physical factors to hESC and hiPSC cultures can form a basis for predictable in vitro models of development and disease.
Introduction
‘Biomimetics’, ‘cell niche’ and ‘biologically sound environment’ are nowadays among the most used terms in the biological field1. In our body, cells reside in a complex milieu composed of other cell types, extracellular matrix, and an intricate network of molecular and physical factors that activate signaling pathways and regulate cell fate and function2. Standard in vitro models lack most of this complexity. Also, relatively large operating volumes and periodic exchange of medium do not allow for the generation of precise spatial and temporal patterns of stimulation. Collectively, these limitations result in unrealistic and uncontrollable biological readouts that fall short of predicting the actual in vivo situation, of relevance both to fundamental research and cell and drug screening for medical applications1-4.
Bioengineered environments that combine tissue-specific transport and signaling are becoming critical in studies of development, regeneration and disease under settings predictive of human condition2, 5-8. Technologies reconstructing biologically sound niches along with tight control of the cell environment are starting to offer an entirely new set of tools for stem cell research5, 9-17. In this context, microscale technologies offer potential for conducting highly controllable and highly sophisticated experiments at biologically relevant scales and with real-time insights into cellular responses. Unique advantages of microbioreactors and microfluidic platforms are based on the intrinsically laminar flow in micro-channels and the short transport distances, enabling the maintenance and dynamic changes of well-defined concentration profiles13, 15, 18-20.
During development, regulatory molecules present themselves in the form of spatial and temporal gradients, rather than at discrete levels to which cell cultures are typically exposed. Concentration gradients guide the formation of the embryo’s axes: Anterior-Posterior (A-P) and Proximal-Distal (P-D), and of the primitive streak (PS), the region in the developing embryo from which mesoderm and definitive endoderm originate4. Different regions of the PS constitute different signaling environments that are responsible for induction of specific lineages, with morphogens such as ActivinA, BMP4, and Wnt3a playing major roles in these events4.
hESC are now widely accepted as an ‘ideal’ model for studying the complex developmental events21-23. The emergence of iPSCs has added an additional degree of significance: patient-specific cells can be obtained for a multiplicity of studies ranging from drug screening to personalized medicine24-28.
We hypothesized that the application of spatial and temporal gradients of multiple factors to hESC and hiPSc cultures would provide predictable and realistic in vitro models of development. To test this hypothesis, we designed a microbioreactor platform for stem cell culture with spatial and temporal concentration gradients of regulatory molecules, guiding cell development, specification, and commitment to the mesodermal fate. The platform combines some of the advantages of multi-well plates (small volume, high-throughput, independent wells) and perfusion bioreactors (steady state, enhanced mass transport, application of signals) while respecting the constraints dictated by the biological system of choice (e.g., absence of shear forces). Mathematical modeling of flow and mass transport within the bioreactor was used during the design phase to determine the geometry of the cell culture modules and microfluidic channels. The model predictions were experimentally validated using labeled molecular markers. The technology we developed was then applied to test its efficacy in yielding valuable results on a relevant biological issue: the early mesodermal commitment in human pluripotent stem cells.
The main advantage of our system is that it always works at a steady state, so that all established concentrations are invariant with time, a situation resembling homeostasis in vivo. In addition, if the operator introduces a defined perturbation of concentration in the system, a new steady state is quickly established. In contrast, static well plates operate under conditions that vary from one medium change to another. Thanks to this fundamental property, we were able to evaluate mesodermal induction by measuring and correlating the expression of key genes after exposure to tightly controlled concentration gradients of mesodermal-inducing morphogens.
Methods
Microfluidic bioreactor design, fabrication and assembly
The microbioreactor platform was design to meet a set of specific requirements: (i) generation of multiple concentration gradients, (ii) support of long-term culture of EBs formed from hESCs and hiPSCs in a no-shear environment, (iii) high-throughput studies with large numbers of replicates, (iv) compatibility with on-line imaging and standard analytics, (v) ease of retrieval of the cell samples for additional post-processing, and (vi) capability apply fast dynamic changes of environmental signals (i.e. morphogens and inhibitors). Our platform comprises a matrix of conical microwells each accommodating one single EB. The EBs are protected from hydrodynamic shear forces and exposed to stable concentration gradients generated by an integrated microfluidic platform with independent rows of microwells connected to two lateral flow channels. Microwells within a row communicate between each other, while separate rows represent replicates of the same conditions.
Two configurations were fabricated: (i) microbioreactors with 5 microwells per row for preliminary experiments and gradient-validation studies, and (ii) microbioreactors with 8 and 6 microwells per row for all human pluripotent stem cell studies. The overall dimensions of all microbioreactors, was kept constant for all prototypes. The final designs are shown in Figure 1, with the microwells (diameter: 560μm at the top, 100μm at the bottom; depth: 850μm) and the channels (100μm deep, 150μm wide) connecting the rows of microwells to the lateral flow channels. A single microbioreactor yields 120 data points, with 8 concentration levels across the gradient with 15 replicates.
Fig. 1. Microbioreactor design.
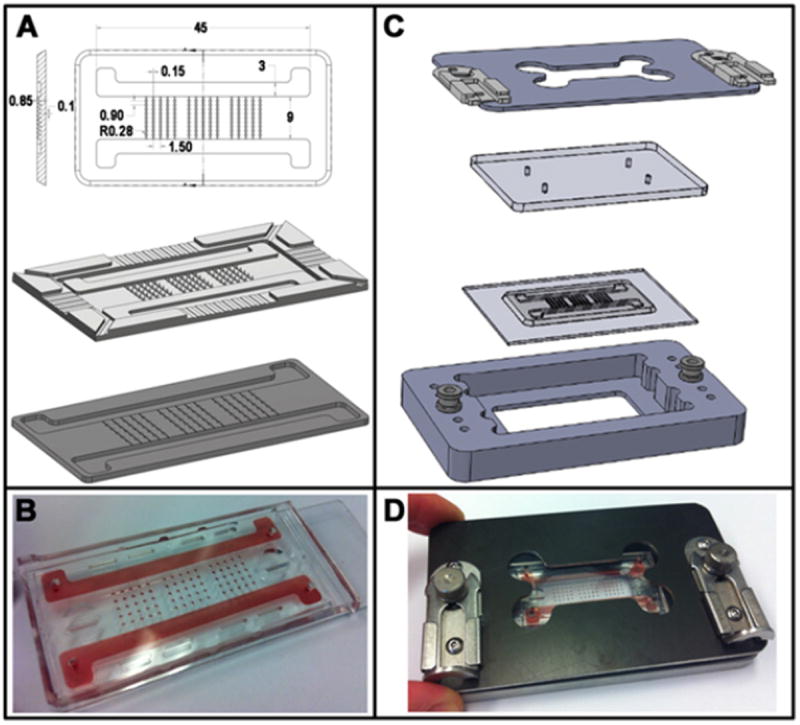
A The microbioreactor comprises a matrix of microwells arranged in independent rows and connected to two lateral flow channels. The overall dimensions (45 × 21mm length × width) are comparable to those of a standard microscope slide. The length and size of the flow channels were kept constant for all prototypes while the number of microwells could be varied. The CAD drawing in panel A contains all relevant dimensions: the top diameter of the 850μm deep microwells is 560μm, tapering towards the bottom with a ~18° angle. 100μm deep × 150μm wide channels connect rows of microwells to the main lateral flow channels. The corresponding mold was fabricated using standard stereolithography rapid prototyping techniques and used to obtain the final PDMS microbioreactor via replica molding. B A color tracer fills the microbioreactor, allowing visualization of the channels and microwells; please refer to Figure 2 for color-coded concentration maps showing the gradient formation. C An exploded view of the individual components of the clamping device: the aluminium base at the bottom, the microbioreactor, a polycarbonate manifold and the clamping plate at the top. Two slide latches were used to tighten the manifold against the microbioreactor ensuring hydraulic sealing. D The assembled device.
The platform was designed with the aid of 3D CAD software. The mold was produced via stereolithography rapid prototyping, and the microfluidic device was replica-molded in poly(dimethylsiloxane) (PDMS). Connections were made using 1.5mm diameter Tygon® tubes (Cole Parmer) and blunt 21G hypodermic needles (Mc Master-Carr).
A reversible hydraulic sealing between the components is ensured by a clamping device, which couples ease of assembly and retrieval of the cell samples. Briefly, the microwell-cell chamber is placed onto a glass slide or PDMS membrane within the aluminum base. A polycarbonate manifold is placed above the cell chamber and the seal is established via a clamping plate, with two slide latches fastened to the clamping plate to provide a seal of the manifold against the cell chamber by mating with studs fixed to the base. Thumbscrews are used to position the height of the spring-loaded studs, allowing fine-tuning of the clamping force. The cell culture area in the assembled platform is optically transparent, for microscopy observation. The microbioreactor, and the tubing, connections, and the clamping system were steam sterilized (20 min at 121°) prior to use.
Computational models of the flow and transport
The flow regimes and concentration profiles were mathematically described by using the 2D incompressible Navier-Stokes equations and the convection-diffusion equations, that were solved numerically using published parameters12. These two non-linear partial differential equations were solved simultaneously using a finite element analysis solver (COMSOL Multiphysics). Relevant parameters characterizing the studied morphogens are listed in Table 1. Simulations were performed in the range of flow and transport conditions encountered during the EB culture, to verify that the gradients’ shape was independent of the applied flow rate and only dependent on the molecular weight (translating into different diffusion coefficients) of the dissolved molecules.
Table 1. Properties of studied morphogens.
The table lists the molecular weight, hydrodynamic radius and diffusion coefficient for each morphogen. Data were calculated using the Stokes-Einstein equation.
| Molecule | MW [KDa] | Hydrodynamic Radius [nm] | Diffusion Coefficient [m2/s] |
|---|---|---|---|
| SB-431542 | 0.4 | 0.86 | 3.19 10-10 |
| Dkk1 | 20 | 3.17 | 8.66 10-11 |
| Wnt3a | 40 | 4.00 | 6.87 10-11 |
| BMP4 | 50 | 4.31 | 6.37 10-11 |
| Activin A | 100 | 5.43 | 5.06 10-11 |
Quantitative fluorescent imaging
To validate the theoretical models, fluorescently labeled dextran was used to study mass transport in the bioreactor. Fluorescein and three different dextran molecules were used to cover the range of molecular weights corresponding to the growth factors of interest: 2′,7′-Dichlorofluorescein diacetate (Sigma) (0.4KDa), Cascade Blue-conjugate (10kDa), Fluorescein-conjugate (40kDa), and Tetramethylrhodamine-conjugate (70kDa), all from Molecular Probes. Each dextran was dissolved in tissue culture medium at 50μg/mL, 0.2% fluorescein was dissolved in PBS. Each solution was perfused through one of the main channels, while the solvent alone was used in the other main channel, using 5mL Becton-Plastik syringes filled with the two solutions and connected to the syringe pumps (Harvard Apparatus) by 1.5mm diameter Tygon® tubing. The system was assembled under the microscope (Leica CTR6000) and fluorescent images were taken at different time points at 10x resolution. The fluorescence intensities were quantified using commercial software (ImageJ) and compared with the model predictions.
hESC and hiPSc culture
Two lines of hESC and one of hiPS cells were used as follows.
H1-BAR-Venus (BAR: β-catenin activated reporter) hESCs
H1 hESC line was modified incorporating a new Wnt/β-catenin reporter system, β -catenin-activated reporter (BAR), and its accompanying control reporter system, found unresponsive BAR (fuBAR)29. hESC colonies were routinely passaged on irradiated MEFs feeder layers (Global Stem) after reaching 80% confluence using 1.75Units/mL Dispase (Invitrogen, Catalog number 17105-041). Cells were expanded in human ESC Knockout Serum Replacement (KSR) medium: DMEM/F12 (1:1) (1X, Invitrogen 11320), Knockout Serum Replacement (Invitrogen 10828) 20%, NEAA Solution, 10mM (Invitrogen 11140) 0.1mM, L-Glutamine, 200mM (Invitrogen 25030) 2.0mM, Sodium Pyruvate (Invitrogen 11360) 1.0mM, Strep Solution (Invitrogen 15140) 1%, β -ME, 55mM (Invitrogen 21985) 0.1mM, FGF-2 (Invitrogen) 8ng/ml. All solutions were sterile filtered and protected from light. Cells were cultured in differentiation medium: DMEM, high glucose (Invitrogen 11995), FBS (Moon lab) 20%, NEAA Solution, 10mM (Invitrogen 11140) 0.1mM, L-Glutamine, 200mM (Invitrogen 25030) 2.0mM, Sodium Pyruvate (Invitrogen 11360) 1.0mM, Pen/Strep Solution (Invitrogen 15140) 1%, β-ME, 55mM (Invitrogen 21985) 0.1mM.
hES2 and BMC1
The second line of hESCs and the hiPSCs were used exactly as described above, except for the compositions of culture media. The growth medium was DMEM/F-12 with KoSR, 20%, MEFs conditioned medium 10%, %, NEAA Solution 0.1mM, L-Glutamine 2mM, Pen/Strep 1:100, FGF-2 (Invitrogen) 20ng/ML. The differentiation medium was STEMPRO 34 plus supplement component according to manufacture (Invitrogen) with Ascorbic Acid (Sigma) 50μg/mL, Transferrin (Roche) 150μg/mL, MTG (in medium) (Sigma) 3μl/ml of diluted 13:1000 BMP4 (Peprotech) 0.5 ng/mL plus Rock inhibitor (Tocris Bioscience) 0.5 μ M in aggregation low adhesion plates (Fisher), and BMP4 (Peprotech) 10 ng/mL, FGF -2 (invitrogen) 5ng/mL and ActivinA (R&D Systems) 6ng/mL at day 1-4.
Formation of EBs
EBs were formed in Aggrewell400 ® plates starting from single cell suspensions. Cells were gently detached using TrypLe and counted. Seeding densities were determined as to have 1,000-1,500 cells/EB. After spinning, plates were left undisturbed for 24h to allow proper aggregation of cells. After aggregation, EBs were recovered from Aggrewell plates, washed and allowed to gravity settle in a 50mL Falcon tube to remove debris and single cells, and transferred to low attachment plates.
Dissociation and immunostaining of EBs
When required for post-gradient exposure analyses, EBs were dissociated to single cells. Briefly, EBs were collected and transferred to Eppendorf microcentrifuge tubes. Culture medium was carefully removed and a washing step with PBS (Ca2+, Mg2+ free) is performed. EBs were then treated with 200μL of a 2mg/mL Collagenase I (Worthington Biochemical) in PBS solution with 20% FCS for 1h at 37°C, carefully resuspended and centrifuged at 800g for 2 min. After removing the supernatant, 50μL of 0.25% Trypsin solution, diluted 1:4 in PBS (Ca2+, Mg2+ free) were added for 5 min while gentle resuspending ensured proper dissociation. Cell suspensions are centrifuged at 1800g for 3 min to remove Tryspin. Cells were then resuspended in the desired antibody solution and plated for subsequent image analysis. Nuclei were counterstained with a 1.5μg/mL Hoechst 33342 (Invitrogen) nuclear dye solution for 10 minutes at 37°C.
Experimental Set-up
Exposure of EBs to multiple gradients of morphogens
Low volumes of high-density suspensions of EBs were carefully dispersed on top of the microwell areas of the microbioreactors, with an excess of approximately 50% EBs, and incubated. After a few minutes the devices were observed under to microscope to confirm proper filling of the microwells. If needed, additional EBs suspension was added to each microbioreactors until ≥90% of the wells were occupied by one single EB each. Typically, after one seeding cycle, the occupancy of the wells was 75 - 80%. The clamping plate was then assembled and the platform was transferred to the incubator. Syringes filled with culture media of a desired composition were connected to the inlets of each platform using Tygon tubing. The flow rate was set at the syringe pump and medium perfusion was initiated.
Wnt3a, ActivinA, BMP4 and their inhibitors Dkk1 and SB-431542 were chosen based on their known effect on inducing mesodermal differentiation and on their levels and temporal sequences defined in the protocol developed in the Keller lab30. The temporal windows of exposure to gradients spanned from day 2 to day 4 following the aggregation of EBs. Combined gradients of Wnt3a, ActivinA and BMP4, with or without opposing gradients of the inhibitors Dkk1 (for Wnt3a) and SB-431542 (for ActivinA) were studied as specified in Table 2 and are intended as ng/mL, where not else specified.
Table 2. Conditions tested.
(a - d) different medium-compositions corresponding to the listed morphogens’ quantities. Left and Right refer to the two streams of fluid entering the microbioreactor. All values, if not specified otherwise, are in ng/mL.
| Left | Right | ||||
|---|---|---|---|---|---|
| Wnt3a | ActivinA | BMP4 | SB-431542 | Dkk1 | |
| a | 100 | 9 | 13 | 0 | 0 |
| b | 0 | 9 | 13 | 0 | 0 |
| c | 0 | 9 | 13 | 5μM | 0 |
| d | 0 | 9 | 13 | 0 | 150 |
qRT-PCR
Total RNA from EBs harvested from microbioreactors was isolated using the TRIzol protocol (Invitrogen) or the RNaqueous Micro kit (Ambion, Life Technologies), treated with DNAse I (Invitrogen) and reverse transcribed with the High Capacity Reverse Transcription kit (Applied Biosystems). Real-time quantitative PCR was carried out with the StepOnePlus qPCR machine (Applied Biosystems). Each cDNA sample was amplified in duplicate or triplicate by using the Fast SYBR Green Master Mix (Applied Biosystems). Relative expression was obtained from Delta Ct values normalized to those obtained from the amplification of GAPDH transcripts.
The primers used for these experiments were as follows: Axin2: Fwd 5’ CTCCCCACCTTGAATGAAGA 3’, Rev 5’ TGGCTGGTGCAAAGACATAG 3’; Brachyury: Fwd 5’ TGTCCCAGGTGGCTTACAGATGAA 3’, Rev 5’ GGTGTGCCAAAGTTGCCAATACAC 3’; Mesp: Fwd 5’ AGCCCAAGTGACAAGGGACAACT 3’, Rev 5’ AAGGAACCACTTCGAAGGTGCTGA 3’; Islet: Fwd 5’ GAAGGTGGAGCTGCATTGGTTTGA 3’, Rev 5’ TAAACCAGCTACAGGACAGGCCAA 3’; KDR: Fwd 5’ GGCCCAATAATCAGAGTGGCA 3’, Rev: 5’ CCAGTGTCATTTCCGATCACTTT 3’; GAPDH: Fwd 5’ AAGGTGAAGGTCGGAGTCAAC 3’, Rev 5’ GGGGTCATTGATGGCAACAATA 3’.
Quantitative fluorescent imaging of Venus expression in cultured cells
As an online semi-quantitative assay, we evaluated H1-BARV cell response by imaging the activation of the Venus-tagged reporter gene. Fluorescent images of the nuclei were used to determine the total cell number. The fraction of cells expressing Venus signal was determined by the pair-to-pair comparisons of fluorescent images of the two channels: Venus in green, and Hoechst in blue, using a script we developed in Matlab. Exposure times, gain and intensity values were the same in all set of images to prevent thresholding mismatches and validate the comparisons between the different conditions. An average of 3 images per EB and 10 EBs per condition were analyzed.
Results
Validation of the microbioreactor
Computational modeling and experimental validations confirmed that the platform assures the stable establishment of complex patterns of stimulation easily modifiable in space (by changing geometric parameters of the microbioreactor) and time (adjusting perfusion settings). Moreover, the gradients were the same for a range of molecular weights of interest (selected to match the size of growth factors). All large molecules (20-100 kDa) are transported at similar rates, and only the SB-431542, a small 0.4KDa molecule, had a higher diffusion coefficient (Table 1). Figure2 illustrates the experimental validation of computational modeling of mass transport within the microbioreactor.
Fig. 2. Mathematical modelling and experimental validation of gradient formation.
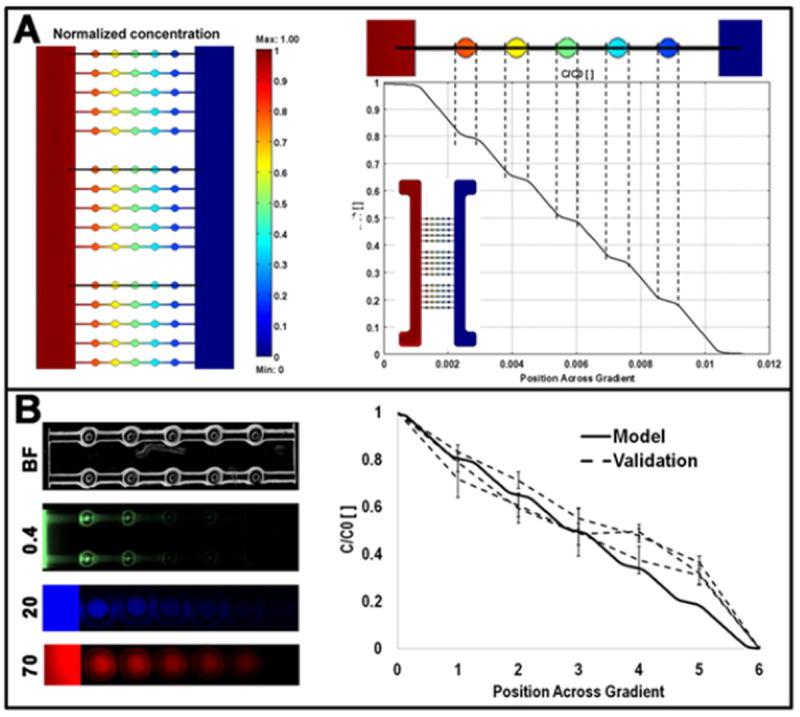
Panel A reports a representative result of the computational modelling of mass transport within the microbioreactor for a 70KDa molecule. The theoretical concentration profile developed across the rows of microwells is plotted in the graph in panel A, where the insert shows the concentration heat-map of the entire microbioreactor. In panel B, images of rows of microwells show graded fluorescence intensities obtained by flowing fluorescent dextrans of defined molecular weights (0.4 to 70KDa). Magnification: 4x for top rows, 10x for bottom rows. Intensity levels were measured in sequences of images to compare the modelled and measured traces (3 dotted lines, corresponding to three rows of microwells from different sections of the microbioreactor).
The theoretical concentration heat-map (zoomed vision of the microwell-cell chamber area) and the profile developed across the rows of microwells are compared with the experimental data in panel B (left). The modeled and experimental values of concentrations were not significantly different.
Table 3 reports approximated average concentrations values, measured as percent of maximum, in the individual microwells for the different microbioreactor configurations used (platforms with 5, 6, and 8 microwells per row). The values were obtained from the modeled concentration profiles.
Table 3. Relative concentrations within the microwells.
Approximated concentrations as % of maximum value in each microwell for the 3 configurations used with 5, 6, and 8 microwell.
| Microwell | 1 | 2 | 3 | 4 | 5 | 6 | 7 | 8 |
|---|---|---|---|---|---|---|---|---|
| Config 1 | 80 | 65 | 50 | 35 | 20 | |||
| Config 2 | 90 | 75 | 60 | 45 | 30 | 15 | ||
| Config 3 | 85 | 75 | 65 | 55 | 45 | 35 | 25 | 15 |
Yield of EB seeding
EBs were easily seeded into the microbioreactors by dispensing suspensions of excess numbers of EBs (based on microscope observation of the docked vs floating EBs). After < 5min of gravity settling, EBs docked into the microwells with an average efficiency of 90%, determined as the fraction of total microwells containing EBs (one per microwell) after two cycles of seeding. The conical geometry of the microwells maintains EBs in place and protects them from shear forces during culture (Figure 3).
Fig. 3. Cultivation of embryoid bodies (EBs) formed from human stem cells in the microbioreactor.
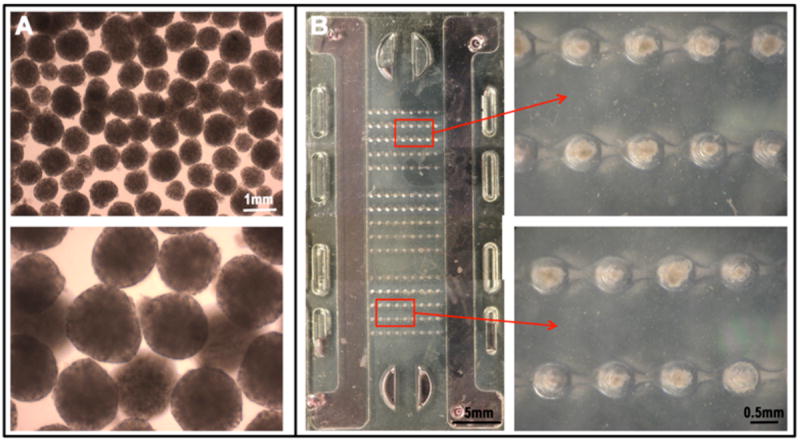
A Uniformly sized EBs are formed from human ES cells (hES2 line) and hiPS cells (BMC1 line) using Aggrewell ® plates; magnifications 4X and 10X, respectively. B An entire microbioreactor seeded with EBs (images taken at the stereoscope). Magnified inserts: independent rows of microwells with individual EBs.
EBs made from hESC and hiPSc were cultured within these platforms for up to four days with exposure to the microfluidic-driven concentration gradients, after which time they were retrieved for subsequent analyses. A preliminary validation of the device was performed flowing Calcein AM enriched medium (5 μM) through one of the flow channels, thus generating a linear gradient of the membrane dye which resulted in a proportionate fluorescent stain of the EBs inside the microwells (Supplementary Figure 1).
Responses of H1-BARV-EBs to Wnt3a/ActivinA/BMP4 concentration gradients
After exposure to a concentration gradient (condition ‘a’ in Table 2), H1-BARV cells expressed an on-line detectable Venus signal. Fluorescence could be observed during culture with EBs docked inside the microwells, as well as on harvested EBs (second row of Figure 4). Qualitative differences were observed right away. Given the three dimensionality of the EBs, additional processing was needed to assess the levels of gene expression. The level of activation of the Wnt3a/β-catenin signaling pathway was evaluated using the image analysis of the Venus signal (at a single cell level on dissociated EBs) and q-PCR for Axin2, a canonical Wnt/β-catenin target gene31.
Fig. 4. Gradient experiments: Wnt3a/β-catenin signaling pathway activation in H1-BARV EBs.
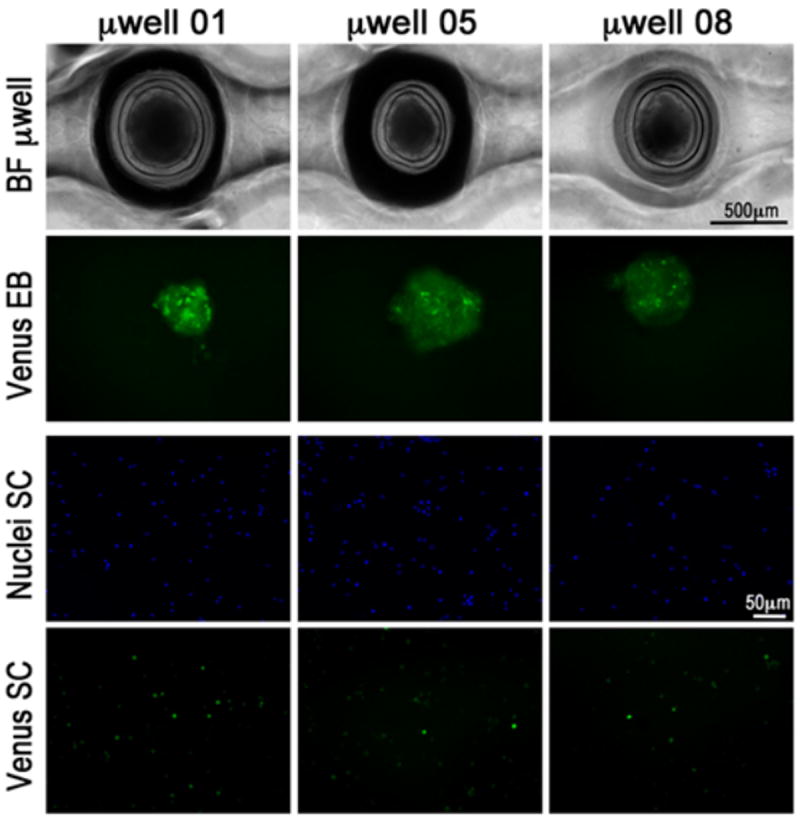
EBs at day 3 post aggregation were exposed for 24 hours to a combined Wnt3a-ActivinA-BMP4 gradient (composition ‘a’ as in Table 2). Bright field images of three EBs-containing microwells taken from the same row confirm the maintenance of a correct EBs shape and positioning inside the microwells settling below the top open surface. EBs could be retrieved for subsequent analyses. Venus signal was detected as seen in the second row of the panel. In order to quantify the number of Venus positive cells per condition, the EBs are dissociated to single cells, stained with a nuclear dye and replated. The bottom two rows in the figure show the cells marked with Hoechst nuclear stain (top) and Venus expressing cells.
The obtained results (Figure 5) showed that the pathway activation was not directly proportional the concentration of Wnt3a in culture medium (which correlated to the position of each EBs in the row of microwells). Instead, distinct concentration levels were identified that resulted in increased gene expression as assessed by both the fraction of Venus positive cells and by qPCR data. This result is consistent with the notion that the combined action of the three morphogens stimulates complex signaling cascades, resulting in non-proportionate cell responses.
Fig. 5. Image analysis and q-PCR: quantification of Wnt3a/β-catenin signalling pathway activation in H1-BARV EBs following gradient exposure.
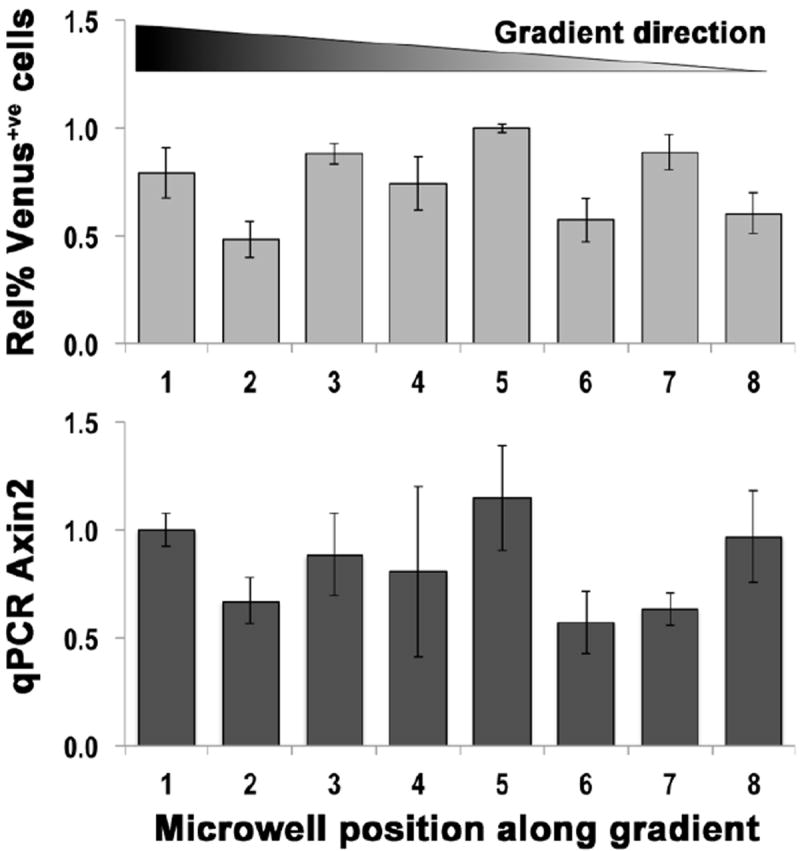
The extent of activation of the Wnt3a/β-catenin signalling pathway was independently evaluated using two methods: image analysis of the Venus signal and q-PCR for Axin2, a canonical Wnt/β-catenin target gene. Sequences of fluorescent images of single cell suspensions from dissociated EBs harvested from rows of microwells were subjected to image analysis to quantify Venus expression. An average of 3 images per EB and 10 EBs per conditions were processed. The top histogram plots the obtained results for EBs contained in microwells from 1 to 8 across the gradient. The bottom histogram reports results of q-PCR for Axin2 in corresponding EBs from a parallel experiment.
The top histogram plots the obtained results for EBs contained in microwells from 1 to 8 across the gradient. The bottom histogram reports results of q-PCR for Axin2 in corresponding EBs from a parallel experiment; its activation profile confirmed the Venus quantification.
Responses of hES2-EBs and BMC1-EBs to mesodermal-inducing gradients of morphogens
The set of genes that we chose to monitor are markers and regulators of early mesendodermal (Brachyury T) and mesodermal (Mesp1, Islet1, KDR) commitment32. Mesp1 and Islet1 have been described as ‘master regulators’ of cardiac progenitor specification, where Mesp1 drives cardiac differentiation by inhibiting canonical Wnt signaling (a DKK1-mediated process)33. In turn, Wnt3a/β-catenin is a pathway that was proved to have a biphasic effect on cardiogenesis34. KDR is a known marker for cardiac mesoderm populations35 and Brachyury (T) is a mesendodermal marker induced by Wnt.
EBs were subjected to a stable gradient of these morphogens (compositions b-d in Table 2) for 24 hours starting at either day 2 or day 3 since initiation of differentiation (day 0: the time of EBs formation). These temporal windows for the gradient experiments were determined based on the known sequences of events leading to cardiac mesoderm specification30, 36-37.
Parallel static experiments were performed for all conditions tested, exposing EBs populations to different levels of concentrations that were within the range generated by the microbioreactors. EBs were seeded onto the microbioreactors as for the gradients experiments and allowed to settle inside the microwells. The microbioreactors were then operated statically, each exposing the docked EBs to discrete and uniform microenvironment compositions chosen within the range covered by the gradients. The results obtained with hES2-derived EBs (Supplementary Figure 2) confirm the pattern of expression that will be detected in the case of the graded exposure. The modulation of the local microenvironment composition led to the formation of more complex gene expressions patterns. Also, control experiments exposing EBs to “flat gradients” obtained for identical cocktails of cytokines in both flow channels resulted in flat gene expression profiles (Supplementary Figure 3).
Figure 6 shows the expression of representative mesodermal and mesendodermal genes in hESCs (hES2 line) and hiPSCs (BMC1 line) following exposure to a combined Wnt3a/ActivinA/BMP4 gradient. Once again, gene expression profiles changed between the microwells and in a cell-line dependent manner. Major differences could be detected in the expression of early genes (T and Mesp1) while more subtle differences were observed in expression levels appeared of later genes. The relative expressions for T and Mesp1 were bimodal, indicating differential lineage specification mechanisms within the EBs exposed to the particular local microenvironment along the concentration gradient. Notably, significant differences in the relative expressions of these genes can be detected in the case of EBs cultured in the perfused microbioreactors (which operate at steady-state conditions), as shown in Figure 6. On the contrary, even if resulting in similar expression patterns, the levels measured in statically operated microbioreactors fail to reach statistical significance, as shown in Supplementary Figure 2. From the expression levels measured for the BMC1 hiPSC line, we noticed the presence of two local maxima, corresponding to microwells 3 (local maximum) and 6 (absolute maximum). The microenvironment of microwell 6 (20-30% of the initial factor concentrations) led to the highest expression levels of T, Mesp1 and KDR, while the second local maximum was expressed at the higher concentrations of microwell 3 (60-70% of the initial factor concentrations). In this case however, we recorded a lower KDR expression, suggesting a delayed progression along the mesodermal lineage (KDR is expressed later than T and Mesp1 in the cascade of events leading to mesoderm induction). For the hES2 hESC line, a similar behavior could again be observed in microwell 6, but an evident local maximum corresponding to microwell 3 failed to show. This evidence suggests that similar expression levels could be triggered by different medium compositions, further hinting at the potential role of endogenous mechanisms activated by increased/decreased levels of stimuli.
Fig. 6. Expression of mesodermal genes on hES2- and BMC1-derived EBs following combined Wnt3a/ActivinA/BMP4 gradients exposure.
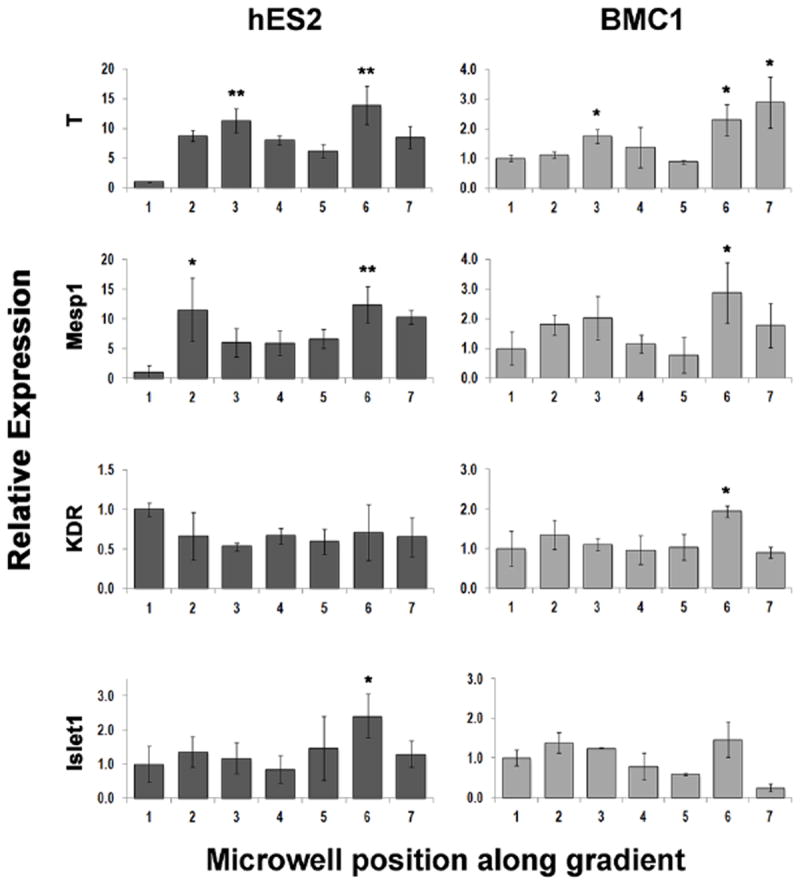
Levels of gene expression, determined by qPCR and relative to GAPDH, are shown for representative mesodermal and mesendodermal genes following exposure of hESC (hES2 line, left) and hiPSC (BMC1 line, right) to a combined Wnt3a/ActivinA/BMP4 gradient. EBs were subjected to a stable gradient of the three morphogens for 24 hours between day3 and day4 since initiation of differentiation. Medium compositions were as in condition ‘b’ of Table 2. Statistical significance was measured comparing data points to the values in microwell 1. *p<0.05, **p<0.005.
In another set of experiments, we exposed hES2-EBs and BMC1-EBs to opposing gradients of ActivinA/BMP4 and either SB-431542 (ActivinA inhibitor) or Dkk1 (canonical Wnt signaling inhibitor). The histograms in Figure 7 summarize the most relevant findings and compare the gene expression profiles in control experiments, performed without opposing inhibitors- gradients, with those in double-gradients runs. The effects of exogenously inhibited Activin signaling via SB counter-gradient treatment are shown in the left column; Wnt3a inhibition via Dkk1 counter-gradient is in the right column. Again, significant differences were observed in the early vs late genes expression profiles. The cells were differentially activated by the local microenvironment, in response to concentration gradients.
Fig. 7. q-PCR of mesodermal genes in hES2- and BMC1-derived EBs following exposure to opposing gradients of ActivinA/BMP4 and SB-431542 or Dkk1.
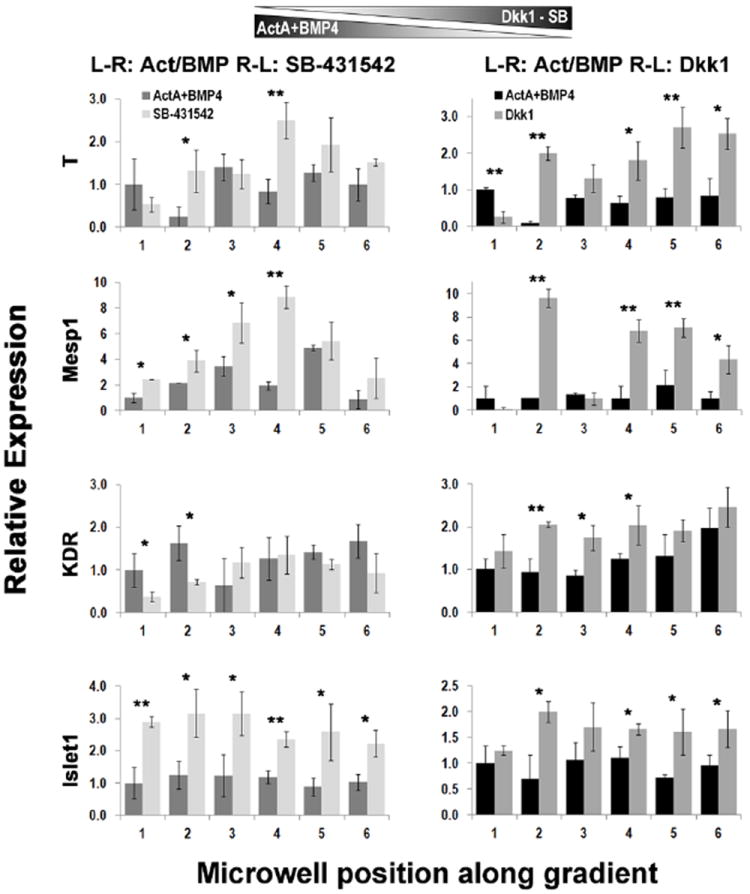
Quantification of the expression level, normalized to GAPDH, of representative mesodermal and mesendodermal genes comparing control experiments, performed without opposing inhibitorsgradients, with double-gradients runs with inhibitors. hESCs (hES2 line) are shown on the left and hiPSCs (BMC1 line) on the right. EBs were subjected to a stable gradient of the two morphogens for 24 hours between day3 and day4 of induction. Medium compositions were as in condition ‘c’ (left column) and ‘d’ (right column) of Table 2. Statistical significance was measured comparing pairs of data points obtained from control experiment and the corresponding inhibitor-based gradient for each microwell. *p<0.05, **p<0.005.
Interestingly, we observed that Activin inhibition resulted in increased expression levels of all earlier genes, suggesting that: (i) these cells might endogenously produce ActivinA, thus further increasing its concentration in the local microenvironment and bringing it to sub-optimal levels, and that (ii) partial inhibition of this signaling pathway might be required to optimally induce early mesodermal/mesendodermal specification. Wnt inhibition via Dkk1 appeared to elicit an almost linear correlation with the expression levels, with a direct proportionality for T and KDR, and indirect proportionality for Mesp1.
Conclusions and Discussion
We designed a microbioreactor platform capable of generating stable concentration gradients over a large number of EBs (120 in a system comparable by size to a microscope slide) in a shear protective environment. These microbioreactors provide multiple gradients of molecular factors in 3D cell culture settings, with complex sequences of time- and space- resolved gradients, and the application of fast dynamic changes of environmental signals. In developmental studies of human embryonic (hESC) and induced pluripotent stem cells (hiPSC), we were able to screen for a large number of variables (concentration levels, cocktails of factors and their inhibitors, space and time gradients). Due to the fast establishment of steady-state conditions, these microbioreactors ensured maintenance of precise and time-invariant compositions of the soluble microenvironment to which individual 3D stem cell aggregates are exposed.
We show the modulation of pathway activations by the local microenvironment to result in non-linear cell responses to linear concentration gradients. This is a physiologically relevant behavior, since the mesodermal/mesendodermal differentiation programs are tightly regulated by sequences of factors evolving in space and time4. The EBs can respond by ‘proper’ activation of the mesodermal key genes only if and when exposed to the correct levels of cytokines. The use of inhibitors confirmed the non-proportional response in the cultured EBs. Correlations and mismatches between expression levels of activated genes following precise spatial-temporal stimulation suggest induction of specific differentiation programs. Snapshots of relative gene expression levels at defined times post-exposure to the concentration gradients were compatible with previous data 37.
Several publications reporting devices for screening of molecular factors in cell culture can be found in the literature, among which we cite the work of Kim et al38. However, the biological questions we investigated required the development of a novel microfluidic device we describe here that is different from previously reported systems in several respects. First, we performed 3D culture while most other systems allow only for 2D culture. Second, our seeding method, by docking of EBs does not expose the cells to shear stress, while other systems38 employ dynamic loading of the cells. In addition, the biological samples are easily retrieved from our system at any time during culture, something that is not typically possible with other systems. Finally, the high throughput characteristics of our system reside with the large number of replicates: ≥10 EBs per condition were tested in each microbioreactor, whereas most of the existing devices generate matrices of different conditions with one single sample per condition. For a study like ours, the intrinsic variability of the cell phenotypes requires significant numbers of replicates for assessing statistical differences between the groups.
Some of the interesting future directions include: (i) estimating the effects of compensatory mechanisms and (ii) endogenously produced signaling molecules on upstream and downstream effects in neighboring EBs occupying microwells of the same row. The potential compensatory mechanisms activated by a biological system (a differentiating EB in our case) when exposed to defined levels of induction media, could be partially responsible for the lack of direct proportionality between gene expression and morphogen concentrations. This effect could be EB-autonomous (i.e., with a single EB activating its own compensation) or due to a cross-talk between adjacent EB microenvironments, with secretion of diffusing factors that activate feedback loops mechanisms. Future studies will focus on analyzing the gene expression profile of EBs when cultured at defined positions across the gradients without any other EB occupying neighboring microwells (i.e. one EB per row of microwells, multiple reactors in parallel as biological replicas). We are also currently developing a system allowing direct formation of EBs within the bioreactors microwells. Furthermore, we are adapting our microbioreactors to be compatible with the Fluidigm Single-Cell Gene Expression platforms (Fluidigm Corp, South San Francisco, CA 94080), which we have used in studies of directed differentiation of human stem cells. This will collectively enable us to implement longer and multi-step differentiation protocols by culturing EBs in the microbioreactor from aggregation to later stages of mesodermal differentiation while performing different time point analyses along the differentiation process.
In summary, our approach helps recapitulate some aspects of the patterns of stimulation that direct cells differentiation during cardiac development. The main aim of this paper is proving the capability of our device to sustain cell differentiation in a physiologic microenvironment, to apply controlled stimulation paradigms guiding cell differentiation and to finally allow obtaining relevant readouts from the biological samples. To this end, our platform can generate dynamically changing spatial and temporal gradients of multiple factors (promoters and inhibitors) and enable studies of the effects of these factors on lineage specification. We developed a simple, highly controllable device that allows studying complex interactions of signaling factors. We are just starting to see the full potential of such system, and the readouts and outcomes we can obtain. Some of the most interesting future applications will include the optimization of conditions for generating human progenitor cells and the establishment of physiological models for screening of therapeutic cells and drugs.
Supplementary Material
Acknowledgments
Elisa Cimetta is a New York Stem Cell Foundation-Druckenmiller Fellow (NYSCF-D-FO2O). We acknowledge support from the NIH (HL076485, EB002520, and EB015888 to GVN, GM081619 to RTM) and NYSTEM (C026449 to GVN).
Footnotes
Electronic Supplementary Information (ESI) available: three supplementary figures. See DOI: 10.1039/b000000x/
References
- 1.Powell K. Nature. 2005;435:268–270. doi: 10.1038/435268a. [DOI] [PubMed] [Google Scholar]
- 2.Kaplan D, Moon RT, Vunjak-Novakovic G. Nature Biotechnology. 2005;23:1237–1239. doi: 10.1038/nbt1005-1237. [DOI] [PubMed] [Google Scholar]
- 3.Metallo CM, Mohr JC, Detzel CJ, DePablo JJ, VanWie BJ, Palecek SP. Biotechnology Progress. 2007;23:18–23. doi: 10.1021/bp060350a. [DOI] [PubMed] [Google Scholar]
- 4.Murry CE, Keller G. Cell. 2008;132:661–680. doi: 10.1016/j.cell.2008.02.008. [DOI] [PubMed] [Google Scholar]
- 5.Khademhosseini A, Langer R, Borenstein J, Vacanti JP. PNAS. 2006;103:2480–2487. doi: 10.1073/pnas.0507681102. [DOI] [PMC free article] [PubMed] [Google Scholar]
- 6.Moore KA, Lemischka IR. Science. 2006;311:1880–1885. doi: 10.1126/science.1110542. [DOI] [PubMed] [Google Scholar]
- 7.Spradling A, Drummond-Barbosa D, Kai T. Nature. 2001;414:98–104. doi: 10.1038/35102160. [DOI] [PubMed] [Google Scholar]
- 8.Watt FM, Hogan BLM. Science. 2000;287:1427–1430. doi: 10.1126/science.287.5457.1427. [DOI] [PubMed] [Google Scholar]
- 9.Andersson H, van den Berg A. Lab Chip. 2004;4:98–103. doi: 10.1039/b314469k. [DOI] [PubMed] [Google Scholar]
- 10.Breslauer DN, Lee PJ, Lee LP. Mol BioSyst. 2006;2:97–112. doi: 10.1039/b515632g. [DOI] [PubMed] [Google Scholar]
- 11.Chen DS, Davis MM. Curr Opin Chem Biol. 2006;10:28–34. doi: 10.1016/j.cbpa.2006.01.001. [DOI] [PubMed] [Google Scholar]
- 12.Cimetta E, Cannizzaro C, James R, Biechele T, Moon RT, Elvassore N, Vunjak-Novakovic G. Lab Chip. 2010;10:3277–3283. doi: 10.1039/c0lc00033g. [DOI] [PMC free article] [PubMed] [Google Scholar]
- 13.Cimetta E, Figallo E, Cannizzaro C, Elvassore N, Vunjak-Novakovic G. Methods. 2009;47:81–89. doi: 10.1016/j.ymeth.2008.10.015. [DOI] [PMC free article] [PubMed] [Google Scholar]
- 14.Haeberle S, Zengerle R. Lab Chip. 2007;7:1094–1110. doi: 10.1039/b706364b. [DOI] [PubMed] [Google Scholar]
- 15.Jeon NL, Dertinger SKW, Chiu DT, Choi IS, Stroock AD, Whitesides GM. Langmuir. 2000;16:8311–8316. [Google Scholar]
- 16.Keenan TM, Folch A. Lab Chip. 2007;8:34–57. doi: 10.1039/b711887b. [DOI] [PMC free article] [PubMed] [Google Scholar]
- 17.Whitesides GM. Nature. 2006;442:368–373. doi: 10.1038/nature05058. [DOI] [PubMed] [Google Scholar]
- 18.Chung S, Sudo R, Mack PJ, Wan CR, Vickerman V, Kamm RD. Lab Chip. 2009;9:269–275. doi: 10.1039/b807585a. [DOI] [PubMed] [Google Scholar]
- 19.Diao J, Young L, Kim S, Fogarty EA, Heilman SM, Zhou P, Shuler ML, Wu M, DeLisa MP. Lab Chip. 2006;6:381–388. doi: 10.1039/b511958h. [DOI] [PubMed] [Google Scholar]
- 20.Toetsch S, Olwell P, Prina-Mello A, Volkov Y. Integrative Biology. 2009:170–181. doi: 10.1039/b814567a. [DOI] [PubMed] [Google Scholar]
- 21.Pouton CW, Haynes JM. Advanced Drug Delivery Reviews. 2005;57:1918–1934. doi: 10.1016/j.addr.2005.08.003. [DOI] [PubMed] [Google Scholar]
- 22.Metallo CM, Azarin SM, Ji L, DePablo JJ, Palecek SP. Journal of Cellular and Molecular Medicine. 2008;12:709–729. doi: 10.1111/j.1582-4934.2008.00228.x. [DOI] [PMC free article] [PubMed] [Google Scholar]
- 23.Zhu WZ, Hauch KD, Xu C, Laflamme MA. Transplant Rev. 2009;23:53–68. doi: 10.1016/j.trre.2008.05.005. [DOI] [PMC free article] [PubMed] [Google Scholar]
- 24.Unternaehrer JJ, Daley GQ. Philosophical Transactions of the Royal Society B. 2011;366:2274–2285. doi: 10.1098/rstb.2011.0017. [DOI] [PMC free article] [PubMed] [Google Scholar]
- 25.Wobus AM, Loser P. Archives of Toxicology. 2011;85:79–117. doi: 10.1007/s00204-010-0641-6. [DOI] [PMC free article] [PubMed] [Google Scholar]
- 26.Chan IS, Ginsburg GS. Annual Review of Genomics and Human Genetics. 2011;12:217–244. doi: 10.1146/annurev-genom-082410-101446. [DOI] [PubMed] [Google Scholar]
- 27.Grskovic M, Javaherian A, Strulovici B, Daley GQ. Nature Reviews Drug Discovery. 2011;10:915–929. doi: 10.1038/nrd3577. [DOI] [PubMed] [Google Scholar]
- 28.Dimos JT, Rodolfa KT, Niakan KK, Weisenthal LM, Mitsumoto H, Chung W, Croft GF, Saphier G, Leibe lR, Goland R, Wichterle H, Henderson CE, Eggan K. Science. 2008;321:1218–1221. doi: 10.1126/science.1158799. [DOI] [PubMed] [Google Scholar]
- 29.Davidson KC, Adams AM, Goodson JM, McDonald CE, Potter JC, Berndt JD, Biechele TL, Taylor RJ, Moon RT. PNAS. 2012;109:4485–4490. doi: 10.1073/pnas.1118777109. [DOI] [PMC free article] [PubMed] [Google Scholar]
- 30.Yang L, Soonpaa MH, Adler ED, Roepke TK, Kattman SJ, Kennedy M, Henckaerts E, Bonham K, Abbott GW, Linden RM, Field LJ, Keller GM. Nature. 2008 doi: 10.1038/nature06894. [DOI] [PubMed] [Google Scholar]
- 31.K M. Current Drug Targets. 2008;9:565–570. doi: 10.2174/138945008784911750. [DOI] [PubMed] [Google Scholar]
- 32.Burridge PW, Keller G, Gold JD, Wu JC. Cell Stem Cell. 2012;10:16–28. doi: 10.1016/j.stem.2011.12.013. [DOI] [PMC free article] [PubMed] [Google Scholar]
- 33.David R, Brenner C, Stieber J, Schwarz F, Brunner S, Vollmer M, Mentele E, Muller-Hocker J, Kitajima S, Lickert H, Rupp R, F WM. Nature Cell Biology. 2008;10:338–345. doi: 10.1038/ncb1696. [DOI] [PubMed] [Google Scholar]
- 34.Ueno S, Weidinger G, Osugi T, Kohn AD, Golob JL, Pabon L, Reinecke H, Moon RT, Murry CE. PNAS. 2007;104:9685–9690. doi: 10.1073/pnas.0702859104. [DOI] [PMC free article] [PubMed] [Google Scholar]
- 35.Kattman SJ, Witty AD, Gagliardi M, Dubois NC, Niapour M, Hotta A, Ellis J, Keller G. Cell Stem Cell. 2011;8:228–240. doi: 10.1016/j.stem.2010.12.008. [DOI] [PubMed] [Google Scholar]
- 36.Jackson SA, Schiesser J, Stanley EG, Elefanty AG. PloS ONE. 5:e10706. doi: 10.1371/journal.pone.0010706. [DOI] [PMC free article] [PubMed] [Google Scholar]
- 37.Dubois NC, Craft AM, Sharma P, Elliott DA, Stanley EG, Elefanty AG, Gramolini A, Keller G. Nature Biotechnology. 2011;29 doi: 10.1038/nbt.2005. [DOI] [PMC free article] [PubMed] [Google Scholar]
- 38.Kim J, Taylor D, Agrawal N, Wang H, Kim H, Han A, Rege K, Jayaraman A. Lab on a Chip. 2012;12 doi: 10.1039/c2lc21202a. [DOI] [PubMed] [Google Scholar]
Associated Data
This section collects any data citations, data availability statements, or supplementary materials included in this article.