

Background: It is unclear whether ER stress and associated unfolded protein response (UPR) can influence oncogene-induced senescence.
Results: ER stress attenuated senescence by modulating kinases, and a positive feed forward loop was delineated where ER stress caused loss of senescence and promotion of tumorigenesis.
Conclusion: A new role for ER stress and UPR that attenuates H-RAS-induced senescence was discovered.
Significance: PPARβ/δ may suppress RAS-dependent tumorigenesis.
Keywords: Cancer, Cancer Biology, Cancer Therapy, Keratinocyte, Tumor Suppressor Gene, H-RAS-induced Senescence, Oncogene-induced Endoplasmic Reticulum Stress, Peroxisome Proliferator-activated Receptor β/δ
Abstract
Endoplasmic reticulum (ER) stress and ER stress-associated unfolded protein response (UPR) can promote cancer cell survival, but it remains unclear whether they can influence oncogene-induced senescence. The present study examined the role of ER stress in senescence using oncogene-dependent models. Increased ER stress attenuated senescence in part by up-regulating phosphorylated protein kinase B (p-AKT) and decreasing phosphorylated extracellular signal-regulated kinase (p-ERK). A positive feed forward loop between p-AKT, ER stress, and UPR was discovered whereby a transient increase of ER stress caused reduced senescence and promotion of tumorigenesis. Decreased ER stress was further correlated with increased senescence in both mouse and human tumors. Interestingly, H-RAS-expressing Pparβ/δ null cells and tumors having increased cell proliferation exhibited enhanced ER stress, decreased cellular senescence, and/or enhanced tumorigenicity. Collectively, these results demonstrate a new role for ER stress and UPR that attenuates H-RAS-induced senescence and suggest that PPARβ/δ can repress this oncogene-induced ER stress to promote senescence in accordance with its role as a tumor modifier that suppresses carcinogenesis.
Introduction
The role of ER2 stress and ER stress-associated UPR in tumorigenesis remains unclear because they can both promote cancer cell survival or cell death under different cellular contexts (1, 2). p-AKT signaling, which can increase ER stress (3), also influences oncogene-induced senescence. Oncogene-induced senescence is thought to be a protective mechanism that may prevent malignant conversion of benign lesions (4). Interestingly, one study showed that ER stress promotes cellular senescence in human melanocytes, but a direct link with p-AKT signaling was not established (3). Peroxisome proliferator-activated receptor β/δ (PPARβ/δ) inhibits skin tumorigenesis through mechanisms that are dependent on oncogenic signaling (5–10). For example, PPARβ/δ inhibits skin tumorigenesis by inducing H-RAS-induced senescence in part by decreasing p-AKT activity (11). Because p-AKT activity can influence both ER stress and oncogene-induced senescence (3) and PPARβ/δ represses p-AKT activity (11), PPARβ/δ may modulate H-RAS-induced ER stress to promote senescence. The present studies were designed to examine the role of ER stress in oncogene-induced senescence using genetic and pharmacological models and also to test the hypothesis that PPARβ/δ may promote H-RAS-induced senescence by repressing ER stress.
EXPERIMENTAL PROCEDURES
Plasmids
Plasmids containing shRNAs against Atf4, Xbp1, or a non-target control shRNA were purchased from Mission shRNA (Sigma). The shRNA catalogue numbers are: mouse Atf4 shRNA (TRCN0000071727), mouse Xbp1 shRNA (TRCN0000008420), and non-target control shRNA (SHC002).
Cell Culture
Primary keratinocytes from newborn wild-type and Pparβ/δ-null mice were prepared and cultured as previously described (12). The HaCat cell line was cultured in DMEM medium as previously described (13). LY294002 (10 μm) was used to inhibit PI3K activity, and PD98059 (10 μm) was used to inhibit MEK activity because these concentrations specifically inhibit these enzymes (14). Rapamycin (3 nm) was used to inhibit mTOR activity because this concentration was shown to specifically inhibit mTOR activity (15). To induce ER stress, thapsigargin (2.5 nm) or tunicamycin (25 ng/ml) were used at these concentrations which can increase ER stress without inducing apoptosis in mouse primary keratinocytes (data not shown). An anti-BiP antibody (N-20, Santa Cruz Biotechnology, Santa Cruz, CA) was used at a concentration of 3 μg/ml to immunoneutralize cell-surface BiP as this concentration was previously shown to prevent ligand binding (16).
Virus Production and Keratinocyte Infection
The H-RAS retrovirus and lentivirus encoding shRNA against Atf4 and Xbp1 were generated as previously described (10).
Cell Viability Assay
An MTT (3-(4,5-dimethylthiazol-2-yl)-2,5-diphenyltetrazolium bromide) assay was performed as previously described (10).
siRNA Knockdown of PPARβ/δ in 308 Cells
The 308 keratinocyte cell line derived from dimethylbenz[a]anthracene-treated mouse skin that constitutively express active H-RAS (17, 18) were cultured as previously described (6) and treated with either control siRNA (D-001206-13-05) or PPARβ/δ siRNA (M-042751-01-0005; Thermo Scientific, Waltham, MA) using the manufacturer's protocol for 48 h. Western blot analysis was performed from whole cell lysates as described below.
Clonogenic Assay with ER Stress Inducers
Keratinocyte preparations from newborn mouse skin were placed into culture dishes for 1 h. After this “pre-attachment” period, the culture medium was removed and replated into new culture dishes. This approach minimizes the contamination of fibroblasts with primary keratinocytes. Primary keratinocytes were plated at high density and infected with the H-RAS retrovirus on day 2 of culture. For transient treatment, infected keratinocytes were treated with tunicamycin or thapsigargin for 4 days before culture in normal Eagle's minimal essential medium containing 0.05 mm calcium and 8% FBS (low calcium) or in Eagle's minimal essential medium containing 0.5 mm calcium medium and 8% FBS (high calcium) for 8 weeks. For prolonged treatment, infected keratinocytes were treated with tunicamycin or thapsigargin throughout the experiment. Colonies of keratinocytes were identified by staining the cells with 0.35% rhodamine, 10% formalin. Rhodamine-stained colonies were counted with a dissecting microscope.
Complete Carcinogenesis Bioassay
A complete carcinogenesis bioassay was performed as previously described (11).
Senescence-associated β-Galactosidase (β-Gal) Assay
β-Gal assays were performed as previously described (19).
Nude Mouse Grafting
For grafting experiments, H-RAS-infected keratinocytes were treated with vehicle control, tunicamycin, or thapsigargin for 4 days before culture in normal low calcium medium for another 5 days. Approximately 1.5 × 10⁶ keratinocytes were mixed with 3 × 10⁶ mouse dermal fibroblasts (cultured for 1 week) and grafted onto the back of nude mice on a prepared skin graft site as previously described (20).
Flow Cytometry Analysis
Cells were stained with bromodeoxyuridine (BrdU) and analyzed for cell cycle progression as previously described (21). Cell distribution of H-RAS expression was analyzed as previously described (10).
Immunofluorescence Analysis
Immunofluorescence was performed as previously described (10) with the following primary antibodies: anti-p16 (F-12), anti-GRP78 (N-20), anti-DcR2 (d-15), anti-XBP-1 (F-4) (which can recognize both spliced and unspliced XBP-1), anti-ATF4 (C-19) (Santa Cruz Biotechnology, Santa Cruz, CA), anti-p-AKT (S473) (#4058; Cell Signaling, Beverly, MA), or Alexa-555 conjugated anti-E-cadherin, (BD Biosciences Pharmingen, Life Technologies, Grand Island, NY). Staining of the ER with ER tracker Blue-White DPX was performed as previously described (3).
Protein Synthesis Assay
The Click-iT AHA Alexa Fluor 488 protein synthesis HCS kit (Invitrogen) was used to measure protein synthesis in vitro. Briefly, H-RAS-expressing keratinocytes cultured in chamber slides were treated with different chemicals for 3 days before being pulsed with 50 μm l-azidohomoalanine in methionine-free medium for 1 h. Cells were fixed with 2% formaldehyde and permeabilized by 0.5% Triton X-100 and then underwent a ligation reaction for 30 min in the dark. Representative photomicrographs were obtained with a light microscope (OLYMPUS BX61), and the mean intensity of Alexa-488 signal from at least 1000 cells was measured using Cell Profiler software (Broad Institute, Cambridge, MA).
Reactive Oxygen Species (ROS) Detection Assay
Image-iT live green reactive oxygen species detection kit (Invitrogen) was used to measure the level of ROS in H-RAS-expressing keratinocytes. Wild-type H-RAS-expressing keratinocytes were treated with thapsigargin or tunicamycin for 4 days. After treatment, cells were washed with Hank's balanced salt solution and incubated with 25 μm 5-(and-6)-carboxy-2′,7′-dichlorodihydrofluorescein diacetate for 30 min at 37 °C. Cells were washed three times with Hank's balanced salt solution before being subjected to imaging using a fluorescence microscope. The mean intensity of the fluorescent signal from at least 1000 cells was measured using Cell Profiler software (Broad Institute, Cambridge, MA).
Matrigel Assay
Basement membrane extract (Trevigen, Gaithersburg, MD) was diluted with low calcium medium at the final concentration of 1 mg/ml and plated on top of 8 μm pore size cell culture inserts (BD Biosciences). An equal number of H-RAS-expressing keratinocytes transiently treated with either thapsigargin, tunicamycin, or vehicle control were plated on top of the half-gelled basement membrane extract and cultured with low calcium medium for 24 h. After 24 h, cells migrating across the membrane were identified by staining the insert membrane with 0.35% rhodamine, 10% formalin.
RNA Isolation, Quantitative Real-time PCR and RT-PCR-based Detection of XBP1 Splicing
Total RNA was isolated using TRIzol reagent (Invitrogen), and reverse transcription and quantitative real-time PCR was performed as previously described (22). The relative level of mRNA was normalized to glyceraldehyde-3-phosphate dehydrogenase (Gapdh) or 18 S mRNA. For detection of spliced Xbp1 mRNA (162 bp) and unspliced Xbp1 mRNA (188 bp), the forward primer (5′-AAGAACACGCTTGGGAATGGACAC-3′) and reverse primer (5′-ACAGTGTCAGAGTCCATGGGAAGA-3′) were used.
Quantitative Western Blot Analysis
Western blot analysis using radioactive detection methods was performed as previously described (13). The primary antibodies used were: anti-pRB (Ser-780), anti-p-MEK1/2 (Ser-217/221), anti-MEK1/2, anti-p-ERK1/2 (Thr-202/Tyr-204), anti-ERK1/2, anti-p-AKT (Ser-473), anti-AKT, anti-p27, anti-BiP, anti-calnexin, anti-IRE1α, anti-phospho-PERK (Thr-980), anti-PERK, anti-phospho-S6RP (Ser-235/236), anti-S6RP, anti-phospho-p70 S6K (Thr-389), anti-PARP (Cell Signaling, Beverly, MA), anti-H-RAS, anti-RB, anti-p16, anti-p53, anti-p21, anti-DcR2, anti-XBP1 (M-186), anti-ATF4, anti-ATF6, anti-BAX, anti-PCNA (Santa Cruz Biotechnology, Santa Cruz, CA), anti-lactic dehydrogenase (Jackson ImmunoResearch, West Grove, PA), anti-β-actin (Rockland, Gilbertsville, PA), anti-BAD (New England Biolabs, Ipswich, MA), and anti-p70 S6K (BD Biosciences Pharmingen).
Human Adenoma Samples
Matched pairs of frozen normal colon tissue and colon adenomas were obtained from The Penn State Hershey Cancer Institute Tissue Bank.
Statistical Analysis
All data analysis was performed using GraphPad Prism Version 5.0 (GraphPad Software, La Jolla, CA). Statistical significance was assessed using one-tailed Student's t test or linear regression analysis.
RESULTS
PPARβ/δ Attenuates H-RAS-induced ER Stress
H-RAS expression caused morphologic changes in keratinocytes characterized by a temporal increase in vacuolization (Fig. 1A). However, vacuolization occurred earlier, and the percentage of vacuolized cells was higher in H-RAS-expressing Pparβ/δ-null keratinocytes as compared with wild-type keratinocytes (Fig. 1, A and B). Because vacuolization can be indicative of an expanded ER compartment, ER content was quantified. The mean density staining of the ER tracker DPX (staining relative to cell size) was lower in H-RAS-expressing wild-type cells compared with Pparβ/δ-null cells (Fig. 1C). Consistent with this observation, decreased expression of CALNEXIN (an ER-resident protein) was found in H-RAS-expressing wild-type compared with Pparβ/δ-null cells (Fig. 1D). The vacuolization and expansion of the ER compartment are consistent with previously observed H-RAS-induced ER stress previously observed in primary melanocytes (3).
FIGURE 1.

PPARβ/δ attenuates H-RAS-induced ER stress. Wild-type (+/+) or Pparβ/δ-null (−/−) keratinocytes were either mock- or H-RAS-infected. A, representative photomicrographs of vacuolized cells (black arrow) 5 days post H-RAS expression. B, quantification of vacuolized cells post H-RAS expression. C, representative photomicrographs and quantification of the intensity of the ER staining with ER-tracker Blue-White DPX. DIC, differential interference contrast. D, Western blot analysis of CALNEXIN, p-PERK, PERK, ATF6, BiP, and H-RAS 5 days post H-RAS expression. E, Western blot analysis of PPARβ/δ, H-RAS, ATF6, BiP, and ATF4 in 308 keratinocytes after knockdown of PPARβ/δ by siRNA. F, schematic representation of the three main pathways involved in mediating the UPR: (i) PERK/eIF2/ATF4, (ii) ATF6, and (iii) IRE1/XBP1. G, quantitative real-time PCR of Atf4 and BiP mRNA in mock-infected and H-RAS-expressing keratinocytes 5 days post H-RAS expression. H, heat map of mRNA expression of key ER stress and UPR markers in mock-infected (No H-RAS) or H-RAS-expressing (H-RAS) wild-type (+/+) or Pparβ/δ-null (−/−) keratinocytes. Relative expression level of protein was normalized to that of ACTIN and is shown as the relative -fold change as compared with control. Values represent the mean ± S.E. *, significantly different than (+/+) or siRNA control (p ≤ 0.05).
In response to ER stress, UPR is activated to attenuate the ER stress by activating the three branches of the UPR pathway: 1) PERK, 2) ATF6, and 3) IRE1 (1, 2) (Fig. 1F). Microarray analysis from a previously published study (10) revealed increased expression of key UPR regulators in both wild-type and Pparβ/δ-null cells in response to H-RAS activation, but the relative increase was markedly higher in Pparβ/δ-null cells compared with wild type (Fig. 1, G and H). Western blot analysis confirmed decreased expression of the UPR sensor BiP and ATF6 in H-RAS-expressing wild-type cells compared with Pparβ/δ-null cells (Fig. 1D). Furthermore, although phosphorylated PERK (pPERK) was not detected in H-RAS-expressing wild-type cells, pPERK was found in H-RAS-expressing Pparβ/δ-null cells (Fig. 1D), an effect not due to a difference in H-RAS expression, which was expressed at similar levels in both cell types (Fig. 1D). Knockdown of PPARβ/δ in 308 keratinocytes, a cell line that expresses a constitutively active H-RAS, revealed similar results (Fig. 1E). Higher expression of ATF4, ATF6, and BiP were observed in 308 keratinocytes when PPARβ/δ was knocked down as compared with controls (Fig. 1E). These data indicate that PPARβ/δ attenuates two of the three branches of the UPR pathway activated by ER stress (Fig. 1F). Alternative splicing of Xbp1 mRNA was examined as an indirect measure of the third branch of the UPR pathway, IRE1 activity (Fig. 1F). Reduced splicing of Xbp1 mRNA was observed in H-RAS-expressing wild type compared with Pparβ/δ-null cells (Fig. 2A), suggesting that PPARβ/δ also attenuates the IRE1-XBP1 branch of the UPR response in H-RAS-expressing wild-type cells.
FIGURE 2.

PPARβ/δ represses H-RAS-induced ER stress without triggering apoptosis. Wild-type (+/+) or Pparβ/δ-null (−/−) keratinocytes were either mock or H-RAS-infected. A, semi-quantitative RT-PCR of the spliced (s) and unspliced (us) forms of Xbp1 mRNA at different days post H-RAS expression. The ratio of the spliced to unspliced form of Xbp1 was calculated. B, H-RAS-expressing (+/+) or (−/−) keratinocytes were cultured in medium with increasing concentration of tunicamycin (Tu) for 3 days. Relative cell viability was normalized to that of respective vehicle control. C, Western blot analysis of BAD and BAX 5 days post H-RAS expression. D, quantification of propidium iodide (PI)-positive apoptotic cells by flow cytometric analysis 5 days post H-RAS expression. E, Western blot analysis of PPARβ/δ, p-AKT, AKT, ATF4, ATF6, IRE1α, and PERK in control Migr1 and Migr1-hPPARβ/δ HaCat cell line. Overexpression of PPARβ/δ represses p-AKT expression, concomitant with decreased expression of ER stress and UPR markers including ATF4, ATF6, IRE1α, and PERK. Relative expression level of protein was normalized to that of actin and is shown as the relative -fold change as compared with control. Values represent the mean ± S.E. *, significantly different than (+/+) or Migr1 controls (p ≤ 0.05).
H-RAS-expressing wild-type cells were also less sensitive to tunicamycin (an ER stress inducer)-induced cell death as compared with Pparβ/δ-null cells (Fig. 2B), consistent with the reduced ER stress observed in H-RAS-expressing wild-type cells (Fig. 1, A–C). Although the UPR initially promotes cell survival, in the presence of prolonged ER stress it can also activate pathways leading to apoptosis (1, 2). Western blot analysis showed similar expression of pro-apoptotic BAD and BAX protein in H-RAS-expressing wild-type and Pparβ/δ-null cells (Fig. 2C), consistent with propidium iodide staining revealing no change in the percentage of apoptotic cells in H-RAS-expressing wild-type and Pparβ/δ-null cells (Fig. 2D). Additionally, overexpression of PPARβ/δ in human HaCaT keratinocytes decreased expression of the UPR markers ATF4, ATF6, and IRE1α (Fig. 2E). These data suggest that PPARβ/δ represses H-RAS-induced ER stress without triggering apoptosis.
H-RAS Promotes ER Stress through p-AKT/mTOR Signaling
p-AKT activity can influence ER stress (3). This is consistent with relatively lower H-RAS-induced ER stress and lower p-AKT in H-RAS-expressing wild-type keratinocytes compared with H-RAS-expressing Pparβ/δ-null cells (11). Similarly, this is consistent with relatively higher H-RAS-induced ER stress and higher p-AKT in H-RAS-expressing Pparβ/δ-null keratinocytes compared with H-RAS-expressing wild-type keratinocytes (11). These collective observations support the hypothesis that p-AKT (which is activated by PI3K) promotes ER stress in H-RAS-expressing cells. Inhibition of PI3K activity with LY294002 significantly decreased the percentage of vacuolized H-RAS-expressing cells in both genotypes (Fig. 3, A and B). In addition, inhibition of PI3K with LY294002 decreased p-AKT and decreased expression of the ER stress and UPR mediators ATF6 and BiP in H-RAS-expressing cells (Fig. 3C). These data indicate that p-AKT activity promotes H-RAS-induced ER stress.
FIGURE 3.

PPARβ/δ represses H-RAS-induced ER stress by repressing p-AKT signaling. H-RAS-expressing wild-type (+/+) or Pparβ/δ-null (−/−) keratinocytes were treated with LY294002 (LY) or vehicle control (C). A, representative photomicrographs of vacuolized cells 5 days post H-RAS expression. B, quantification of the percentage of vacuolized cells 5 days post H-RAS expression. C, Western blot analysis of p-AKT, AKT, and the ER stress markers ATF6 and BiP 5 days post H-RAS expression. Relative expression level of protein was normalized to that of actin and is shown as the relative -fold change as compared with control. Values represent the mean ± S.E.
Mammalian target of rapamycin (mTOR) is a protein complex that could potentially mediate p-AKT-induced ER stress because 1) mTOR is a target of p-AKT (23) and 2) increased mTOR activity can cause increased protein synthesis (24), which could overload the ER, leading to ER stress. Inhibition of PI3K with LY294002 significantly decreased expression of the mTOR target genes phospho-p70S6K (p-p70S6K) and phospho-S6RP (p-S6RP) in H-RAS-expressing cells (Fig. 4A). This suggests that mTOR is indeed a target of p-AKT in H-RAS-expressing keratinocytes.
FIGURE 4.

H-RAS promotes ER stress through p-AKT/mTOR signaling. H-RAS-expressing wild-type (+/+) or Pparβ/δ-null (−/−) keratinocytes were treated with LY294002 (LY), rapamycin (Rapa), or vehicle control (C). A, Western blot analysis of p-AKT, AKT, and the mTOR targets p-p70 S6K, p70 S6K, p-S6RP, and S6RP 5 days post H-RAS expression. B, representative photomicrographs of cells labeled with Alexa 488-conjugated methionine to quantify protein synthesis in H-RAS-expressing (+/+) or (−/−) keratinocytes treated with rapamycin, LY294002, or vehicle control for 3 days. C, quantification of the protein synthesis rate 5 days post H-RAS expression in response to rapamycin and LY294002. D, representative photomicrographs of H-RAS-expressing (+/+) or (−/−) keratinocytes treated with rapamycin or vehicle control for 3 days. E, quantification of the percentage of vacuolized cells 5 days post H-RAS expression in response to rapamycin. F, Western blot analysis of p-AKT, AKT, IRE1α, BiP, p-p70 S6K, p70 S6K, p-S6RP, S6RP, and H-RAS 5 days post H-RAS expression in response to rapamycin. Relative expression level of protein was normalized to that of ACTIN and is shown as the relative -fold change as compared with control. Values represent the mean ± S.E. ND, not detected.
Consistent with a higher activity of mTOR in H-RAS-expressing Pparβ/δ-null cells (Fig. 4A), H-RAS-expressing Pparβ/δ-null cells also exhibited an ∼4-fold higher protein synthesis rate compared with wild-type counterparts (Fig. 4C). Inhibition of PI3K and mTOR with LY294002 and rapamycin, respectively, reduced the rate of protein synthesis to a level similar to that of H-RAS-expressing wild-type cells. (Fig. 4, B and C) Although only an ∼2-fold decrease was observed in H-RAS-expressing wild-type cells as compared with Pparβ/δ-null cell (Fig. 4, B and C). Inhibition of mTOR with rapamycin also decreased the percentage of vacuolized cells and expression of ER stress and UPR markers IRE1α and BiP in H-RAS-expressing cells (Fig. 4, D–F), and the magnitude of these changes were greater in H-RAS-expressing Pparβ/δ-null cells. These data collectively suggest that p-AKT activity increases H-RAS-induced ER stress by activating mTOR signaling leading to increased protein synthesis. Furthermore, these data also indicate that PPARβ/δ represses ER stress by attenuating p-AKT/mTOR signaling.
Decreasing ER Stress-associated UPR Increases H-RAS-induced Senescence
PPARβ/δ promotes H-RAS-induced cellular senescence (11). The relatively lower level of ER stress observed in H-RAS-expressing wild-type keratinocytes in the present study correlates with relatively higher levels of senescence previously observed (11). Conversely, the relatively higher level of ER stress observed in H-RAS-expressing Pparβ/δ-null keratinocytes in the present study correlates with relatively lower levels of senescence previously observed (11). Thus, H-RAS-expressing wild-type cells were used as a model of modest ER stress/high senescence, and the H-RAS-expressing Pparβ/δ-null cells were used as a model of relatively high ER stress/low senescence.
Examination of H-RAS-expressing keratinocytes revealed a negative correlation between vacuolization (a marker of ER stress) and β-gal-positive staining (a marker of senescence) in both models (Fig. 5, A and B). Furthermore, rapidly proliferating H-RAS-expressing Pparβ/δ-null cells that are resistant to calcium-induced cell cycle arrest as described previously (11) exhibited massive vacuolization (Fig. 5C). H-RAS-expressing keratinocytes resistant to calcium-induced differentiation are considered to have undergone malignant conversion (25) and were examined to demonstrate grossly exacerbated ER stress due to the absence of PPARβ/δ in a model of rapidly proliferating cells that are resistant to senescence (11). These observations support the hypothesis that ER stress and the UPR attenuate H-RAS-induced cellular senescence. To test this hypothesis, two of the three main UPR pathways (PERK and IRE1; Fig. 1E) were selectively inhibited by shRNA in H-RAS-expressing keratinocytes. Knockdown of ATF4 or XBP1 increased the number of senescent cells in both H-RAS-expressing wild-type and Pparβ/δ-null keratinocytes (Fig. 6, A and B). Expression of the senescence marker p27 was also increased after ATF4 or XBP1 knockdown in both H-RAS-expressing wild-type and Pparβ/δ-null cells (Fig. 6, C and D). Expression of p-AKT and the direct ATF4/XBP1 target gene (1) BiP were decreased after either ATF4 or XBP1 knockdown in both H-RAS-expressing wild-type and Pparβ/δ-null cells (Fig. 6, C and D). In contrast, no change of p-ERK expression was observed after either ATF4 or XBP-1 knockdown in either H-RAS-expressing wild-type or Pparβ/δ-null cells (data not shown). Furthermore, knockdown of either ATF4 or XBP1 by shRNA partially restored cellular senescence in 3 of 6 previously described, calcium-resistant (i.e. malignant) H-RAS-expressing Pparβ/δ-null clones (11) (Fig. 6E). These data suggest that ER stress and UPR attenuate H-RAS-induced senescence.
FIGURE 5.

Decreasing ER stress-associated UPR increases H-RAS-induced senescence. Wild-type (+/+) or Pparβ/δ-null (−/−) keratinocytes were H-RAS-infected. A, representative photomicrographs showing a negative correlation between the extent of vacuolization and senescence. Cells in red boxes are β-gal-positive and show no signs of vacuolization. In contrast, cells in black boxes are β-gal negative and are vacuolated. B, quantification of the cells that exhibit β-gal staining and/or vacuolization. The p value is calculated from a χ2 test and showed a statistically significant enrichment of the proportion of β-gal-positive/vacuolization-negative cells in both genotypes. C, representative photomicrograph of a calcium-resistant colony from H-RAS-expressing Pparβ/δ-null (−/−) cells. The arrow indicates a vacuolated cell. Wild-type (+/+) or Pparβ/δ-null (−/−) keratinocytes were H-RAS-infected.
FIGURE 6.

ER stress and UPR attenuate H-RAS-induced senescence. Wild-type (+/+) or Pparβ/δ-null (−/−) keratinocytes were H-RAS-infected. A, representative photomicrographs (left panels) and quantification of the percentage of β-gal-positive senescent cells (right panel) after ATF4 knockdown. B, representative photomicrographs (left panels) and quantification of the percentage of β-gal positive senescent cells (right panel) after XBP1 knockdown. C, Western blot analysis of ATF4, BiP, p-AKT, AKT, p27, and H-RAS after ATF4 knockdown 12 days post H-RAS expression. D, Western blot analysis of XBP1, BiP, p-AKT, AKT, p27, and H-RAS after XBP1 knockdown 12 days post H-RAS expression. E, representative photomicrographs (left panels) and quantification (right panel) of the percentage of β-gal positive cells after ATF4 or XBP1 knockdown in three isolated calcium-resistant H-RAS-expressing (−/−) clones. Relative expression level of protein was normalized to that of ACTIN and is shown as the relative -fold change as compared with control. Values represent the mean ± S.E. *, significantly different than (+/+) control (p ≤ 0.05). #, significantly different than (−/−) control (p ≤ 0.05).
Increased ER Stress and UPR Decreases H-RAS-induced Senescence
Two common ER stress inducers, thapsigargin and tunicamycin (26), were used to further explore the relationship between UPR and senescence. Low concentrations of both chemicals were used to avoid extensive ER stress-induced cell death observed at higher concentrations. Treating both H-RAS-expressing wild-type and Pparβ/δ-null keratinocytes with increasing concentrations of both reagents caused a dose-dependent increase of vacuolized cells (data not shown) and a decreased number of senescent cells (Fig. 7, A and B). Because more marked effects were found in H-RAS-expressing wild-type cells due to lower basal ER stress compared with Pparβ/δ-null cells (Fig. 1), only wild-type H-RAS-expressing cells were used in the following studies. Thapsigargin or tunicamycin treatment caused an increase in BrdU-positive cells (Fig. 7C) and increased expression of PCNA (Fig. 8, A and B) compared with controls, which is indicative of higher cell proliferation and consistent with reduced senescence. In addition, increased expression of UPR markers IRE1α, BiP, and PERK and decreased expression of the senescence markers p16 and DcR2 were observed in H-RAS-expressing cells treated with thapsigargin (Fig. 8A). Tunicamycin caused similar changes in the expression of UPR and senescence markers compared with controls (Fig. 8B). Combined, these data suggest that low concentrations of thapsigargin and tunicamycin are sufficient to induce ER stress and UPR, causing attenuation of H-RAS-induced senescence and increased cell proliferation.
FIGURE 7.

Increasing ER stress decreases H-RAS-induced senescence. H-RAS-expressing wild-type (+/+) or Pparβ/δ-null (−/−) keratinocytes were treated with thapsigargin (Th), tunicamycin (Tu), LY294002 (LY), or vehicle control. Representative photomicrographs (upper panels) and quantification of the percentage of β-gal-positive senescent cells (lower panels) in response to thapsigargin (A) or tunicamycin treatment (B). C, quantification of the percentage of BrdU-positive cells 11 days post H-RAS expression in response to thapsigargin, tunicamycin, or tunicamycin and LY294002 (Tu+LY). Values represent the mean ± S.E. *, significantly different than (+/+) control (p ≤ 0.05). #, significantly different than (−/−) control (p ≤ 0.05).
FIGURE 8.
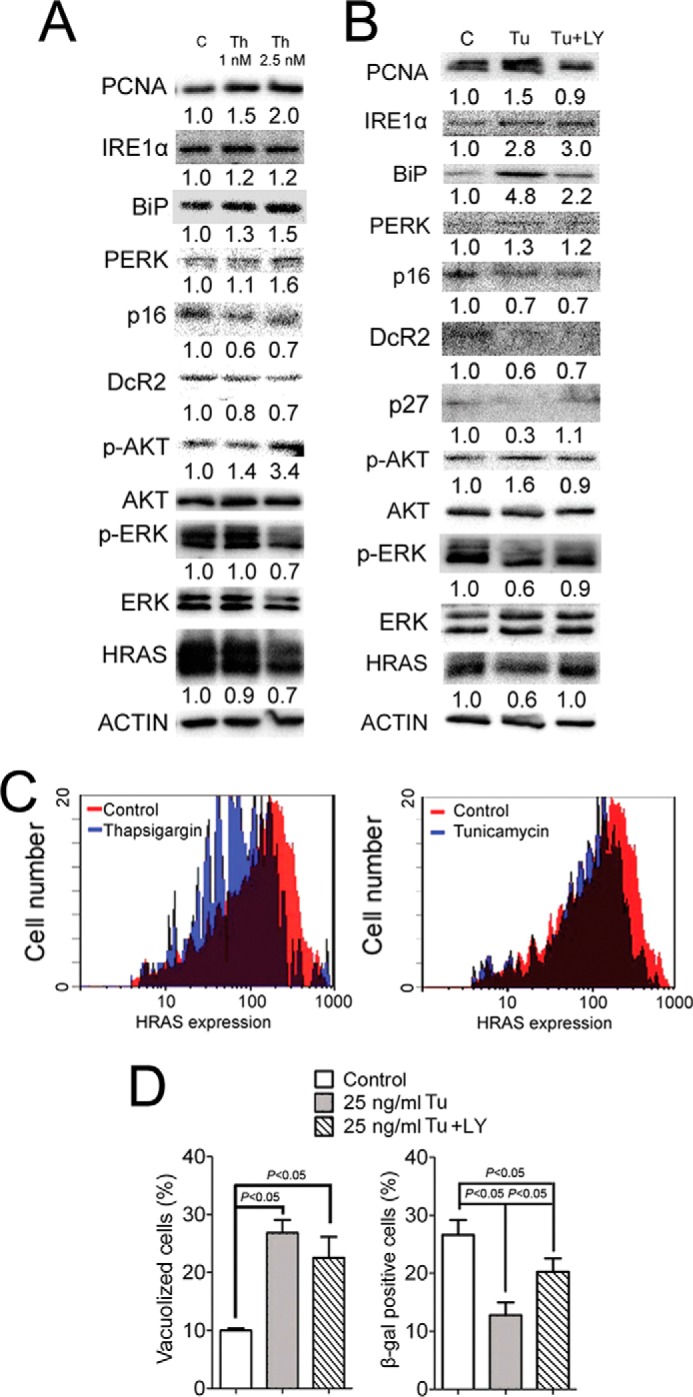
Increasing ER stress and UPR decreases H-RAS-induced senescence by increasing p-AKT. H-RAS-expressing wild-type (+/+) or Pparβ/δ-null (−/−) keratinocytes were treated with thapsigargin (Th), tunicamycin (Tu), LY294002 (LY) or vehicle control. A, Western blot analysis of IRE1α, BiP, PERK, p-AKT, AKT, p-ERK, ERK, p16, DcR2, PCNA, and H-RAS 11 days post H-RAS expression in response to 1.0 or 2.5 nm Th treatment. B, Western blot analysis of IRE1α, BiP, PERK, p-AKT, AKT, p-ERK, ERK, p16, DcR2, p27, PCNA, and H-RAS 11 days post H-RAS expression in response to tunicamycin or co-treatment with tunicamycin and LY294002. C, histogram showing distribution of H-RAS expression by flow cytometric analysis of H-RAS-expressing keratinocytes treated with thapsigargin, tunicamycin, or vehicle control for 4 days. D, quantification of the percentage of vacuolized and β-gal-positive cells 11 days post H-RAS expression in response to tunicamycin or co-treatment with tunicamycin and LY294002. Values represent the mean ± S.E. Relative expression level of protein was normalized to that of actin and is shown as the relative -fold change as compared with control.
Increased ER Stress and UPR Decreases H-RAS-induced Senescence by Increasing p-AKT
To examine the signaling pathways by which ER stress inhibits senescence and increases cell proliferation, downstream signaling pathways modulated by H-RAS, including p-AKT and p-ERK, were examined after thapsigargin and tunicamycin treatment. Interestingly, both ER stress inducers caused an increase in p-AKT in H-RAS-expressing keratinocytes (Fig. 8, A and B). In contrast, expression of H-RAS and p-ERK was modestly decreased after either thapsigargin or tunicamycin treatment (Fig. 8, A and B). The fact that increased ER stress caused both an increase of p-AKT and a decrease of p-ERK is important to note because a previous study suggested that both attenuation of p-ERK and potentiation of p-AKT are required to evade H-RAS-induced senescence (11). Flow cytometric analysis revealed that the modestly decreased expression of H-RAS by thapsigargin and tunicamycin was most likely due to a selection against higher H-RAS-expressing cells (Fig. 8C), similar to that previously observed by ligand activation of PPARβ/δ (10), although more extensive studies are needed to confirm this idea. This could explain the decreased expression of H-RAS and p-ERK in response to an increase in ER stress induced by either thapsigargin or tunicamycin. However, this selection does not explain how either thapsigargin or tunicamycin caused an increase in p-AKT.
To determine if ER stress increases cell proliferation and attenuates senescence through a p-AKT-dependent mechanism, H-RAS-expressing cells were co-treated with LY294002 and tunicamycin. Inhibition of PI3K activity with LY294002 prevented a tunicamycin-induced increase in BrdU labeling and PCNA expression (Figs. 7C and 8B) and partially abolished tunicamycin-induced repression of senescence (Fig. 8D). Moreover, co-treatment with LY294002 and tunicamycin restored expression of the senescence marker p27 but not p16 and DcR2 in H-RAS-expressing cells (Fig. 8B). These effects were not due to decreased ER stress (Fig. 8D). These findings suggest that although increased ER stress and a UPR increase cell proliferation through a p-AKT dependent mechanism, it partially attenuates senescence through a p-AKT dependent mechanism.
ER Stress-induced UPR Maintains Higher p-AKT Levels Partially through a Cell-surface BiP-dependent Mechanism
The mechanisms of how ER-stress-induced UPR maintains higher p-AKT were examined next. The ER stress marker BiP was of particular interest because 1) expression of BiP correlated with that of p-AKT whether UPR was decreased (Fig. 6, C and D) or increased (Fig. 8, A and B), and 2) in addition to its role as an ER chaperone, BiP was also found on the cell surface of cancer cells and when coupled with other cell-surface protein partners can activate the PI3K-AKT pathway (27, 28). To confirm that BiP is expressed on the cell surface in H-RAS-expressing keratinocytes, immunofluorescent studies were performed with antibodies against both BiP and E-cadherin (a cell-surface marker). Co-localization of E-cadherin and BiP would suggest that BiP is indeed expressed on the cell surface in H-RAS-expressing keratinocytes. Although expression of BiP was lacking on cell membranes in control keratinocytes (Fig. 9A), expression of BiP and E-cadherin on the cell-surface was detected in H-RAS-expressing keratinocytes (Fig. 9A). Neutralizing cell-surface BiP with an anti-BiP antibody (16) decreased expression of p-AKT and significantly decreased cell proliferation concomitant with decreased expression of p-RB expression in H-RAS-expressing cells (Fig. 9, B and C). However, no change in senescence was found after immunoneutralization of cell-surface BiP (Fig. 9D). Similarly, inducing ER stress with tunicamycin increased cell proliferation and immunoneutralizing cell-surface BiP repressed this effect (Fig. 9E) as well as tunicamycin-induced increased p-AKT and p-RB expression in H-RAS-expressing cells (Fig. 9F). In addition, immunoneutralizing cell-surface BiP had no effect on decreased senescence caused by tunicamycin treatment (Fig. 9G). That inhibition of cell proliferation by immunoneutralizing cell-surface BiP was more marked in tunicamycin-treated H-RAS-expressing keratinocytes (Fig. 9E) as compared with control H-RAS-expressing keratinocytes (Fig. 9B) suggests the effects of cell-surface BiP neutralization on cell proliferation are stronger when cell proliferation is more enhanced. More importantly, these data also indicate that cell-surface BiP can maintain high p-AKT in response to increased ER stress and promote cell proliferation but do not completely account for the attenuation of senescence caused by ER stress.
FIGURE 9.
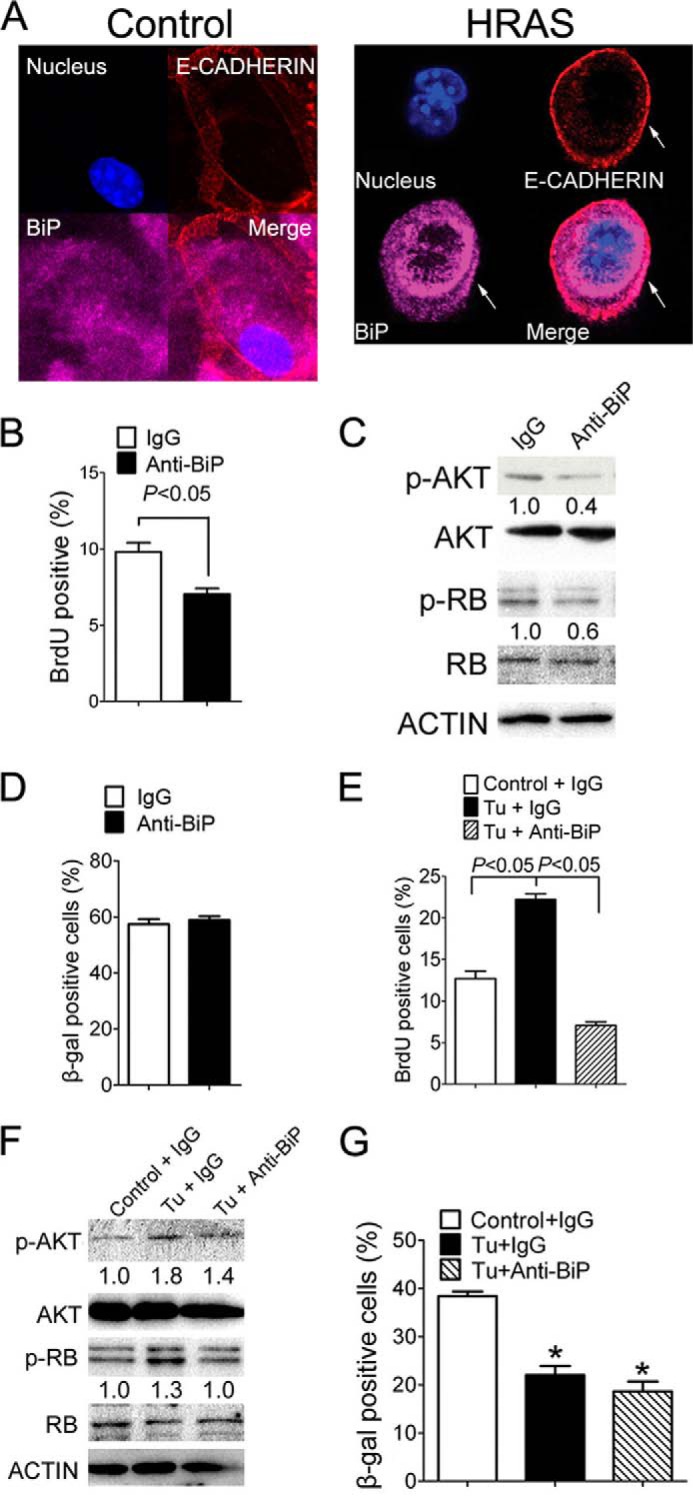
ER stress-induced UPR maintains higher p-AKT level partially through a cell-surface BiP-dependent mechanism. H-RAS-expressing keratinocytes were treated with an anti-BiP antibody or control IgG for 8 days, with (E-G) or without co-treatment with the ER stress inducer tunicamycin (B–D). A, immunofluorescence of E-CADHERIN and BiP in control (left panel) and H-RAS-expressing keratinocytes (right panel). The arrow indicates expression of cell-surface BiP in H-RAS-expressing keratinocytes. B, quantification of the percentage of BrdU-positive cells. C, Western blot analysis of p-AKT, AKT, p-RB, and RB. D, quantification of the percentage of β-gal-positive cells. H-RAS-expressing keratinocytes were treated with tunicamycin and control IgG (Tu+IgG), tunicamycin and an anti-BiP antibody (Tu+anti-BiP) or vehicle control, and control IgG (Control+IgG). E, quantification of the percentage of BrdU-positive cells after treatment with tunicamycin. F, Western blot analysis of p-AKT, AKT, p-RB, and RB after treatment with tunicamycin. Relative expression level of protein was normalized to that of ACTIN and is shown as the relative -fold change as compared with control. G, quantification of the percentage of β-gal-positive cells after treatment with tunicamycin. Values represent the mean ± S.E. *, significantly different than control (p ≤ 0.05).
A Transient Increase of ER Stress Is Sufficient to Cause Evasion of Senescence and Malignant Conversion in Vitro
Enhanced p-AKT activity increases ER stress (Fig. 3), and ER stress-associated UPR in turn increases p-AKT expression (Fig. 8). This suggests the presence of a positive feed forward loop between p-AKT, ER stress, and UPR. If so, then transient stimulation of ER stress should be sufficient to establish the positive feed forward loop and maintain higher UPR and higher p-AKT activity, leading to evasion of senescence even after the initial stimuli is removed. To test this hypothesis, H-RAS-expressing keratinocytes were treated briefly with either thapsigargin or tunicamycin briefly, and senescence measured 8 days after treatment. Transient treatment with both thapsigargin and tunicamycin caused a decrease of senescence (Fig. 10A), concomitant with decreased expression of senescence marker p16, p27, and p21 in H-RAS-expressing keratinocytes compared with controls (Fig. 10B). In addition, increased expression of ER stress markers IRE1α, BiP, and p-AKT and decreased expression of p-ERK were observed at this time in H-RAS-expressing keratinocytes after transient induction of ER stress by both thapsigargin and tunicamycin (Fig. 10B).
FIGURE 10.

A transient increase of ER stress is sufficient to cause evasion of senescence and malignant conversion in vitro. H-RAS-expressing keratinocytes were transiently treated with thapsigargin (Th), tunicamycin (Tu), or vehicle control (C) for 4 days before cultured in normal medium for another 6 days. A, quantification of the percentage of β-gal-positive senescent cells in response to thapsigargin or tunicamycin treatment. B, Western blot analysis of IRE1α, BiP, p-AKT, AKT, p-ERK, ERK, p16, p27, p21, and H-RAS in response to thapsigargin or tunicamycin treatment. Representative photomicrographs (upper panels) and quantification of the number of colonies in a clonogenic assay (lower panels) of H-RAS-expressing keratinocytes cultured in low calcium (C) or high calcium medium (D) in response to transient or long term (LT) thapsigargin treatment. E, representative photomicrographs (upper panels) of the number of cells migrating across the basement membrane (indicated by arrows) and quantification of the number of cells migrating across the basement membrane (lower panel) in a Matrigel assay. The number of cells migrating in each group was normalized to the average number of cells migrating in the control group and is shown as the relative -fold change as compared with control. F, quantification of the level of reactive oxygen species of H-RAS-expressing keratinocytes treated with thapsigargin, tunicamycin, or vehicle control for 4 days. Relative expression level of protein was normalized to that of actin and is shown as the relative -fold change as compared with control. Values represent the mean ± S.E. *, significantly different than control (p ≤ 0.05).
Because decreased senescence is often associated with an increase in the extent of cancer malignancies (4), the effects of increased ER stress on malignant conversion of H-RAS-expressing keratinocytes were examined by clonogenic and Matrigel assays in vitro. After the introduction of oncogenic H-RAS, no colonies were observed after 4 weeks of culture in either low calcium or high calcium medium (Fig. 10, C and D), consistent with previous findings (11). In contrast, transiently treating H-RAS-expressing cells with thapsigargin resulted in the formation of colonies in both low calcium and high calcium medium (Fig. 10, C and D). Interestingly, prolonged treatment with thapsigargin resulted in no colonies cultured in low calcium and fewer colonies in high calcium medium compared with the transient treatment strategy (Fig. 10, C and D). Even though a number of colonies were initially observed at the early times of thapsigargin treatment, they eventually sloughed off (Fig. 10, C and D, data not shown). Additionally, transient treatment of H-RAS-expressing cells with either thapsigargin or tunicamycin increased the average number of cells migrating across a basal membrane in a Matrigel assay (Fig. 10E). ER stress can increase ROS levels (29) and thereby potentially increase the chance of secondary mutations, which may lead to escaping from senescence. To examine this possibility, the level of ROS was measured in H-RAS-expressing keratinocytes after thapsigargin or tunicamycin treatment. No change in ROS levels was found between groups (Fig. 10F). These data collectively suggest that a transient increase of ER stress is sufficient to cause evasion of senescence and malignant conversion in vitro.
ER Stress Attenuates Senescence and Promotes Tumorigenesis in Mouse Skin Tumors in Vivo
Having established that the increase of ER stress can cause evasion of senescence and malignant conversion in vitro, skin tumors from a dimethylbenz[a] anthracene-induced model from a previously published study (11) were used to confirm these effects in vivo. We utilized this model because 1) dimethylbenz[a]anthracene-induced benign skin tumors exhibit extensive cellular senescence (30), thus providing a valuable in vivo model to investigate the potential relationship between ER stress and cellular senescence, and 2) it was previously shown that PPARβ/δ promotes H-RAS-induced senescence in dimethylbenz[a]anthracene-induced skin tumors and that skin tumors from Pparβ/δ-null mice exhibited increased cell proliferation and decreased cellular senescence in vivo (11). Skin tumors examined from this bioassay revealed that p-AKT expression positively correlated with that of ATF4 in both wild-type and Pparβ/δ-null mouse skin tumors (Fig. 11A). Lower nuclear ATF4 expression was also found in skin tumors from wild type as compared with Pparβ/δ-null mice (Fig. 11A). This is consistent with decreased p-AKT expression in skin tumors from wild-type mice as compared with Pparβ/δ-null mice (11). XBP-1 and DcR2 were chosen as ER stress and senescence markers, respectively, to examine the relationship between ER stress and senescence in vivo. During increased ER stress, Xbp-1 mRNA is alternatively spliced, resulting in nuclear translocation of active XBP-1 (29, 31). Thus, an increased ratio of nuclear to cytoplasmic XBP-1 indicates increased ER stress (29, 31). DcR2 is a senescence marker highly expressed in senescent skin papillomas but not in normal skin (30). An increased nuclear to cytoplasmic ratio of XBP-1 was found in skin tumors compared with normal skin in both wild-type and Pparβ/δ-null mice, consistent with increased ER stress commonly observed in tumors. In addition, this ratio was significantly lower in wild-type tumors compared with Pparβ/δ-null tumors, suggesting that PPARβ/δ also inhibits ER stress in vivo (Fig. 11, B and C). In addition, higher p-AKT expression positively correlated with increased XBP-1 expression in non-senescent regions (Fig. 11D). In contrast, senescent regions that expressed DcR2 (and also positive for β-Gal) expressed lower p-AKT and, more importantly, showed increased cytoplasmic XBP-1 distribution (Fig. 12, A–C). These effects were observed in skin tumors from both wild-type and Pparβ/δ-null mice although a more striking correlation was observed in Pparβ/δ-null mice (Fig. 12, A–C). A positive correlation between the expression of p-AKT and BiP in mouse skin tumors and a negative correlation between the expression of p16 and both BiP and ATF4 in mouse skin tumors were also confirmed by quantitative Western blot analysis (data not shown). These findings suggest a new pro-tumorigenic function of ER stress in attenuating senescence in vivo. To further test the hypothesis that increased ER stress can help bypass the senescence checkpoint and facilitate H-RAS-induced tumorigenesis of primary keratinocytes in vivo, 1.5 million H-RAS-expressing keratinocytes that were pretreated with vehicle control, tunicamycin, or thapsigargin were mixed with 3 million dermal fibroblasts and grafted onto the back of athymic nude mice. Interestingly, although no tumors were found in mice grafted with vehicle-treated H-RAS-expressing keratinocytes, 66 and 50% of mice grafted with the same number of H-RAS-expressing keratinocytes that were pretreated with tunicamycin and thapsigargin, respectively, developed skin tumors (Fig. 13, A and B). In addition, although mice grafted with vehicle-treated H-RAS-expressing keratinocytes only showed signs of mild hyperplasia (Fig. 13C), mice grafted with H-RAS-expressing keratinocytes that were pretreated with tunicamycin or thapsigargin developed both benign papillomas and malignant squamous cell carcinomas (Fig. 13C). This evidence implies that increased ER stress greatly facilitates H-RAS-induced tumorigenesis of primary keratinocytes in vivo.
FIGURE 11.

PPARβ/δ represses ER stress in mouse skin tumors in vivo. Skin tumors from wild-type (+/+) or Pparβ/δ-null (−/−) mice were obtained from a complete carcinogen bioassay. A, upper left two panels show representative photomicrographs of immunofluorescent analysis of p-AKT (Ser-473) and ATF4 in skin tumors. The upper right two panels show linear regression of the mean intensity of p-AKT and that of the mean intensity of ATF4 in (+/+) and (−/−) skin tumors. The lower right panel shows the cumulative frequency of the mean intensity of nuclear ATF4 from at least 1000 cells in (+/+) and (−/−) skin tumors shown in the upper two panels. B, representative photomicrographs of immunofluorescent analysis of p-AKT (Ser-473), XBP1, and DcR2 in mouse skin and skin tumors. C, quantification of the nuclear to cytoplasmic ratio of XBP1 expression in skin and skin tumors. D, linear regression of the mean intensity of p-AKT and that of total XBP1 in (+/+) and (−/−) skin tumors shown in Figs. 11B and 12C. Values represent the mean ± S.E.
FIGURE 12.

ER stress attenuates senescence and promotes tumorigenesis in mouse skin tumors in vivo. Skin tumors from wild-type (+/+) or Pparβ/δ-null (−/−) mice were obtained from a complete carcinogen bioassay. A, quantification of the nuclear to cytoplasmic ratio of XBP1 expression in skin tumor regions exhibiting senescence (β-gal/DcR2 positive) or proliferation (p-AKT positive and β-gal/DcR2 negative). B, representative photomicrographs of β-gal staining and immunofluorescent analysis of p-AKT (Ser-473), XBP1, and DcR2 in a skin tumor from a (−/−) mouse. The tumor shown in the upper panel was examined more closely to identify regions with relative differences in p-AKT immunofluorescence. Magnified regions exhibiting relatively lower expression of p-AKT (red outlined box) or relatively higher p-AKT (gray outlined box) were examined more closely. The white arrows in the red outlined box show cells with lower p-AKT, higher DcR2, and lower nuclear XBP1 staining. The yellow arrows in the gray outlined box show cells with higher p-AKT, lower DcR2, and higher nuclear XBP1 staining. C, representative photomicrographs of β-gal staining and immunofluorescent analysis of p-AKT (Ser-473), XBP1, and DcR2 in skin tumors from (+/+) mice. The tumor shown in the upper left panel was examined more closely to identify a region with relative differences in p-AKT immunofluorescence. A magnified region exhibiting both relatively high and relatively low expression of p-AKT (red box) was examined more closely. The white arrows show cells with lower p-AKT, higher DcR2, and lower nuclear XBP1 staining. The yellow arrows show cells with higher p-AKT, lower DcR2, and higher nuclear XBP1 staining. Values represent the mean ± S.E.
FIGURE 13.
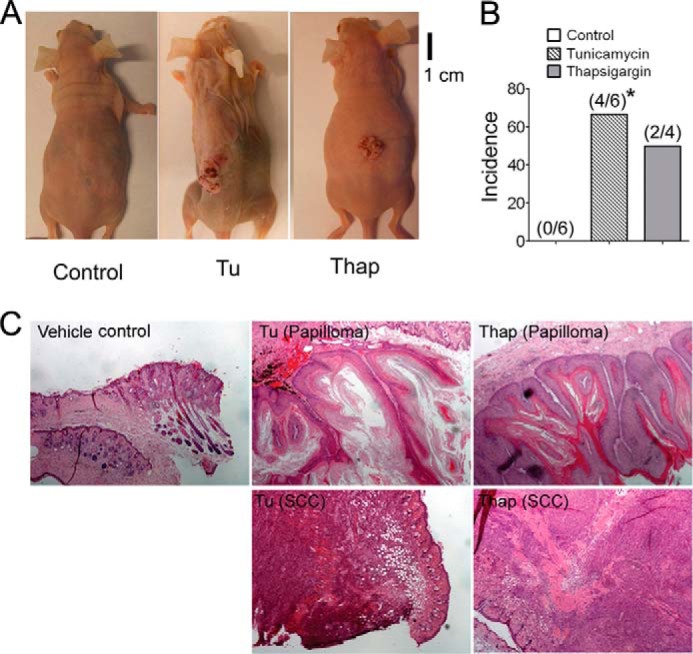
Transiently increased ER stress facilitates H-RAS-induced tumorigenesis of primary keratinocytes in an allograft model. Athymic nude mice were grafted with a mixture of dermal fibroblasts and H-RAS-expressing keratinocytes transiently treated with thapsigargin (Thap), tunicamycin (Tu), or vehicle control (C). A, representative photographs of skin tumors resulting from these treatments. B, the percentage of mice that developed skin tumors from grafted mixtures of dermal fibroblasts and H-RAS-expressing keratinocytes transiently treated with thapsigargin or tunicamycin. C, H&E staining of representative skin and tumors isolated from mice grafted with a mixture of vehicle control dermal fibroblasts and H-RAS-expressing keratinocytes or those transiently treated with tunicamycin or thapsigargin. SCC, squamous cell carcinoma. *, significantly different than control, p ≤ 0.05.
ER Stress Is Negatively Correlated with Cellular Senescence in Human Benign Lesions
The relationship between cellular senescence and ER stress was also examined in human colon adenomas using analysis of a microarray database and examination of human tissue samples. Human colon adenomas were examined because they contain cells with relatively high p16 and p53 expression and the absence of both mitotic and cell proliferation markers compared with normal tissue (32, 33). Examination of a human colon adenoma microarray database (34) revealed that the average expression of p53 mRNA is higher in human colon adenomas as compared with normal colon, consistent with a relatively higher level of senescence in adenomas as compared with non-transformed tissue (Fig. 14A). By contrast, the average expression of ATF4 and BiP mRNA was higher in human colon adenomas as compared with normal colon, which is consistent with a relatively higher level of ER stress in adenomas as compared with non-transformed tissue (Fig. 14A). However, when tumors were examined, a negative correlation between mRNA expression of the senescence marker p53 and three UPR markers, ATF6, BiP, and ATF4, was found (Fig. 14B). In addition, a negative correlation was also found between p16 and BiP expression in three independent human colon adenoma tissue samples examined (Fig. 14C). These data strongly support the hypothesis that ER stress can also attenuate cellular senescence in human benign lesions.
FIGURE 14.

ER stress is negatively correlated with cellular senescence in human benign lesions. A, average expression of p53, ATF4, and BiP mRNA in normal colon and colon adenomas from a microarray database, n = 32 tumor and 32 normal colon samples. B, linear regression of relative mRNA expression of p53 compared with that of ATF4, ATF6, and BiP in human colon adenomas, n = 32 tumor samples. C, β-gal staining and immunofluorescence of p16 and BiP in three human colon adenomas. Values represent the mean ± S.E. *, significantly different than normal colon (p ≤ 0.05).
DISCUSSION
The present study revealed a novel interaction between p-AKT signaling, ER stress, and cellular senescence as summarized in Fig. 15. ER stress and UPR can either promote or inhibit tumorigenesis given different cellular contexts (2). However, the relationship between ER stress and oncogene-induced cellular senescence is less clear. A previous study showed that ER stress promotes H-RAS-induced senescence in melanocytes (3). In this study attenuation of ER stress by knockdown of ATF4 or XBP-1 or overexpression of a dominant negative ATF6 all decreased H-RAS-induced cellular senescence in melanocytes (3). In contrast, in the present study, knockdown of ATF4 or XBP-1 increased H-RAS-induced senescence in both wild-type and Pparβ/δ-null keratinocytes. Moreover, increasing ER stress by treatment with thapsigargin or tunicamycin attenuated cellular senescence in the present studies. The differences in the effects of ER stress on cellular senescence between melanocytes and mouse primary keratinocytes, mouse skin tumors, and human colon adenomas could reflect different effects of p-AKT signaling on cellular senescence in different tissues. Although p-AKT expression after ATF4 and XBP-1 knockdown in melanocytes was not changed in one study (3), decreased p-AKT signaling after both XBP-1 and ATF4 knockdown was observed in the present study. The fact that pharmacological inhibition of p-AKT signaling in melanocytes decreased cellular senescence suggests that p-AKT promotes cellular senescence in melanocytes (3). In contrast, pharmacological inhibition of p-AKT signaling in keratinocytes increased cellular senescence, suggesting that p-AKT inhibits cellular senescence in keratinocytes (11). The latter explanation is consistent with results from other studies (14, 35). The mechanisms underlying these opposing effects of p-AKT signaling on H-RAS-induced senescence in different tissues remains unclear and requires additional experimentation.
FIGURE 15.
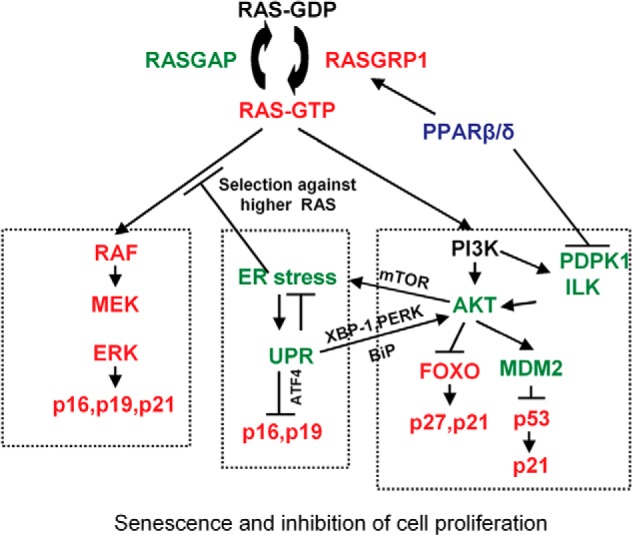
Model depicting how PPARβ/δ promotes H-RAS-induced cellular senescence, whereas ER stress attenuates H-RAS-induced cellular senescence. Previous studies showed that PPARβ/δ promotes H-RAS-induced senescence and inhibits cell proliferation by potentiating p-ERK and repressing p-AKT (left and right boxes, respectively) (11). H-RAS-induced senescence is promoted by the RAF/MEK/ERK pathway and inhibited by the PI3K/AKT pathway. This collectively leads to increased expression of proteins that mediate senescence including p16, p21, p27, and p53. PPARβ/δ promotes senescence by inhibiting the PI3K/AKT pathway, allowing for increased RAF/MEK/ERK activity. This was previously shown to be mediated by PPARβ/δ-dependent modulation of RASGRP1, PDPK1, and ILK expression (11). The present studies extend this model (middle box) by showing that ER stress and ER stress-associated UPR attenuates H-RAS-induced cellular senescence by repressing p-ERK and increasing p-AKT signaling. PPARβ/δ represses ER stress by inhibiting p-AKT/mTOR activity leading to promotion of H-RAS-induced cellular senescence and inhibition of cell proliferation.
H-RAS-induced higher p-AKT signaling activates mTOR, increases protein synthesis and ultimately enhances ER stress. Increased ER stress caused an increase in UPR, which in turn increased p-AKT signaling partially through an elevation in BiP expression. Interestingly, cell-surface BiP, which is often found in cancer cells, can induce the PI3K/AKT pathway when activated by ligand (27, 28). However, the results indicated that cell-surface BIP activity only partially mediated the increased p-AKT induced by increasing ER stress but did not explain the attenuation of senescence caused by ER stress. Thus, it is of interest to note that increased expression of XBP1 and PERK by ER stress can also increase PI3K/AKT signaling (36, 37). Furthermore, increased activity of intracellular BiP may also contribute to the increased p-AKT signaling through unknown mechanisms, and it remains possible that the increased p-AKT signaling in response to ER stress is mediated through multiple parallel pathways. Regardless of the precise mechanism, a positive feed forward loop between ER stress, UPR, and p-AKT was discovered in H-RAS-expressing keratinocytes. Intriguingly, a transient increase of ER stress induced by either thapsigargin or tunicamycin was sufficient to establish the positive feed forward loop, maintaining higher ER stress and UPR, leading to attenuation of senescence and promotion of cell proliferation and tumorigenesis long after the initial transient exposure. The effects of ER stress on promoting cell proliferation were dependent on the cell-surface BiP, as neutralizing cell-surface BiP with an anti-BiP antibody completely inhibited cell proliferation but didn't influence cellular senescence. One possible explanation is that the decrease of p-AKT expression by immunoneutralization of cell-surface BiP is relatively subtle compared with that seen by inhibition of PI3K by LY294002, and there may be different threshold levels of p-AKT required for promoting cell proliferation versus repressing senescence. It is also possible that immunoneutralizing cell-surface BiP triggers p-AKT-independent responses that offset the pro-senescence effects of decreased p-AKT signaling.
Higher p-AKT signaling was positively correlated with increased ER stress and UPR and negatively correlated with senescence in mouse skin tumors in vivo. In addition, a negative correlation between BiP and p16 was noted in human colon adenomas harboring KRAS mutations and between the expression of the senescence marker p53 mRNA and ER stress markers ATF4, ATF6, and BiP mRNAs in human colon adenomas. Interestingly, this negative correlation may also exist even in the absence of activated RAS/p-AKT signaling because ATF4 was shown to promote tumorigenesis by directly repressing p16 and p19 expression (38). Thus, ER stress may attenuate cellular senescence through both p-AKT-dependent and p-AKT-independent mechanisms.
In addition to activation of the p-AKT pathway, ER stress can also modulate p-ERK signaling and attenuate cellular senescence. Increasing ER stress by tunicamycin and thapsigargin decreases p-ERK signaling potentially by selecting against higher H-RAS-expressing cells. This selection could be due to increased sensitivity to ER stress-induced apoptosis in cells expressing relative higher level of H-RAS. Indeed, increased PARP cleavage was observed in H-RAS-expressing cells after tunicamycin and thapsigargin treatment (data not shown). Further experiments are needed to test this hypothesis. Several studies have reported that inhibition of p-ERK activity represses oncogene-induced senescence by down-regulating expression of p16 and p21 (11, 39, 40). Therefore, decreased p-ERK signaling could also mediate decreased cellular senescence after increased ER stress.
Interestingly, PPARβ/δ represses H-RAS-induced ER stress by repressing ILK/PDPK1/p-AKT/mTOR signaling pathway, consistent with repression of p-AKT signaling and decreased expression of ER stress markers including ATF4, ATF6, and BiP by overexpression of PPARβ/δ. Previous studies showed that PPARβ/δ promotes H-RAS-induced cellular senescence by up-regulating p-ERK and repressing p-AKT signaling by transcriptionally regulating the expression of RASGRP1 and ILK, respectively (11). Through the repression of ER stress, PPARβ/δ could reinforce the higher p-ERK and lower p-AKT signaling to promote cellular senescence (Fig. 15).
Acknowledgments
We gratefully acknowledge Drs. Andrew Billin and Timothy Willson for providing the GW0742, the Center for Quantitative Cell Analysis and the Genomic Core Facility at the Huck Institutes of Life Sciences of The Pennsylvania State University for technical support with flow cytometry and data analysis, and Daniel Beard from the Penn State Hershey Cancer Institute Tissue Bank for providing the human tissue samples.
This work was supported, in whole or in part, by National Institutes of Health Grants CA124533, CA141029, CA140369, and AA018863 (to J. M. P.), CA122109 and CA117957 (to A. B. G.), and ZIABC005561, ZIABC005562, and ZIABC005708 (NCI Intramural Research Program; to F. J. G.).
- ER
- endoplasmic reticulum
- UPR
- unfolded protein response
- PPARβ/δ
- proliferator-activated receptor β/δ
- ROS
- reactive oxygen species
- PCNA
- proliferating cell nuclear antigen
- mTOR
- mammalian target of rapamycin
- PERK
- protein kinase RNA-like endoplasmic reticulum kinase.
REFERENCES
- 1. Lin J. H., Walter P., Yen T. S. (2008) Endoplasmic reticulum stress in disease pathogenesis. Annu. Rev. Pathol. 3, 399–425 [DOI] [PMC free article] [PubMed] [Google Scholar]
- 2. Tsai Y. C., Weissman A. M. (2010) The unfolded protein response, degradation from endoplasmic reticulum and cancer. Genes Cancer 1, 764–778 [DOI] [PMC free article] [PubMed] [Google Scholar]
- 3. Denoyelle C., Abou-Rjaily G., Bezrookove V., Verhaegen M., Johnson T. M., Fullen D. R., Pointer J. N., Gruber S. B., Su L. D., Nikiforov M. A., Kaufman R. J., Bastian B. C., Soengas M. S. (2006) Anti-oncogenic role of the endoplasmic reticulum differentially activated by mutations in the MAPK pathway. Nat. Cell Biol. 8, 1053–1063 [DOI] [PubMed] [Google Scholar]
- 4. Courtois-Cox S., Jones S. L., Cichowski K. (2008) Many roads lead to oncogene-induced senescence. Oncogene 27, 2801–2809 [DOI] [PubMed] [Google Scholar]
- 5. Bility M. T., Devlin-Durante M. K., Blazanin N., Glick A. B., Ward J. M., Kang B. H., Kennett M. J., Gonzalez F. J., Peters J. M. (2008) Ligand activation of peroxisome proliferator-activated receptor-β/δ (PPARβ/δ) inhibits chemically induced skin tumorigenesis. Carcinogenesis 29, 2406–2414 [DOI] [PMC free article] [PubMed] [Google Scholar]
- 6. Bility M. T., Zhu B., Kang B. H., Gonzalez F. J., Peters J. M. (2010) Ligand activation of peroxisome proliferator-activated receptor-β/δ and inhibition of cyclooxygenase-2 enhances inhibition of skin tumorigenesis. Toxicol. Sci. 113, 27–36 [DOI] [PMC free article] [PubMed] [Google Scholar]
- 7. Kim D. J., Akiyama T. E., Harman F. S., Burns A. M., Shan W., Ward J. M., Kennett M. J., Gonzalez F. J., Peters J. M. (2004) Peroxisome proliferator-activated receptor β (δ)-dependent regulation of ubiquitin C expression contributes to attenuation of skin carcinogenesis. J. Biol. Chem. 279, 23719–23727 [DOI] [PubMed] [Google Scholar]
- 8. Kim D. J., Prabhu K. S., Gonzalez F. J., Peters J. M. (2006) Inhibition of chemically induced skin carcinogenicity by sulindac is independent of peroxisome proliferator-activated receptor-β/δ (PPARβ/δ). Carcinogenesis 27, 1105–1112 [DOI] [PubMed] [Google Scholar]
- 9. Zhu B., Bai R., Kennett M. J., Kang B. H., Gonzalez F. J., Peters J. M. (2010) Chemoprevention of chemically induced skin tumorigenesis by ligand activation of peroxisome proliferator-activated receptor-β/δ and inhibition of cyclooxygenase 2. Mol. Cancer Ther. 9, 3267–3277 [DOI] [PMC free article] [PubMed] [Google Scholar]
- 10. Zhu B., Khozoie C., Bility M. T., Ferry C. H., Blazanin N., Glick A. B., Gonzalez F. J., Peters J. M. (2012) Peroxisome proliferator-activated receptor β/δ cross-talks with E2F and attenuates mitosis in H-RAS-expressing cells. Mol. Cell. Biol. 32, 2065–2082 [DOI] [PMC free article] [PubMed] [Google Scholar]
- 11. Zhu B., Ferry C. H., Blazanin N., Bility M. T., Khozoie C., Kang B. H., Glick A. B., Gonzalez F. J., Peters J. M. (November 11, 2013) PPARβ/δ promotes H-RAS-induced senescence and tumor suppression by potentiating p-ERK and repressing p-AKT signaling. Oncogene 10.1038/onc.2013.477 [DOI] [PMC free article] [PubMed] [Google Scholar]
- 12. Dlugosz A. A., Glick A. B., Tennenbaum T., Weinberg W. C., Yuspa S. H. (1995) Isolation and utilization of epidermal keratinocytes for oncogene research. Methods Enzymol. 254, 3–20 [DOI] [PubMed] [Google Scholar]
- 13. Borland M. G., Khozoie C., Albrecht P. P., Zhu B., Lee C., Lahoti T. S., Gonzalez F. J., Peters J. M. (2011) Stable over-expression of PPARβ/δ and PPARγ to examine receptor signaling in human HaCaT keratinocytes. Cell. Signal. 23, 2039–2050 [DOI] [PMC free article] [PubMed] [Google Scholar]
- 14. Courtois-Cox S., Genther Williams S. M., Reczek E. E., Johnson B. W., McGillicuddy L. T., Johannessen C. M., Hollstein P. E., MacCollin M., Cichowski K. (2006) A negative feedback signaling network underlies oncogene-induced senescence. Cancer Cell 10, 459–472 [DOI] [PMC free article] [PubMed] [Google Scholar]
- 15. Seufferlein T., Rozengurt E. (1996) Rapamycin inhibits constitutive p70s6k phosphorylation, cell proliferation, and colony formation in small cell lung cancer cells. Cancer Res. 56, 3895–3897 [PubMed] [Google Scholar]
- 16. Kelber J. A., Panopoulos A. D., Shani G., Booker E. C., Belmonte J. C., Vale W. W., Gray P. C. (2009) Blockade of Cripto binding to cell-surface GRP78 inhibits oncogenic Cripto signaling via MAPK/PI3K and Smad2/3 pathways. Oncogene 28, 2324–2336 [DOI] [PMC free article] [PubMed] [Google Scholar]
- 17. Strickland J. E., Greenhalgh D. A., Koceva-Chyla A., Hennings H., Restrepo C., Balaschak M., Yuspa S. H. (1988) Development of murine epidermal cell lines which contain an activated rasHa oncogene and form papillomas in skin grafts on athymic nude mouse hosts. Cancer Res. 48, 165–169 [PubMed] [Google Scholar]
- 18. Yuspa S. H., Morgan D. L. (1981) Mouse skin cells resistant to terminal differentiation associated with initiation of carcinogenesis. Nature 293, 72–74 [DOI] [PubMed] [Google Scholar]
- 19. Debacq-Chainiaux F., Erusalimsky J. D., Campisi J., Toussaint O. (2009) Protocols to detect senescence-associated β-galactosidase (SA-βgal) activity, a biomarker of senescent cells in culture and in vivo. Nat. Protoc. 4, 1798–1806 [DOI] [PubMed] [Google Scholar]
- 20. Vijayachandra K., Lee J., Glick A. B. (2003) Smad3 regulates senescence and malignant conversion in a mouse multistage skin carcinogenesis model. Cancer Res. 63, 3447–3452 [PubMed] [Google Scholar]
- 21. He P., Borland M. G., Zhu B., Sharma A. K., Amin S., El-Bayoumy K., Gonzalez F. J., Peters J. M. (2008) Effect of ligand activation of peroxisome proliferator-activated receptor-β/δ (PPARβ/δ) in human lung cancer cell lines. Toxicology 254, 112–117 [DOI] [PMC free article] [PubMed] [Google Scholar]
- 22. Palkar P. S., Borland M. G., Naruhn S., Ferry C. H., Lee C., Sk U. H., Sharma A. K., Amin S., Murray I. A., Anderson C. R., Perdew G. H., Gonzalez F. J., Müller R., Peters J. M. (2010) Cellular and pharmacological selectivity of the PPARβ/δ antagonist GSK3787. Mol. Pharmacol. 78, 419–430 [DOI] [PMC free article] [PubMed] [Google Scholar]
- 23. Manning B. D., Cantley L. C. (2007) AKT/PKB signaling: navigating downstream. Cell 129, 1261–1274 [DOI] [PMC free article] [PubMed] [Google Scholar]
- 24. Chiang G. G., Abraham R. T. (2007) Targeting the mTOR signaling network in cancer. Trends Mol. Med. 13, 433–442 [DOI] [PubMed] [Google Scholar]
- 25. Morgan D., Welty D., Glick A., Greenhalgh D., Hennings H., Yuspa S. H. (1992) Development of an in vitro model to study carcinogen-induced neoplastic progression of initiated mouse epidermal cells. Cancer Res. 52, 3145–3156 [PubMed] [Google Scholar]
- 26. Samali A., Fitzgerald U., Deegan S., Gupta S. (2010) Methods for monitoring endoplasmic reticulum stress and the unfolded protein response. Int. J. Cell Biol. 2010, 830307. [DOI] [PMC free article] [PubMed] [Google Scholar]
- 27. Lee A. S. (2007) GRP78 induction in cancer: therapeutic and prognostic implications. Cancer Res. 67, 3496–3499 [DOI] [PubMed] [Google Scholar]
- 28. Ni M., Zhang Y., Lee A. S. (2011) Beyond the endoplasmic reticulum: atypical GRP78 in cell viability, signalling, and therapeutic targeting. Biochem. J. 434, 181–188 [DOI] [PMC free article] [PubMed] [Google Scholar]
- 29. Hsieh Y. H., Su I. J., Lei H. Y., Lai M. D., Chang W. W., Huang W. (2007) Differential endoplasmic reticulum stress signaling pathways mediated by iNOS. Biochem. Biophys. Res. Commun. 359, 643–648 [DOI] [PubMed] [Google Scholar]
- 30. Collado M., Gil J., Efeyan A., Guerra C., Schuhmacher A. J., Barradas M., Benguría A., Zaballos A., Flores J. M., Barbacid M., Beach D., Serrano M. (2005) Tumour biology: senescence in premalignant tumours. Nature 436, 642. [DOI] [PubMed] [Google Scholar]
- 31. Carrasco D. R., Sukhdeo K., Protopopova M., Sinha R., Enos M., Carrasco D. E., Zheng M., Mani M., Henderson J., Pinkus G. S., Munshi N., Horner J., Ivanova E. V., Protopopov A., Anderson K. C., Tonon G., DePinho R. A. (2007) The differentiation and stress response factor XBP-1 drives multiple myeloma pathogenesis. Cancer Cell 11, 349–360 [DOI] [PMC free article] [PubMed] [Google Scholar]
- 32. Dai C. Y., Furth E. E., Mick R., Koh J., Takayama T., Niitsu Y., Enders G. H. (2000) p16(INK4a) expression begins early in human colon neoplasia and correlates inversely with markers of cell proliferation. Gastroenterology 119, 929–942 [DOI] [PubMed] [Google Scholar]
- 33. Kuilman T., Michaloglou C., Vredeveld L. C., Douma S., van Doorn R., Desmet C. J., Aarden L. A., Mooi W. J., Peeper D. S. (2008) Oncogene-induced senescence relayed by an interleukin-dependent inflammatory network. Cell 133, 1019–1031 [DOI] [PubMed] [Google Scholar]
- 34. Sabates-Bellver J., Van der Flier L. G., de Palo M., Cattaneo E., Maake C., Rehrauer H., Laczko E., Kurowski M. A., Bujnicki J. M., Menigatti M., Luz J., Ranalli T. V., Gomes V., Pastorelli A., Faggiani R., Anti M., Jiricny J., Clevers H., Marra G. (2007) Transcriptome profile of human colorectal adenomas. Mol. Cancer Res. 5, 1263–1275 [DOI] [PubMed] [Google Scholar]
- 35. Kennedy A. L., Morton J. P., Manoharan I., Nelson D. M., Jamieson N. B., Pawlikowski J. S., McBryan T., Doyle B., McKay C., Oien K. A., Enders G. H., Zhang R., Sansom O. J., Adams P. D. (2011) Activation of the PIK3CA/AKT pathway suppresses senescence induced by an activated RAS oncogene to promote tumorigenesis. Mol. Cell 42, 36–49 [DOI] [PMC free article] [PubMed] [Google Scholar]
- 36. Bobrovnikova-Marjon E., Pytel D., Riese M. J., Vaites L. P., Singh N., Koretzky G. A., Witze E. S., Diehl J. A. (2012) PERK utilizes intrinsic lipid kinase activity to generate phosphatidic acid, mediate Akt activation, and promote adipocyte differentiation. Mol. Cell. Biol. 32, 2268–2278 [DOI] [PMC free article] [PubMed] [Google Scholar]
- 37. Hu M. C., Gong H. Y., Lin G. H., Hu S. Y., Chen M. H., Huang S. J., Liao C. F., Wu J. L. (2007) XBP-1, a key regulator of unfolded protein response, activates transcription of IGF1 and Akt phosphorylation in zebrafish embryonic cell line. Biochem. Biophys. Res. Commun. 359, 778–783 [DOI] [PubMed] [Google Scholar]
- 38. Horiguchi M., Koyanagi S., Okamoto A., Suzuki S. O., Matsunaga N., Ohdo S. (2012) Stress-regulated transcription factor ATF4 promotes neoplastic transformation by suppressing expression of the INK4a/ARF cell senescence factors. Cancer Res. 72, 395–401 [DOI] [PubMed] [Google Scholar]
- 39. de Keizer P. L., Packer L. M., Szypowska A. A., Riedl-Polderman P. E., van den Broek N. J., de Bruin A., Dansen T. B., Marais R., Brenkman A. B., Burgering B. M. (2010) Activation of forkhead box O transcription factors by oncogenic BRAF promotes p21cip1-dependent senescence. Cancer Res. 70, 8526–8536 [DOI] [PMC free article] [PubMed] [Google Scholar]
- 40. Satyanarayana A., Greenberg R. A., Schaetzlein S., Buer J., Masutomi K., Hahn W. C., Zimmermann S., Martens U., Manns M. P., Rudolph K. L. (2004) Mitogen stimulation cooperates with telomere shortening to activate DNA damage responses and senescence signaling. Mol. Cell. Biol. 24, 5459–5474 [DOI] [PMC free article] [PubMed] [Google Scholar]