Background: The mechanisms of apoptosis induced by antifibrosis therapy in activated hepatic stellate cells (aHSCs), the main collagen producer in cirrhotic livers, are unknown.
Results: aHSCs underwent apoptosis by inhibiting the supply of membrane type 1 matrix metalloproteinase (MT1-MMP)-cleaved collagen.
Conclusion: aHSCs require MT1-MMP-cleaved collagen for their survival.
Significance: Interference with the supply of MT1-MMP-cleaved collagen for aHSCs is a reasonable antifibrosis strategy.
Keywords: Apoptosis, Extracellular Matrix, Fibrosis, Heat Shock Protein (HSP), Integrin
Abstract
Stellate cells are distributed throughout organs, where, upon chronic damage, they become activated and proliferate to secrete collagen, which results in organ fibrosis. An intriguing property of hepatic stellate cells (HSCs) is that they undergo apoptosis when collagen is resolved by stopping tissue damage or by treatment, even though the mechanisms are unknown. Here we disclose the fact that HSCs, normal diploid cells, acquired dependence on collagen for their growth during the transition from quiescent to active states. The intramolecular RGD motifs of collagen were exposed by cleavage with their own membrane type 1 matrix metalloproteinase (MT1-MMP). The following evidence supports this conclusion. When rat activated HSCs (aHSCs) were transduced with siRNA against the collagen-specific chaperone gp46 to inhibit collagen secretion, the cells underwent autophagy followed by apoptosis. Concomitantly, the growth of aHSCs was suppressed, whereas that of quiescent HSCs was not. These in vitro results are compatible with the in vivo observation that apoptosis of aHSCs was induced in cirrhotic livers of rats treated with siRNAgp46. siRNA against MT1-MMP and addition of tissue inhibitor of metalloproteinase 2 (TIMP-2), which mainly inhibits MT1-MMP, also significantly suppressed the growth of aHSCs in vitro. The RGD inhibitors echistatin and GRGDS peptide and siRNA against the RGD receptor αVβ1 resulted in the inhibition of aHSCs growth. Transduction of siRNAs against gp46, αVβ1, and MT1-MMP to aHSCs inhibited the survival signal of PI3K/AKT/IκB. These results could provide novel antifibrosis strategies.
Introduction
Stellate cells, which are responsible for fibrosis, were first found in the liver and subsequently found to be distributed throughout organs (1). They are characterized by the specific feature of taking up vitamin A and depositing it as intracytoplasmic droplets. Recent studies revealed an additional important characteristic of stellate cells in the liver: a pivotal role in liver regeneration (2, 3). Despite the diffuse distribution of stellate cells, most detailed investigations of their character have been carried out with cells of hepatic origin.
In the liver, under conditions in which the tissue is exposed to chronic insults such as viral infection, excess deposition of fat, regurgitation of bile acids, etc., hepatic stellate cells (HSCs)2 change from quiescent to activated states and proliferate. During this process, HSCs secrete collagen, simultaneously express membrane type 1 metalloproteinase (MT1-MMP) and secrete soluble MMPs (4). However, because tissue inhibitors of metalloproteinase (TIMP) are also secreted from activated HSCs (aHSCs) (4), the activities of MMPs are relatively suppressed, and the deposition of collagen surpasses its degradation, resulting in fibrosis of the liver. In contrast, when the chronic insults are removed or halted, aHSCs undergo apoptosis (5) with partial deactivation (6) and spontaneous resolution of fibrotic tissue. Regarding the mechanism for apoptosis of aHSCs associated with resolution of fibrosis, reduced expression of TIMP has been speculated initially to be a main factor, highlighting a potential role of TIMP-1 in aHSC survival (5). The involvement of TIMP-1 in the spontaneous resolution of fibrosis and apoptosis of aHSCs was described further by employing transgenic mice (7). In addition, the function of TIMP to inhibit apoptosis of aHSCs was ascribed to their effect on metalloproteinase (8). Subsequently, the involvement of collagen itself in sustaining aHSC survival was postulated, although precise molecular mechanisms have not been clarified (9). Recently, a mechanism that is irrelevant to the role of collagen was proposed for induction of apoptosis of aHSCs: cleavage of cellular N-cadherin by MMP2 (10). Thus, the mechanisms underlying the survival and apoptosis of aHSCs in relation to the role of collagen, TIMP, and MMPs are still controversial.
We demonstrated recently that, in a rat cirrhosis (11) and pancreatitis (12) model, even under the continuous exposure to fibrogenesis substances, apoptosis of aHSCs or activated pancreatic stellate cells was induced concomitantly with resolution of collagen matrices by administration of vitamin A-coupled liposome (VA-lip) encapsulating siRNA against a collagen-specific chaperone, gp46, a rat homologue of human heat shock protein 47. This strongly suggests a relevance of collagen deposition to the survival of aHSCs and activated pancreatic stellate cells.
Because a detailed clarification of the mechanisms for these cellular fates could provide novel therapeutic opportunities for fibrosis, in this study, we explored the molecular events underlying the apoptosis or, conversely, survival of aHSCs with special reference to the role of collagen cleaved by its own MT1-MMP.
EXPERIMENTAL PROCEDURES
Materials
Recombinant human MT1-MMP, rat TIMP-1, mouse TIMP-2, human trypsin3/PRSS3, and 4-(2-aminoethyl-benzensulfonyl fluoride hydrochloride) were purchased from R&D Systems (Minneapolis, MN). Inhibitor of PI3K (LY294002), AKT (AKT-in), and IκBα (BAY11-7082) were from Calbiochem (Darmstadt, Germany). GRGDS peptide was from the Peptide Institute (Osaka, Japan), and GRGES was from Peptide International (Louisville, KY). Rat tail collagen, echistatin, and antibodies against α-smooth muscle actin (αSMA) and microtubule-associated protein 1 light chain 3 β (LC3B) were from Sigma-Aldrich (St. Louis, MO). Antibodies against glial fibrillary acidic protein (GFAP) and desmin were from Dako (Glostrup, Denmark), and anti-heat shock protein 47 (gp46) was from StressGen Biotechnologies Corp. (Victoria, BC, Canada). Antibody against integrin α1 was from Santa Cruz Biotechnology (Santa Cruz, CA), and antibodies against integrin α2, αV and β1 were from BD Biosciences. Antibody for MT1-MMP were from Abcam (Cambridge, UK). Antibody for collagen type I was from Rockland Immunochemicals Inc. (Gilbertsville, PA) and Abcam, and that against GAPDH was from Millipore (Billerica, MA). Antibodies against PI3K, AKT, and IκBα and their phosphorylated forms and integrin β3, caspase 3 and cleaved caspase 3 were obtained from Cell Signaling Technology (Danvers, MA). Antibody against LC3B was from Invitrogen. Peroxidase-coupled antibodies and gelatin-Sepharose- or heparin-packed columns were from GE Healthcare (Waukesha, WI) and Cell Signaling Technology. Antibody against fibronectin was from BD Biosciences, and that against vitronectin was from Cosmo Bio Co., Ltd. (Tokyo, Japan).
Isolation of Rat HSCs
HSCs were isolated from livers of Sprague-Dawley rat as described previously (11). An HSC-enriched fraction was obtained by density gradient centrifugation in Hanks' balanced salt solution containing 13.5% Nycodenz (Axis-Shield plc, Dundee, Scotland) at 1400 × g for 20 min and cultured in DMEM (Sigma-Aldrich) containing 10% FBS (Hyclone Laboratories, Inc., South Logan, UT), 100 units/ml penicillin, and 100 μg/ml streptomycin at 37 °C in a 5% CO2 atmosphere. Purity was assessed by microscopy and immunocytochemistry using antibodies against GFAP, desmin, and αSMA. Both the cell purity and viability exceeded 95%. Cells cultured for 1–2 days were used as quiescent HSCs (qHSCs), which do not proliferate, contain vitamin A in lipid droplets, and express GFAP but not collagen (3, 13). HSCs subcultured for 4–5 days transdifferentiate spontaneously into activated myofibroblast-like cells, used as aHSCs, which proliferate to induce fibrosis and express αSMA, gp46, and collagen. All animal experiments were reviewed and approved by the Institutional Animal Care and Use Committee at Sapporo Medical University.
Preparation of siRNAs
siRNA against gp46 was purchased from Hokkaido System Science Co., Ltd. (Sapporo, Japan). siRNAs against integrins, MMPs, fibronectin, and GFP were from Ambion (Foster City, CA). The sequences of siRNA are shown in supplemental Table 1.
Transfection of siRNAs
HSCs in 6-well culture plates were transfected with 5–10 nm of siRNAs using RNAiMAX (Invitrogen) according to the protocol of the manufacturer. Where stated, cells transfected with siRNAGFP with the same concentration and under the same conditions were used as a control.
Western Blot Analysis
Equal amounts of protein extracts of cell lysates were resolved over 4/20 SDS-polyacrylamide gels and transferred onto PDVF membranes (Millipore). The membranes were probed with primary and secondary antibodies and visualized with ECL (GE Healthcare). Conditioned media of aHSCs were also subjected to SDS-PAGE, followed by cleanup with a ReadyPrepTM 2-D cleanup kit (Bio-Rad, Hercules, CA).
Quantitative RT-PCR
Total RNA was isolated using an RNeasy mini kit (Qiagen, Germantown, MD) and used for reverse transcription with high-capacity RNA-to-cDNA Master Mix (Applied Biosystems). The reactions were performed with Power SYBR Green PCR Master Mix (Applied Biosystems) using a 7500/7500 fast real-time PCR system (Applied Biosystems). The sequences of primer are shown in supplemental Table 2. The results were expressed as the ratio of the number of copies of the product gene to the number of copies of a housekeeping gene (GAPDH) from the same RNA sample and subjected to PCR.
Immunochemistry
HSCs were fixed in 4% paraformaldehyde at 4 °C for 15 min, permeabilized in 0.1% Triton X-PBS at room temperature for 30 min, blocked in membrane blocking solution (Invitrogen) at room temperature for 30 min, subjected to staining of GFAP, desmin, and αSMA, and visualized by Alexa Fluor 488- or Alexa Fluor 555-conjugated antibody. For immunohistochemistry, a rat was perfused with saline and Mildform (Wako Pure Chemical Industries, Ltd., Osaka, Japan), and liver specimens were fixed in Mildform at 4 °C overnight, embedded in paraffin, and sectioned. Sections were stained with anti-collagen I, αSMA, and GFAP antibody and visualized by HRP- or alkaline phosphatase-conjugated antibody. For analysis of the fibrosis area, each section was also stained with 0.1% Sirius red in saturated picric acid for 90 min. ProLong® Gold antifade reagent with or without DAPI (Invitrogen) was used as a mounting medium. All samples were examined under a BZ-9000 microscope (Keyence Corp., Osaka, Japan) with planApo ×20/0.75, S planFluor Extra-Long Working Distance ×20/0.45 Ph1, and planApo ×4/0.2 objective lenses (Nikon Corp., Tokyo, Japan). Photographs were captured using the BZ-9000 application for observation (Keyence Corp.) and processed with BZ-II Analyzer 1.31 (Keyence Corp.) for background adjustment and Photoshop Elements 4.0 (Adobe Systems Inc., San Jose, CA) for adjustments of color, brightness, and contrast balance with an identical setting for all comparative analyses.
Microarray Analyses
Total RNA of qHSCs and aHSCs from three independent isolations were subjected to microarray analyses with a SurePrint G3 Rat GE 8 × 60K microarray (Agilent Technologies, Santa Clara, CA).
Proliferation Assay
A WST-1 proliferation assay was carried out using the Premix assay system (TaKaRa Bio Inc., Shiga, Japan) for consolidation of the screening assay. If necessary, αSMA-positive cells were counted.
Apoptosis Assay
HSCs were stained for apoptotic change by TUNEL assay with an in situ cell death detection kit, POD (Roche Diagnostics, Indianapolis, IN) according to the protocol of the manufacturer. The same kit was used for tissue specimens.
Autophagy Assessment
The induction of autophagy was confirmed by immunostaining and Western blotting of microtubule-associated protein light chain 3 (LC3). The cells were also analyzed by electron microscopic observation according to a method described previously (14).
Assays for Collagen and Gelatinase in the Culture Medium
Collagen secreted by rat HSCs was assessed by Sircol soluble collagen assay (Biocolor Ltd., County Antrim, UK) according to the instructions of the manufacturer. MMP substrate III, fluorogenic (Calbiochem) was used to determine MMP (gelatinase) activity. Aliquots of 40 μl of culture medium and collagenase type IV from Clostridium histolyticum (Invitrogen) for standard curves were incubated with the substrate (2 μm) in 160 μl of the reaction buffer (50 mm Tris-HCl, 150 mm NaCl, 5 mm CaCl2, and 0.2 mm sodium azide) at 37 °C for 24 h. The fluorescence signal was measured using a fluorescence microplate reader (340/485 nm).
Preparation of 96-Well Plates Coated with Acid-extracted Collagen or MT1-MMP-cleaved Collagen
Recombinant human MT1-MMP (100 μg/ml) was activated by recombinant human active Trypsin3/PRSS3 (100 ng/ml) at 37 °C for 1 h in the activation buffer (50 mm Tris, 150 mm NaCl, 10 mm CaCl2, 5 μm ZnCl2, 0.05% (v/v) Brij-35 (pH 7.5)) and incubated with 1 mm 4-(2-aminoethyl-benzensulfonyl fluoride hydrochloride) at 25 °C for 15 min for termination. Aliquots of 6 μg of rat tail collagen dissolved in 0.1 m acetic acid were cleaved into and ¼ fragments by 500 ng of MT1-MMP for 20 h at 25 °C in the 100 μl of assay buffer (50 mm Tris, 3 mm CaCl2, and 1 μm ZnCl2 (pH 8.5)). Digestion was terminated by addition of 20 mm EDTA. Cleavage products were separated under reducing condition on SDS-PAGE gel and confirmed by BioSafe Coomassie stain (Bio-Rad). The fragments were dialyzed against PBS using a mini dialysis kit, 8 kDa cutoff (GE Healthcare). 96-well plates were coated with 100 μl of acid-soluble or MT1-MMP-cleaved collagen (10 μg/cm2) for 4 h at 25 or 37 °C, respectively, washed with Hanks' balanced salt solution, and blocked with 0.5% BSA in DMEM for 1 h at 4 °C.
Preparation of VA-lip-siRNAgp46
VA-lip-siRNAgp46 was prepared according to a method described earlier (11), paying particular attention to keep VA (retinol, Sigma-Aldrich) frozen in DMSO for each use.
Injection of VA-lip-siRNAgp46 into Rats
Dimethylnitrosamine (DMN)-treated Sprague-Dawley male rats and normal rats weighing 200 g were injected with VA-lip-siRNAgp46 (Lipotrust (Hokkaido System Science Co., Ltd.), 2 μmol/kg; VA, 2 μmol/kg; siRNA, 3 mg/kg) 4–5 times through the tail vein.
Statistics
Statistical analyses were performed, and differences between control and other groups were tested by one-way analysis of variance followed by Tukey Honestly Significant Difference Test. Paired Student's t tests were used to compare the data between two different samples.
RESULTS
Effect of siRNAgp46 on Survival of aHSCs
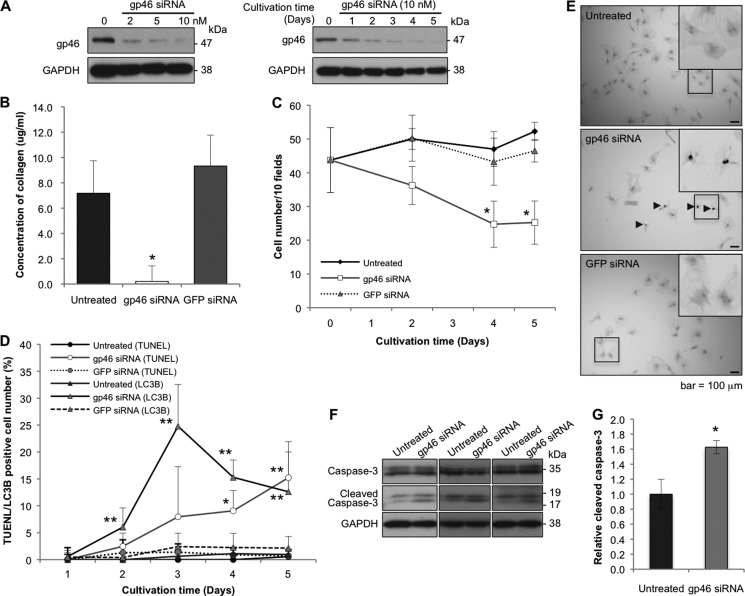
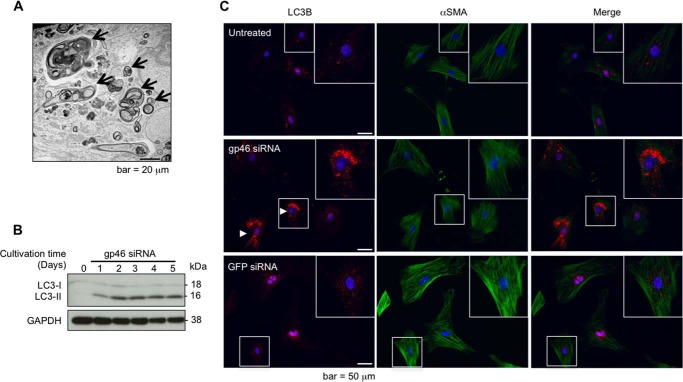
To substantiate the hypothesis that the survival of aHSCs is sustained by collagen in an autocrine manner, they were transfected with siRNA against gp46, which specifically inhibits secretion of all types of collagen. Expression of gp46 in aHSCs transfected with siRNAgp46 was suppressed in a dose-dependent manner, and the suppression lasted for 5 days (Fig. 1A). The collagen concentration in the culture medium was reduced substantially to the basal level (Fig. 1B). Cell counts of the transfectants decreased gradually and significantly as cultivation proceeded (Fig. 1C). The decrement curve of cell count inversely paralleled the transient augmentation of autophagy cells, which reached a peak at day 3 (Fig. 1D and Fig. 2, A–C) and with the subsequent accumulation of apoptotic cells (Fig. 1, D and E). Significantly higher levels of cleaved caspase 3 were observed in aHSCs treated with gp46 siRNA compared with untreated aHSCs (Fig. 1, F and G).
FIGURE 1.
Effects of siRNAgp46 on gp46 expression, collagen secretion, and proliferation of aHSCs. A, aHSCs were treated with siRNAgp46 at 2, 5, and 10 nm in DMEM containing 2% FBS for 72 h. aHSCs were also treated with siRNAgp46 at 10 nm for 1–5 days. The dose- and time-dependent suppression of gp46 expression was analyzed by Western blotting. B, collagen secretion from siRNAgp46-treated aHSCs in culture medium containing 2% FBS was assayed at day 3 of transfection. The amount of collagen in four samples was quantified by spectrophotometry at 540 nm, and the absolute concentrations were deduced from the standard curve of rat tail collagen provided by the assay kit and expressed as mean ± S.E. *, p < 0.05 compared with siRNAGFP. C, aHSCs treated with siRNAgp46 at 10 nm in DMEM with 2% FBS for 1–5 days were stained with antibody against αSMA-Cy3 and DAPI. The number of cells was monitored by counting the stained cells in 10 random fields per slide. Data are mean ± S.D. of three independent experiments. *, p < 0.05 compared with siRNAGFP. D, aHSCs treated with siRNAgp46 at 10 nm in DMEM with 2% FBS for 1–5 days were stained for apoptotic change (TUNEL positivity) and for autophagic change with antibody against LC3B. The apoptotic and autophagy-induced cells were counted in 40 random fields/slide. Data are mean ± S.D. of three independent experiments. *, p < 0.05; **, p < 0.01 compared with siRNAGFP. E, representative photomicrographs of aHSCs undergoing apoptosis at day 5 of transfection. Arrowheads indicate TUNEL-positive cells. Scale bars = 100 μm. F, expression of caspase 3 and cleaved caspase 3 was analyzed for aHSCs treated with 10 nm of siRNAgp46 in DMEM containing 2% FBS for 3 days to examine the effect of siRNAgp46 on apoptosis induction. G, quantitative analyses of levels of cleaved caspase 3 protein in untreated and gp46 siRNA-treated aHSCs. The results are mean ± S.D. of three samples. *, p < 0.05.
FIGURE 2.
Effects of siRNAgp46 on autophagy induction of aHSCs. A, representative transmission electron microscopic photographs of aHSCs treated with siRNAgp46 at 10 nm for 3 days showing autophagosomes (arrows). Scale bar = 20 μm. B, aHSCs were treated with siRNAgp46 at 10 nm for 1–5 days, and the induction of autophagy was confirmed by Western blotting analysis of LC3, which exists in two forms, the 18-kDa cytosolic protein (LC3-I) and the processed 16-kDa form (LC3-II), which associates with autophagosome membranes. C, representative immunofluorescent images of LC3B visualized by Alexa Fluor 555-conjugated antibody (red, left column), αSMA visualized by Alexa Fluor 488-conjugated antibody (green, center column), and merged images (right column) with nuclei counterstained by DAPI (blue) in HSCs at day 3 of transfection. Scale bar = 50 μm.
Effect of siRNAgp46 on qHSCs
To elucidate whether collagen is a requisite for sustaining the survival of HSCs even before they are activated (quiescent state) or whether their survival dependence on self-collagen is acquired gradually as the activation process progressed (dependence), we injected rats with siRNAgp46 encapsulated in VA-lip 4 times, isolated qHSCs from these rats, and examined their survival in vitro after one more transfection with siRNAgp46 at day 1.
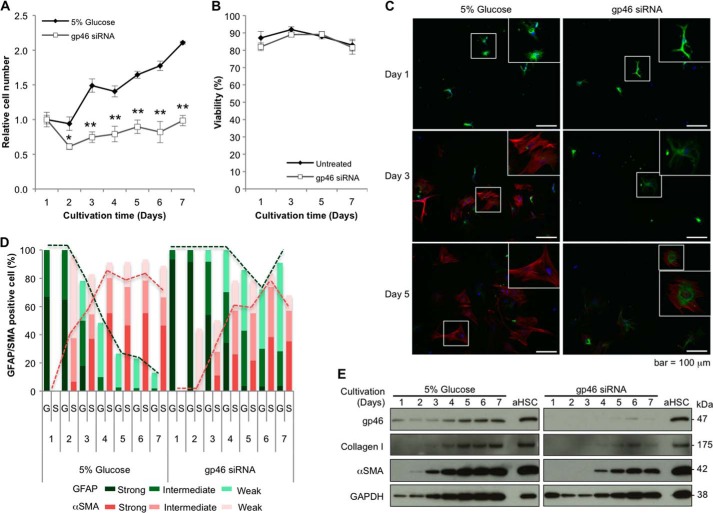
The number of cells of qHSCs treated with siRNAgp46 did not change during 7 days of cultivation (Fig. 3A), and dye exclusion assays revealed no significant death of qHSCs treated with siRNAgp46 during this period (Fig. 3B). During this cultivation, the expression of gp46 and collagen was kept suppressed (Fig. 3E). In contrast, siRNAgp46 non-transduced qHSCs started to proliferate after day 3 of cultivation, expressing gp46 and collagen on days 1 and 2 (Fig. 3E). When we examined the switch of expression of GFAP to αSMA with immunostaining, the transition was retarded substantially in siRNAgp46-transduced qHSCs compared with non-transduced cells (Fig. 3, C–E).
FIGURE 3.
Effects of siRNAgp46 on proliferation and expression of GFAP, αSMA, gp46, and collagen I of qHSCs. A, qHSCs isolated from Sprague-Dawley rats injected intravenously with 5% glucose or VA-lip-siRNAgp46 four times were further transfected with 10 nm of siRNAGFP or siRNAgp46, respectively, in DMEM containing 10% FBS. In vitro cell proliferation was monitored by counting the number of cells for 7 days. Results are expressed as percentage of cell number of HSCs at day 1 as mean ± S.D. of triplicate samples. *, p < 0.05; **, p < 0.01. B, viability of qHSCs treated with 10 nm of siRNAgp46 was examined by dye exclusion assay at days 1, 3, 5, and 7 of transfection. Data are mean ± S.D. of triplicate samples. C, representative immunofluorescent images of GFAP visualized by Alexa Fluor 488-conjugated antibody (green) and αSMA by Cy3-conjugated antibody (red) and DAPI (blue) in HSCs at days 1, 3, and 5 after transfection of siRNAGFP or siRNAgp46 using fluorescent microscopy (Keyence Corp., BZ-8000). Scale bars = 100 μm. D, qHSCs treated with siRNAGFP or siRNAgp46 for 7 days were stained with antibody against GFAP and αSMA. The numbers of cells showing strong (clear), intermediate, and weak staining for either GFAP (G) and αSMA (S) were counted in three random fields/slide, and results are expressed in percentages. E, protein was extracted from qHSCs treated with siRNAGFP or siRNAgp46 at 10 nm in the presence of 10% FBS for 7 days. The suppression of gp46, collagen, and αSMA expression was analyzed by Western blotting.
Effect of VA-lip siRNAgp46 Administration on aHSCs in DMN-treated Rats and on qHSCs in Normal Rats
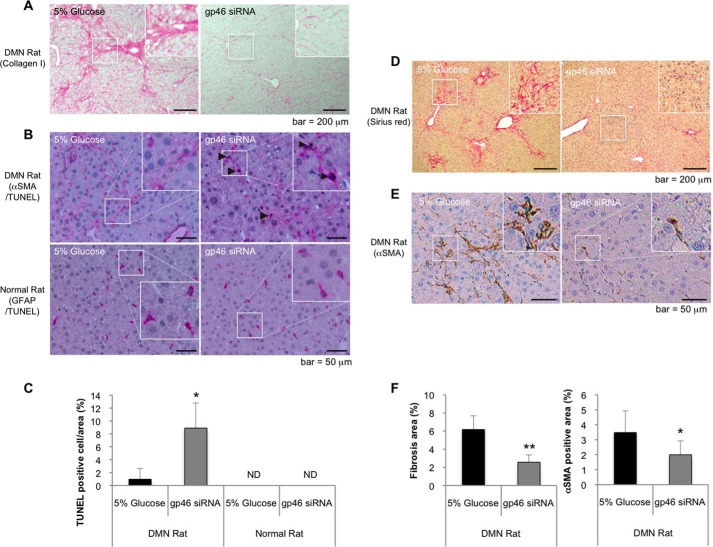
To verify the above in vitro observations with in vivo experiments and to confirm the previously reported apoptotic effect of siRNAgp46 in DMN rats, we injected VA-lip-siRNAgp46 into DMN and normal rats. In DMN rats, concomitantly with resolution of collagen fibrils (Fig. 4A), nearly 10% of αSMA-positive cells in the αSMA-positive cell population were stained by TUNEL assays after four sets of injection of VA-lip-siRNAgp46 (Fig. 4, B and C) when the fibrosis area and a substantial number of aHSCs should have been already reduced by treatment (Fig. 4, D–F). These results are compatible with our previous report (11), although, in normal rats, even after four injections of drug, no TUNEL-positive cells were observed in a GFAP-positive cell population (Fig. 4, B and C).
FIGURE 4.
Apoptosis of rat HSCs induced by VA-lip-siRNAgp46 treatment in DMN-treated and normal control rats. A, representative photomicrographs of collagen I immunostaining in the livers of DMN-treated rats that were injected with 5% glucose or VA-lip-siRNAgp46, respectively, four times every other day. Scale bars = 200 μm. B, apoptotic HSCs were labeled with fluorescein incorporated in DNA strand breaks by terminal deoxynucleotidyl transferase and visualized by HRP-conjugated anti-fluorescein antibody (brown). Representative photomicrographs of apoptotic HSCs were obtained from livers of DMN-treated and normal control rats that were injected with 5% glucose or VA-lip-siRNAgp46, respectively, four times every other day. aHSCs in cirrhotic rats and qHSCs in normal rats were stained with antibodies against αSMA and GFAP, respectively, that were visualized by alkaline phosphatase-conjugated antibody (pink). Scale bars = 50 μm. C, apoptotic and total nuclei were counted in four randomly selected fields per slide for each indicated treatment. Data were expressed in percentages as mean ± S.D. ND, not detectable. *, p < 0.05. D and E, representative photomicrographs of Sirius red (D) and αSMA (E) staining in the livers of cirrhosis rat injected with 5% glucose or VA-lip-siRNAgp46 (2), respectively, five times every other day. Scale bars = 200 μm, 50 μm. F, fibrosis and the αSMA-positive area were examined in 4 slides/liver for each individual. Data are shown in percentages as mean ± S.D. of nine rats.**, p < 0.01; *, p < 0.05.
Effect of TIMP on the Growth of siRNAgp46-transfected and Non-transfected aHSCs
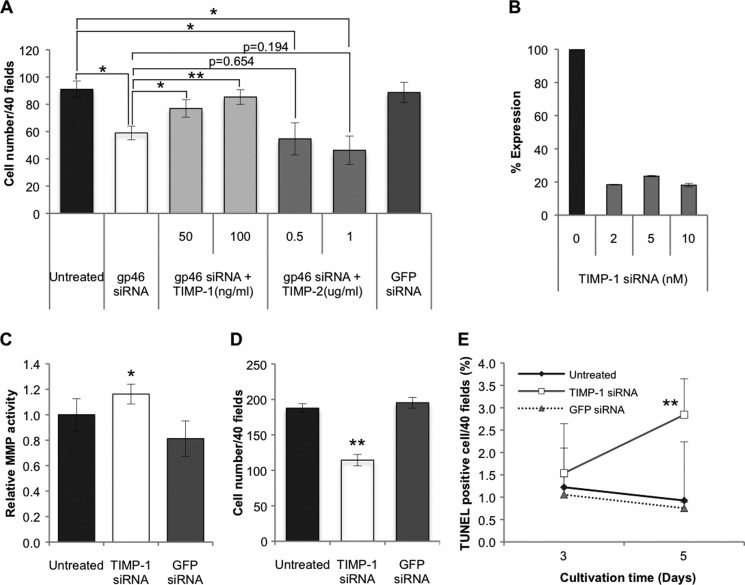
To ensure that the growth suppression of siRNAgp46 transfectants is due to the diminution of collagen in the culture medium and not due to the collagen-irrelevant cytotoxic effect of siRNAgp46, such as endoplasmic reticulum stress, we explored the possible restoration of the suppressed growth of transfectants by supplementing TIMP, which should inhibit collagen degradation by MMPs secreted from themselves. Addition of TIMP-1 clearly restored the impaired growth of transfectants (Fig. 5A). On the other hand, TIMP-2 unexpectedly tended to augment, although marginally (p = 0.194 at 1 μg/ml), the growth suppression effect of siRNAgp46 (Fig. 5A).
FIGURE 5.
Effects of TIMPs and siRNATIMP-1 on proliferation or apoptosis induction of aHSCs pretreated with or without siRNAgp46. A, aHSCs transduced with 10 nm of siRNAgp46 were treated with recombinant rat TIMP-1 (50, 100 ng/ml) or mouse TIMP-2 (0. 5, 1.0 μg/ml), (the sequence is identical to rat TIMP-2 protein) in DMEM containing 2% FBS for 3 days. The number of cells stained with antibody against αSMA-Cy3 was counted in 40 random fields per slide. Data are presented as mean ± S.D. of triplicate samples. *, p < 0.05; **, p < 0.01. B, efficient knockdown of TIMP-1 was confirmed by quantitative RT-PCR at day 2 of transfection. C, MMP activity of the culture medium of aHSCs transduced with 10 nm of siRNATIMP-1 in serum-free DMEM for 24–72 h of transfection was assessed with fluorogenic MMP substrate. The fluorescence signal was measured using a microplate reader (340/485 nm), and results were expressed in percentages of MMP activity as mean ± S.D. *, p < 0.05 compared with siRNAGFP. D, cell numbers of aHSCs transduced with siRNATIMP-1 at 10 nm in DMEM with 2% FBS at day 3 of transfection were counted after they were stained with antibody against αSMA-Cy3 in 40 random fields per slide. Data are represented as mean ± S.D. of three independent experiments. **, p < 0.01 compared with siRNAGFP. E, aHSCs treated with siRNATIMP-1 in DMEM containing 2% FBS for 3 and 5 days were stained for apoptotic change. The apoptotic cells were counted in 40 random fields per slide. Data are mean ± S.D. of three independent experiments. **, p < 0.01 compared with siRNAGFP.
Effect of siRNATIMP-1 on the Growth of aHSCs
To ascertain the role of endogenous TIMP-1 in the survival of aHSCs, TIMP-1 of these cells was silenced with siRNA (Fig. 5B). Firstly, we examined its effect on MMP activity of culture medium and found that the MMP activity of siRNATIMP-1-treated aHSCs was higher than that of non-transfectant (Fig. 5C). As expected, siRNATIMP-1 brought about a significant suppression of cell number (Fig. 5D) paralleling the increment of apoptotic cells (Fig. 5E).
Relevance of MMP to the Survival of aHSCs
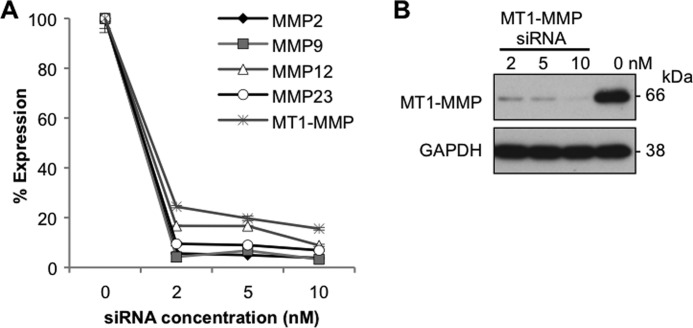
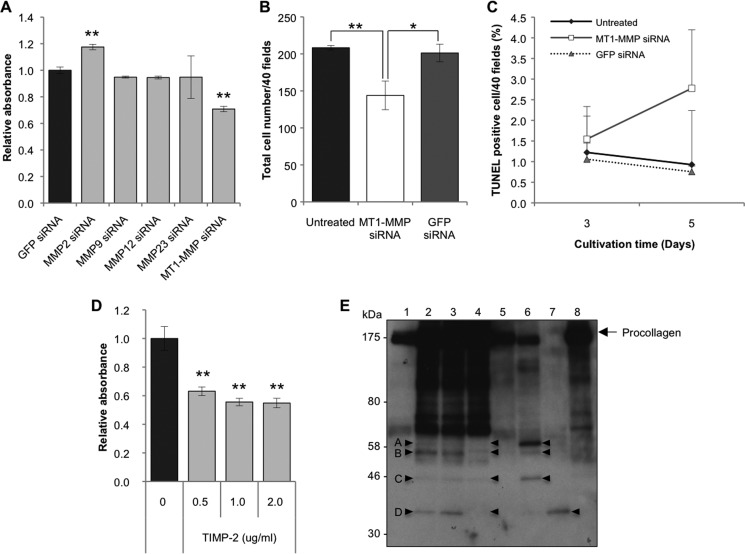
We next determined whether the activities of TIMP-1 and TIMP-2 on aHSC survival, described above, can be ascribed to those of their target molecules, MMPs. Microarray assays for mRNA expression profiles of aHSCs revealed that mRNAs of MT1-MMP, MMP12, MMP2, and MMP23 were highly expressed (supplemental Table 3). When each of these mRNAs was silenced (Fig. 6A and B), only siRNA against MMP2 caused significant growth stimulation (Fig. 7A). By contrast, siRNA against MT1-MMP significantly suppressed the growth of aHSCs (Fig. 7, A and B) in accordance with the increment of apoptotic cells (Fig. 7C). The growth-promoting activity of MT1-MMP was confirmed by the result that the growth of aHSCs was suppressed significantly by TIMP-2 (Fig. 7D), which supposedly inhibits MT1-MMP activity. Although MMP9 has been reported previously to suppress the growth of aHSCs when added to the culture medium (15), mRNA of MMP9 was not increased in aHSCs (supplemental Table 3), and silencing of this mRNA resulted in no significant growth retardation (Fig. 7A).
FIGURE 6.
Silencing effects of siRNAs against MMPs. A, aHSCs were treated with siRNA against MMP2, MMP9, MMP12, MMP23, and MT1-MMP at 2, 5, and 10 nm in DMEM containing 10% FBS for 48 h. Suppression of MMP expression was quantitated by quantitative RT-PCR. B, aHSCs were treated with siRNAMT1-MMP at 2, 5, and 10 nm in DMEM containing 10% FBS for 72 h. Expression of MT1-MMP in the cells was analyzed by Western blotting.
FIGURE 7.
Effects of silencing of MMPs on proliferation or apoptosis induction and secretion of collagen by aHSCs. A, a WST-1 assay was carried out for cells treated with 10 nm of MMP siRNA in DMEM containing 10% FBS at day 3 of transfection using a Premix assay system. Data are expressed in percentages of aHSCs treated with siRNAGFP as mean ± S.D. of triplicate samples. **, p < 0.01 compared with siRNAGFP. B, aHSCs were treated with siRNAMT1-MMP at 10 nm in DMEM with 10% FBS for 72 h. Cell numbers were counted after they were stained with antibody against αSMA-Cy3 in 40 random fields per slide. Results are shown as mean ± S.D. of three independent experiments. *, p < 0.05; **, p < 0.01 compared with control. C, aHSCs treated with siRNAMT1-MMP for 3 and 5 days were stained for apoptosis. The apoptotic cells were counted in 40 random fields per slide. Data are the mean ± S.D. of three independent experiments. D, mouse recombinant TIMP-2 at 0.5–2.0 μg/ml were added to the culture medium of aHSCs containing 2% FBS and incubated for 48 h. Proliferation of aHSCs was quantified using the Premix WST-1 assay system, and results were expressed in percentages of cell numbers of untreated aHSCs as mean ± S.D. of six independent samples. **, p < 0.01 compared with untreated aHSCs. E, cell lysate (lane 1), culture medium (lanes 2-4), and MT1-MMP added culture medium (lanes 5-8) from aHSCs were analyzed by Western blotting with anti-collagen antibody. In the samples of lanes 3 and 4, TIMP-1 (0.2 μg/ml) and TIMP-2 (2 μg/ml) were added, respectively, and incubated for 48 h (serum-free) prior to being subjected to electrophoresis. The samples of lanes 5–7 were incubated with 20, 100, and 500 ng of MT1-MMP, respectively, for 16 h at 25 °C prior to electrophoresis. To the sample of lane 8, 500 ng of MT1-MMP and 0.4 μg of TIMP-2 were added. The arrowheads in A–D indicate peptides specifically cleaved by MT1-MMP.
Incidentally, when we examined procollagen-derived peptides in the culture medium of aHSCs by immunoblotting with collagen antibody (Fig. 7E, lanes 2–8), numerous bands that were not seen in cell lysate (Fig. 7E, lane 1) were revealed. Those designated A, B, C, and D, which became evident by addition of excess MT1-MMP to the medium (lanes 5–7) and disappeared by addition of TIMP-2 (lane 8), existed in the original medium (lanes 2, 3) and became very faint after addition of TIMP-2 (lane 4), indicating that endogenous MT1-MMP is indeed acting on procollagen secreted from aHSCs.
Effect of MT1-MMP-cleaved Collagen on the Survival of aHSCs
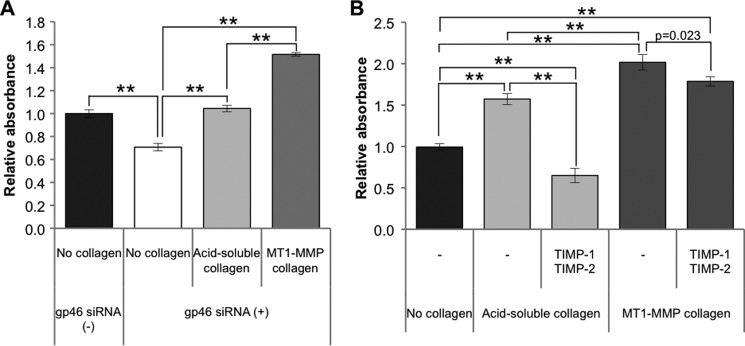
To verify the assumption that the collagen cleaved by MT1-MMP sustains aHSC survival, siRNAgp46-transfected or non-transfected aHSCs were cultured on a plate coated with an acid-soluble or MT1-MMP-cleaved collagen. The transfectants on MT1-MMP-cleaved collagen showed restoration of growth to a level greater than that of non-transfected aHSCs (Fig. 8A). The growth of transfectants on acid-soluble collagen was also restored, but to a much lesser extent than that of those on cleaved collagen. To address the possibility that the growth stimulation of acid-soluble collagen is due to the activity of MT1-MMP of aHSCs, which generates cleaved collagen from acid-soluble collagen, we added TIMP-2 to the culture medium and found significant growth suppression (Fig. 8B). By contrast, the growth suppression by TIMP-2 was very minor for MT1-MMP-cleaved collagen (Fig. 8B).
FIGURE 8.
Proliferation of siRNAgp46 aHSCs incubated with acid-soluble or MT1-MMP-cleaved collagen in the presence or absence of TIMPs. A, proliferation of siRNAgp46 aHSCs incubated with acid-soluble or MT1-MMP-cleaved collagen in DMEM containing 2% FBS was measured at day 3 of transfection by the WST-1 assay system. Data are expressed in percentages of the cell growth of control aHSCs as mean ± S.D. of triplicate samples. **, p < 0.01. B, proliferation of cells treated with TIMP-1 (100 ng/ml) and TIMP-2 (1 μg/ml) incubated with acid-soluble or MT1-MMP-cleaved collagen in serum-free DMEM was measured at day 3. Results are expressed in percentage as mean ± S.D. of three independent experiments. **, p < 0.01.
Effects of siRNA Integrins on the Growth of aHSCs
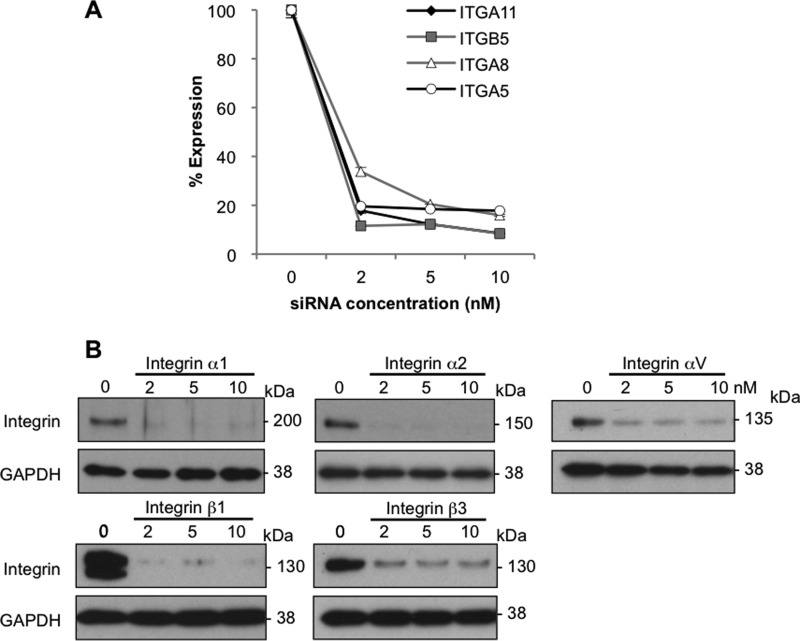
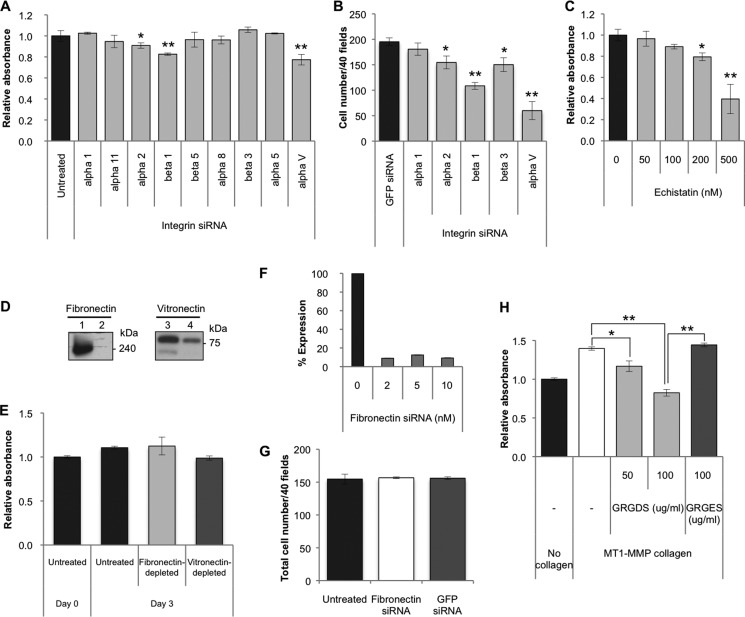
Expression profiles of integrins, known as specific receptors for collagen, interacting with the GFOGER (O = Hyp) motif, were analyzed. Among these integrins, α1, α11, α2, and β1 showed relatively high expression (supplemental Table 4). When these integrins were silenced (Fig. 9, A and B), only siRNA for one of the paired subunits of integrin, but none of the siRNAs for another subunit (counterpart of β1), was found to be relevant to the survival of aHSCs (Fig. 10A). These results indicate that the survival of aHSCs is not sustained by acid-soluble collagen. Taking into account these results and the fact that MT1-MMP-cleaved collagen is a potent growth stimulator of aHSCs, we next explored the possibility that some intramolecular motifs that become exposed on the collagen surface upon cleavage by MT1-MMP actually interact with integrin(s). In a search for amino acid sequences for ligand candidates, one of the most common motifs in extracellular matrices, RGD with sequences of DRGDA and GRGDK in collagen type I α 1 and SRGDG, GRGDG, and GRGDK in collagen type I α 2 were identified. Therefore, the expression of integrins that could interact with RGD was determined, and β5, α8, β3, α5, and αV exhibited relatively high expression (supplemental Table 4). Then these integrins were silenced with siRNAs, and αV was found to be most relevant to the survival of aHSCs, although siRNAs against α2 and β3 also caused a slight but not biologically meaningful suppression of growth (Fig. 10B). Because β1 can reportedly interact with the RGD motif in addition to GFOGER of native collagen, the pair of αV and β1 was deemed to be the most active integrin to MT1-MMP-cleaved collagen.
FIGURE 9.
Silencing effects of integrin siRNAs. A, aHSCs were treated with siRNA against integrin α11, β5, α8, and α5 at 2, 5, and 10 nm in DMEM containing 10% FBS for 48 h. The expression of integrin in those cells was quantitated by quantitative RT-PCR. B, expression of integrin in aHSCs treated with siRNA against integrin α1, α2, αV, β1, and β3 was analyzed by Western blotting.
FIGURE 10.
Effects of silencing of integrins on proliferation of aHSCs. A, a WST-1 assay was carried out for cells treated with siRNA against integrin α1, α11, α2, β1, β5, α8, β3, α5, and αV at a concentration of 5 nm in DMEM containing 2% FBS at day 3 of transfection. Data are expressed in percentages of untreated aHSCs as mean ± S.D. of six independent samples. *, p < 0.05; **, p < 0.01 compared with untreated aHSCs. B, the number of cells treated with integrin α1, α2, β1, β3, and αV siRNAs at 5 nm in DMEM containing 2% FBS was counted at day 3 of transfection after they were stained with antibody against αSMA-Cy3 in 40 random fields per slide. Data are expressed as mean ± S.D. of three independent experiments. *, p < 0.05; **, p < 0.01 compared with siRNAGFP. C, the proliferation of aHSCs treated with echistatin at 50, 100, 200, and 500 nm in serum-free DMEM for 24 h was measured by the WST-1 assay system. Data are expressed in percentages as mean ± S.D. of six independent samples. *, p < 0.05; **, p < 0.01 compared with untreated aHSCs. D, fibronectin and vitronectin in FBS were removed by gelatin-Sepharose- or heparin-packed columns, respectively. Depletion of fibronectin (lane 2) and vitronectin (lane 4) from FBS was examined by Western blotting using antibody against fibronectin and vitronectin, respectively, with control FBS (lanes 1 and 3). E, aHSC were cultured in medium containing 10% FBS from which fibronectin and vitronectin were removed. The proliferation of aHSCs was quantified using the Premix WST-1 assay system at day 3 of treatment. No significant differences were observed. Data are expressed in percentages compared with untreated samples as mean ± S.D. of triplicate samples. F, knockdown of Fibronectin was examined by quantitative RT-PCR at day 2 of transfection. G, cell numbers of aHSCs transduced with siRNAFibronectin at 10 nm in DMEM with 2% FBS at day 3 of transfection were counted after they were stained with antibody against αSMA-Cy3 in 40 random fields/slide. Data are representated as mean ± S.D. of three independent experiments. H, aHSCs in an MT1-MMP collagen-coated plate were incubated with GRGDS (50 and 100 μg/ml) or GRGES (100 μg/ml) peptides for 72 h in serum-free DMEM. A WST-1 assay was carried out, and data are expressed in percentages of cell growth of control aHSCs as mean ± S.D. of triplicate samples. *, p < 0.05; **p < 0.01.
Effect of an Inhibitory Peptide to Integrin αVβ1 on the Growth of aHSCs
To consolidate the above results, a soluble peptide, echistatin, was employed to block the function of αVβ1 integrin, and we examined its effect on the growth of aHSCs. As predicted, aHSCs cultured in the presence of this peptide showed a dose-dependent impairment of growth (Fig. 10C).
Effect of the GRGDS Peptide on the Growth of aHSCs Cultured with Collagen Cleaved by MT1-MMP
The GRGDS peptide has been used to inhibit the function of the RGD motif of extracellular matrix proteins such as fibronectin (16) and vitronectin (17). To verify that the RGD motifs of fibronectin and vitronectin in the FBS affect the growth rate of aHSCs, aHSCs were cultured in medium containing 10% FBS from which fibronectin and vitronectin were removed by gelatin-Sepharose- or heparin-packed column, respectively (Fig. 10D). No significant differences were observed in the numbers of aHSCs between those cultured in this medium and in control medium with 10% FBS (Fig. 10E). Because aHSCs express fibronectin but not vitronectin (supplemental Table 4), we examined the effect of HSC-derived fibronectin on their growth by silencing cellular fibronectin (Fig. 10F) and found that there were no significant differences in cell number between fibronectin siRNA-treated and non-treated aHSCs (Fig. 10G). Furthermore, we employed a serum-free system to examine the effect of the RGD motif of collagen but not those of fibronectin or vitronectin. As expected, in contrast to the markedly enhanced growth rate of aHSCs cultured in the absence of GRGDS on the collagen cleaved by MT1-MMP, the growth of those cells in the presence of the peptide was inhibited significantly to the lower level compared with aHSCs cultured without collagen (Fig. 10H). On the contrary, a control peptide, GRGES, did not show any inhibition.
Involvement of the PI3K/AKT/IκB Signal Transduced by the Interaction of αVβ1 with Collagen in Sustaining aHSCs Survival
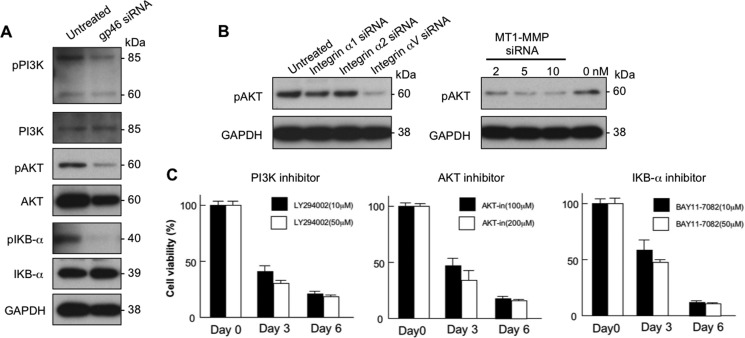
Because PI3K/AKT signals have been reported to play a role in the proliferation of aHSCs that were stimulated by platelet-derived growth factor (18) and in regulatory roles of NFκB in apoptosis of aHSCs (19), these signal molecules were examined for aHSCs treated with siRNAgp46, siRNAintegrin αV, and siRNAMT1-MMP. Although the expression of phosphorylated PI3K, AKT, and IκBα was evident in untreated aHSCs, their expression was clearly inhibited in siRNAgp46 transfectants (Fig. 11A). Treatment with siRNAintegrin αV or siRNAMT1-MMP (Fig. 11B) also plainly inhibited the expression of phospho-AKT (pAKT). The viability of aHSCs was suppressed dose-dependently by inhibitors to PI3K, AKT, and IκBα (Fig 11C), indicating that these signal molecules are essential for the survival of aHSCs in relation to collagen cleaved by its own MT1-MMP.
FIGURE 11.
Molecular transduction survival signal of aHSCs. A, aHSCs treated with or without 10 nm of siRNAgp46 in DMEM containing 2% FBS for 3 days were examined for expression of PI3K, AKT, and IκB-α and their phosphorylated forms (pPI3K, pAKT, and pIκBα) by Western blotting. B, the effect of treatment of 5 nm of integrin siRNA and 2, 5, and 10 nm of siRNAMT1-MMP on phosphorylation of AKT of aHSCs was analyzed by Western blotting at day 3. C, the viability of aHSCs treated with inhibitors to PI3K, AKT, and IκB-α was analyzed on days 0, 3, and 6 by the WST-1 assay system. Data are expressed in percentages of cell viability compared with untreated aHSCs and as mean ± S.D. of triplicate samples.
DISCUSSION
The concept of “oncogene addiction” has recently been proposed (20). Tumor cells expressing oncogenes that play an essential role as drivers for progression readily undergo apoptosis when the activity of an oncogene is inhibited. In this study, we disclose a similar growth “dependence” of aHSCs to self-collagen on the basis of the fact that the growth of aHSCs was suppressed significantly by the inhibition of collagen secretion using siRNAgp46 treatment, whereas qHSCs were insensitive to this treatment.
The impaired growth of siRNAgp46-treated aHSCs was reflected by the transient appearance of cells undergoing autophagy and subsequent increments of apoptotic cells. This observation is compatible with results showing that PI3K/AKT/IκB is the collagen-induced survival signal of aHSCs because PI3K/AKT is the common upstream signal for autophagy and apoptosis, and IκB switches autophagy to apoptosis (21).
We suggest that the foremost novel finding in this study is the observed involvement of MT1-MMP in the survival of aHSCs. This was confirmed directly by the growth suppression of aHSCs with treatment of siRNAMT1-MMP (Fig. 7, A and B) and indirectly by the effect of an MT1-MMP inhibitor, TIMP-2, that also suppressed the growth of aHSCs. Another interstitial collagenase besides MT1-MMP in aHSCs is MMP13. However, the MMP13 in aHSCs is expressed only transiently at early stages of liver damage, whereas the activity of MT1-MMP is maintained throughout every stage (4). Therefore, it may be reasonable to deduce that MT1-MMP-cleaved collagen secreted from aHSCs is essential for the survival of those cells in the fibrotic liver.
Among various MMPs, other than MT1-MMP and MMP13, that showed a relatively high expression in aHSCs, only MMP2, a gelatinase, exhibited relevance to the survival of aHSCs (although the effect was inconsequential compared with that of MT1-MMP in suppression of growth). The growth-suppressive effect of MMP2 was also noted by Iredale et al. (10), who concluded that the effect may be ascribed to the cleavage of N-cadherin on aHSC membranes. However, our proposal for the mechanism of the growth suppression by MMP2 is that MMP2 degrades the survival substance of partially cleaved collagen generated by MT1-MMP (Fig. 12). This is consistent with results showing that addition of TIMP-1, which supposedly inhibits MMP-2, to siRNAgp46-treated aHSCs restored their impaired growth. Conversely, siRNATIMP-1 suppressed the growth of aHSCs.
FIGURE 12.
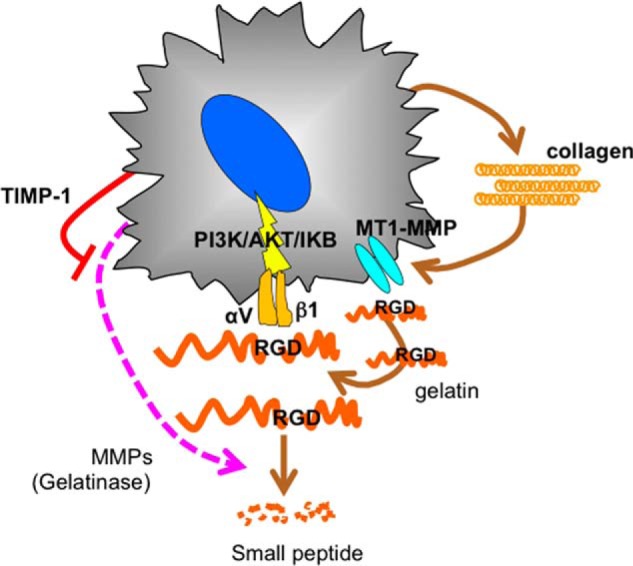
Schematic of the autocrine loop of aHSC for survival. aHSCs become dependent on collagen, which is cleaved by its own MT1-MMP, exposing the internal RGD motif and interacting with integrin αVβ1, thereby transducing the survival signal of PI3K/AKT/IκB.
Previous reports of the antiapoptotic effects of TIMP-1 on aHSCs (8), the proapoptotic effect of siRNATIMP-1 on aHSCs (22), the retarded resolution of liver fibrosis in carbon tetrachloride-treated TIMP-1 transgenic mice (7), and the inhibition of hepatic fibrosis by mutant MMP-9, which inhibits TIMP-1 activity (23), may also be rationalized by the notion that MMP-2 degrades the survival substance for aHSCs.
With respect to the role of half-denatured collagen as a bona fide factor for the survival of aHSCs, compatible observations have been reported previously. Zhou et al. (24) disclosed that artificially cross-linked collagen and collagenase-resistant collagen (r/r collagen) showed reduced growth-stimulatory activity compared with that of MMP-sensitive collagen. The same group reported that the mutation in collagen 1 that confers resistance to the action of collagenase resulted in failure of recovery from carbon tetrachloride-induced liver fibrosis because of the persistence of aHSCs (9). However, in those reports, the involvement of MT1-MMP in the generation of a growth-stimulatory substance for aHSCs was not described.
In this study, we further show that RGD motifs of collagen are the actual components responsible for the growth promotion of aHSCs. Similarly, RGD motifs are found in fibronectin and vitronectin of extracellular matrix. When aHSCs were cultured in fibronectin- or vitronectin-depleted medium, no growth impairment was observed (Fig. 10E) because plasma fibronectin possesses a structure distinct from the cellular type where the exposure of the RGD motif is not induced (25, 26). In addition, aHSCs express fibronectin but not vitronectin, although the expression levels in aHSCs are substantially lower compared with those of collagen (supplemental Table 4). Therefore, we examined the effects of fibronectin from aHSCs in which some portion consisted of a non-functional plasma type (27). No significant differences were observed in cell number between fibronectin siRNA-treated and untreated aHSCs (Fig. 10G), indicating that the role of plasma and cellular fibronectin as a supplier of the RGD motif for aHSC survival is minor compared with that of collagen. In addition, the integrin subunits for fibronectin, α3β1, α5β1, and αVβ3, and for vitronectin, αVβ3 and αVβ5, are different from those for MT1-MMP-cleaved collagen, αVβ1. Thus, the involvement of fibronectin and/or vitronectin in the survival of aHSCs is less likely.
In accordance with our results, the involvement of integrin αVβ3 in the survival of aHSCs has been reported previously (15), although its relevance to the RGD motif of collagen is newly disclosed in this study. There are several reports regarding the role of integrin αVβ1 (28) and the activity of MT1-MMP (29) in endothelial tubulogenesis and tumor progression. It may be worthwhile to determine whether similar schemes to those proposed here regarding the cooperative functions of αVβ1 and MT1-MMP in cell survival are applicable to the modulation of fibrosis of other tissues.
In summary, collagen cleaved by MT1-MMP was found to play a key role in aHSC survival by supplying an exposed RGD motif on its surface to αVβ1, which transduces survival signals upon the interaction with RGD (Fig. 12). Therefore, strategies to block this autocrine loop could have the potential to be antifibrosis modalities.
Supplementary Material
Acknowledgments
We thank Drs. Motoharu Seiki and Naohiko Koshigawa (Institute of Medical Science, The University of Tokyo) for discussions and suggestions regarding this study. We also thank Fumiko Shimizu and Koki Otaki for technical assistance.

This article contains supplemental Tables 1–4.
The nucleotide sequence(s) reported in this paper has been submitted to the DDBJ/GenBankTM/EBI Data Bank with accession number(s) E-MTAB-2081.
- HSC
- hepatic stellate cell
- MT1-MMP
- membrane type 1 metalloproteinase
- TIMP
- tissue inhibitor(s) of metalloproteinase
- aHSC
- activated hepatic stellate cell
- VA-lip
- vitamin A-coupled liposome
- αSMA
- α-smooth muscle actin
- GFAP
- glial fibrillary acidic protein
- qHSC
- quiescent hepatic stellate cell
- DMN
- dimethylnitrosamine.
REFERENCES
- 1. Zhao L., Burt A. D. (2007) The diffuse stellate cell system. J. Mol. Histol. 38, 53–64 [DOI] [PubMed] [Google Scholar]
- 2. Boulter L., Govaere O., Bird T. G., Radulescu S., Ramachandran P., Pellicoro A., Ridgway R. A., Seo S. S., Spee B., Van Rooijen N., Sansom O. J., Iredale J. P., Lowell S., Roskams T., Forbes S. J. (2012) Macrophage-derived Wnt opposes Notch signaling to specify hepatic progenitor cell fate in chronic liver disease. Nat. Med. 18, 572–579 [DOI] [PMC free article] [PubMed] [Google Scholar]
- 3. Yin C., Evason K. J., Asahina K., Stainier D. Y. (2013) Hepatic stellate cells in liver development, regeneration, and cancer. J. Clin. Invest. 123, 1902–1910 [DOI] [PMC free article] [PubMed] [Google Scholar]
- 4. Hemmann S., Graf J., Roderfeld M., Roeb E. (2007) Expression of MMPs and TIMPs in liver fibrosis: a systematic review with special emphasis on anti-fibrotic strategies. J. Hepatol. 46, 955–975 [DOI] [PubMed] [Google Scholar]
- 5. Iredale J. P., Benyon R. C., Pickering J., McCullen M., Northrop M., Pawley S., Hovell C., Arthur M. J. (1998) Mechanisms of spontaneous resolution of rat liver fibrosis. Hepatic stellate cell apoptosis and reduced hepatic expression of metalloproteinase inhibitors. J. Clin. Invest. 102, 538–549 [DOI] [PMC free article] [PubMed] [Google Scholar]
- 6. Troeger J. S., Mederacke I., Gwak G. Y., Dapito D. H., Mu X., Hsu C. C., Pradere J. P., Friedman R. A., Schwabe R. F. (2012) Deactivation of hepatic stellate cells during liver fibrosis resolution in mice. Gastroenterology 143, 1073–1083 [DOI] [PMC free article] [PubMed] [Google Scholar]
- 7. Yoshiji H., Kuriyama S., Yoshii J., Ikenaka Y., Noguchi R., Nakatani T., Tsujinoue H., Yanase K., Namisaki T., Imazu H., Fukui H. (2002) Tissue inhibitor of metalloproteinases-1 attenuates spontaneous liver fibrosis resolution in the transgenic mouse. Hepatology 36, 850–860 [DOI] [PubMed] [Google Scholar]
- 8. Murphy F. R., Issa R., Zhou X., Ratnarajah S., Nagase H., Arthur M. J., Benyon C., Iredale J. P. (2002) Inhibition of apoptosis of activated hepatic stellate cells by tissue inhibitor of metalloproteinase-1 is mediated via effects on matrix metalloproteinase inhibition: implications for reversibility of liver fibrosis. J. Biol. Chem. 277, 11069–11076 [DOI] [PubMed] [Google Scholar]
- 9. Issa R., Zhou X., Trim N., Millward-Sadler H., Krane S., Benyon C., Iredale J. (2003) Mutation in collagen-1 that confers resistance to the action of collagenase results in failure of recovery from CCl4-induced liver fibrosis, persistence of activated hepatic stellate cells, and diminished hepatocyte regeneration. FASEB J. 7, 47–49 [DOI] [PubMed] [Google Scholar]
- 10. Hartland S. N., Murphy F., Aucott R. L., Abergel A., Zhou X., Waung J., Patel N., Bradshaw C., Collins J., Mann D., Benyon R. C., Iredale J. P. (2009) Active matrix metalloproteinase-2 promotes apoptosis of hepatic stellate cells via the cleavage of cellular N-cadherin. Liver Int. 29, 966–978 [DOI] [PubMed] [Google Scholar]
- 11. Sato Y., Murase K., Kato J., Kobune M., Sato T., Kawano Y., Takimoto R., Takada K., Miyanishi K., Matsunaga T., Takayama T., Niitsu Y. (2008) Resolution of liver cirrhosis using vitamin A-coupled liposomes to deliver siRNA against a collagen-specific chaperone. Nat. Biotechnol. 26, 431–442 [DOI] [PubMed] [Google Scholar]
- 12. Ishiwatari H., Sato Y., Murase K., Yoneda A., Fujita R., Nishita H., Birukawa N. K., Hayashi T., Sato T., Miyanishi K., Takimoto R., Kobune M., Ota S., Kimura Y., Hirata K., Kato J., Niitsu Y. (2013) Treatment of pancreatic fibrosis with siRNA against a collagen-specific chaperone in vitamin A-coupled liposomes. Gut 62, 1328–1339 [DOI] [PubMed] [Google Scholar]
- 13. Friedman S. L. (1993) Seminars in medicine of the Beth Israel Hospital, Boston: the cellular basis of hepatic fibrosis: mechanisms and treatment strategies. N. Engl. J. Med. 328, 1828–1835 [DOI] [PubMed] [Google Scholar]
- 14. Chiba H., Sakai N., Murata M., Osanai M., Ninomiya T., Kojima T., Sawada N. (2006) The nuclear receptor hepatocyte nuclear factor 4α acts as a morphogen to induce the formation of microvilli. J. Cell Biol. 175, 971–980 [DOI] [PMC free article] [PubMed] [Google Scholar]
- 15. Zhou X., Murphy F. R., Gehdu N., Zhang J., Iredale J. P., Benyon R. C. (2004) Engagement of αvβ3 integrin regulates proliferation and apoptosis of hepatic stellate cells. J. Biol. Chem. 279, 23996–24006 [DOI] [PubMed] [Google Scholar]
- 16. Rodríguez-Juan C., de la Torre P., García-Ruiz I., Díaz-Sanjuán T., Muñoz-Yagüe T., Gómez-Izquierdo E., Solís-Muñoz P., Solís-Herruzo J. A. (2009) Fibronectin increases survival of rat hepatic stellate cells: a novel profibrogenic mechanism of fibronectin. Cell Physiol. Biochem. 24, 271–282 [DOI] [PubMed] [Google Scholar]
- 17. Sheu J. B., Ko W. C., Hung W. C., Peng H. C., Huang T. F. (1997) Interaction of thrombin-activated platelets with extracellular matrices (fibronectin and vitronectin): comparison of the activity of Arg-Gly-Asp-containing venom peptides and monoclonal antibodies against glycoprotein IIb/IIIa complex. J. Pharm. Pharmacol. 49, 78–84 [DOI] [PubMed] [Google Scholar]
- 18. Reif S., Lang A., Lindquist J. N., Yata Y., Gabele E., Scanga A., Brenner D. A., Rippe R. A. (2003) The role of focal adhesion kinase-phosphatidylinositol 3-kinase-akt signaling in hepatic stellate cell proliferation and type I collagen expression. J. Biol. Chem. 278, 8083–8090 [DOI] [PubMed] [Google Scholar]
- 19. Oakley F., Meso M., Iredale J. P., Green K., Marek C. J., Zhou X., May M. J., Millward-Sadler H., Wright M. C., Mann D. A. (2005) Inhibition of inhibitor of κB kinases stimulates hepatic stellate cell apoptosis and accelerated recovery from rat liver fibrosis. Gastroenterology 128, 108–120 [DOI] [PubMed] [Google Scholar]
- 20. Weinstein I. B., Joe A. K. (2006) Mechanisms of disease: oncogene addiction: a rationale for molecular targeting in cancer therapy. Nat. Clin. Pract. Oncol. 3, 448–457 [DOI] [PubMed] [Google Scholar]
- 21. Jiang Q., Wang Y., Li T., Shi K., Li Z., Ma Y., Li F., Luo H., Yang Y., Xu C. (2011) Heat shock protein 90-mediated inactivation of nuclear factor-κB switches autophagy to apoptosis through becn1 transcriptional inhibition in selenite-induced NB4 cells. Mol. Biol. Cell 22, 1167–1180 [DOI] [PMC free article] [PubMed] [Google Scholar]
- 22. Fowell A. J., Collins J. E., Duncombe D. R., Pickering J. A., Rosenberg W. M., Benyon R. C. (2011) Silencing tissue inhibitors of metalloproteinases (TIMPs) with short interfering RNA reveals a role for TIMP-1 in hepatic stellate cell proliferation. Biochem. Biophys. Res. Commun. 407, 277–282 [DOI] [PubMed] [Google Scholar]
- 23. Roderfeld M., Weiskirchen R., Wagner S., Berres M. L., Henkel C., Grötzinger J., Gressner A. M., Matern S., Roeb E. (2006) Inhibition of hepatic fibrogenesis by matrix metalloproteinase-9 mutants in mice. FASEB J. 20, 444–454 [DOI] [PubMed] [Google Scholar]
- 24. Zhou X., Jamil A., Nash A., Chan J., Trim N., Iredale J. P., Benyon R. C. (2006) Impaired proteolysis of collagen I inhibits proliferation of hepatic stellate cells: implications for regulation of liver fibrosis. J. Biol. Chem. 281, 39757–39765 [DOI] [PubMed] [Google Scholar]
- 25. To W. S., Midwood K. S. (2011) Plasma and cellular fibronectin: distinct and independent functions during tissue repair. Fibrogenesis Tissue Repair 4, 21. [DOI] [PMC free article] [PubMed] [Google Scholar]
- 26. Manabe R., Ohe N., Maeda T., Fukuda T., Sekiguchi K. (1997) Modulation of cell-adhesive activity of fibronectin by the alternatively spliced EDA segment. J. Cell Biol. 139, 295–307 [DOI] [PMC free article] [PubMed] [Google Scholar]
- 27. Xu G., Niki T., Virtanen I., Rogiers V., De Bleser P., Geerts A. (1997) Gene expression and synthesis of fibronectin isoforms in rat hepatic stellate cells: comparison with liver parenchymal cells and skin fibroblasts. J. Pathol. 183, 90–98 [DOI] [PubMed] [Google Scholar]
- 28. Katoh D., Nagaharu K., Shimojo N., Hanamura N., Yamashita M., Kozuka Y., Imanaka-Yoshida K., Yoshida T. (2013) Binding of αvβ1 and αvβ6 integrins to tenascin-C induces epithelial-mesenchymal transition-like change of breast cancer cells. Oncogenesis 2, e65. [DOI] [PMC free article] [PubMed] [Google Scholar]
- 29. Itoh Y., Seiki M. (2006) MT1-MMP: a potent modifier of pericellular microenvironment. J. Cell. Physiol. 206, 1–8 [DOI] [PubMed] [Google Scholar]
Associated Data
This section collects any data citations, data availability statements, or supplementary materials included in this article.


