

Summary
Mapping of metaQTL controlling leaf senescence and seed resource allocation in Arabidopsis reveals that leaf senescence might disrupt the general negative correlation observed between yield and seed nitrogen concentration.
Key words: Leaf senescence, nitrogen and carbon allocation, harvest index, yield, flowering time.
Abstract
Sequential and monocarpic senescence are observed at vegetative and reproductive stages, respectively. Both facilitate nitrogen (N) remobilization and control the duration of carbon (C) fixation. Genetic and environmental factors control N and C resource allocation to seeds. Studies of natural variation in Arabidopsis thaliana revealed differences between accessions for leaf senescence phenotypes, seed N and C contents, and N remobilization efficiency-related traits. Here, a quantitative genetics approach was used to gain a better understanding of seed filling regulation in relation to leaf senescence and resource allocation. For that purpose, three Arabidopsis recombinant inbred line populations (Ct-1×Col-0, Cvi-0×Col-0, Bur-0×Col-0) were used to map QTL (quantitative trait loci) for ten traits related to senescence, resource allocation, and seed filling. The use of common markers across the three different maps allowed direct comparisons of the positions of the detected QTL in a single consensus map. QTL meta-analysis was then used to identify interesting regions (metaQTL) where QTL for several traits co-localized. MetaQTL were compared with positions of candidate genes known to be involved in senescence processes and flowering time. Finally, investigation of the correlation between yield and seed N concentration in the three populations suggests that leaf senescence disrupts the negative correlation generally observed between these two traits.
Introduction
As the last stage of leaf development, senescence is mainly characterized by the loss of green pigments, chloroplast degradation, and reduced protein content in leaves. Nutrient transport from senescing leaves to the surviving structures is known as nutrient remobilization. Because both a decrease in photosynthesis and nutrient remobilization occurs in leaves at this developmental stage, leaf senescence has a strong impact on important agronomical traits such as seed yield, as well as seed protein and lipid contents. For this reason, leaf senescence has been widely studied in plants, especially crops, for a long time (Thomas and Stoddart, 1980). Studies showing an association between senescence and crop productivity are numerous and were reviewed recently by Gregersen et al. (2013). Selection and breeding of plants showing delayed senescence in the field, especially when water is limited during the post-anthesis period, have been largely undertaken with the aim to increase grain yield (Borrell et al., 2000). However, the negative relationship between grain protein content and yield that was reported in various cereals suggests that delaying leaf senescence to increase grain yield has a negative effect on grain protein content (Simmonds, 1995; Oury and Godin, 2007; Blanco et al., 2012). To date, the relationship between leaf senescence, and yield or grain protein content has been studied mainly in cereals, such as maize, wheat, rice, or barley. There are almost no reports on dicots, with the exception of a few studies on rapeseed, cowpea, and soybean (Abu-Shakra et al., 1978; Ismail et al., 2000; Hunkovà et al., 2011).
Leaf senescence is not a passive decay. Its initiation, the duration of its execution phase, and the onset of its terminal phase, which ends with death, are regulated through tight genetic control. Factors influencing the different senescent phases are numerous and they are both endogenous and exogenous. It is known, for example, that leaf senescence is accelerated under mild stress conditions such as a lack of fertilization or an excess of shading. Plant hormones also play a role, delaying senescence in the case of cytokinins (Gan and Amasino, 1997; Zavaleta-Mancera et al., 1999) or inducing premature senescence as triggered by ethylene treatments (Grbic and Bleecker, 1996; Schippers et al., 2007).
The transcription factors involved in controlling leaf senescence have been extensively investigated and several members of the NAC (NAM, NO APICAL MERISTEM; ATAF1/2, ARABIDOPSIS TRANSCRIPTION ACTIVATION FACTOR 1/2; CUC2, CUP-SHAPED COTYLEDON 2) and WRKY families have been identified for their roles in leaf senescence (Fischer, 2012 for a review). WRKY53 is the best understood senescence-related WRKY, and interaction of the WRKY53 promoter with the MEKK1 kinase suggests that the WRKY53 signalling pathway cascade integrates both senescence and stress responses (Miao et al., 2004; Miao et al., 2008; Zentgraf et al., 2010). Among the long list of NAC transcription factors involved in plant senescence (Olsen et al., 2005), the wheat (Triticum turgidum ssp. durum) NAC gene termed TtNAM-B1 was found through an extensive QTL (quantitative trait loci) study of cereal grain protein content (Uauy et al., 2006). The transcript level of TtNAM-B1 was shown to increase in flag leaves during senescence, and gene silencing of TtNAM-B1 in wheat led to plants with both a stay-green phenotype and lower grain protein content. One of the Arabidopsis homologues of TtNAM-B1, AtNAP (ANAC029), is also induced during leaf senescence (Guo and Gan, 2006). However the role of AtNAP in grain filling and yield has not yet been described in Arabidopsis. Besides AtNAP, other NAC genes such as AtNAC2 (or ANAC092 also known as ORE1, ORESARA 1 which means long-living in Korean) have been reported to play a role in the control of leaf senescence (Kim et al., 2009; Balazadeh et al., 2010). Studies of ORE1 provided the first evidence of epigenetic control of leaf senescence by microRNA. Indeed, MiR164b influences ORE1 transcript levels (Kim et al., 2009). Other epigenetic and posttranscriptional mechanisms regulating leaf senescence (Tian and Chen, 2001; Ay et al., 2009) show the complexity of the regulatory pathways involved.
With the large number of factors and signals influencing leaf senescence, we have decided to investigate leaf senescence traits using quantitative genetics approaches (Diaz et al., 2006; Wingler et al., 2010). In our laboratory, studies on the natural variation of leaf senescence and nitrogen remobilization traits led us to consider the links between nitrogen use efficiency traits, yield, plant biomass, and leaf senescence events before and after flowering in Arabidopsis (Diaz et al., 2005; Diaz et al., 2006; Masclaux-Daubresse and Chardon, 2011). Diaz et al. (2006) showed that leaf senescence observed at the early vegetative developmental stage was positively correlated with amino acid content in the rosette and negatively with rosette dry weight. This result was the first evidence of a negative link between plant biomass and leaf senescence before flowering in Arabidopsis. Further studies using a set of five recombinant inbred lines (RILs) of the Bay-0×Shahdara population confirmed that differential leaf senescence was associated with differential biomass and amino acid content (Diaz et al., 2005). Using 15N-tracing experiments, Diaz et al. (2008) demonstrated that the severity of leaf senescence symptoms is positively correlated with 15N remobilization efficiency at the vegetative stage. In contrast, a later study of 19 Arabidopsis accessions at the reproductive stage (Masclaux-Daubresse and Chardon, 2011) showed that there is no link between leaf senescence scores and the efficiency of nitrogen remobilization to seeds even though nitrogen-remobilization efficiency correlated strongly with the harvest index.
Previous studies on natural variation of Arabidopsis thaliana have also revealed differences between accessions for leaf senescence phenotypes (Balazadeh et al., 2008) as well as for N remobilization efficiency-related traits and yield (Masclaux-Daubresse and Chardon, 2011). However the information obtained on RILs or accessions were fragmentary and sometimes contradictory.
The aim of the present study was to investigate the links between leaf senescence, yield, and seed filling in Arabidopsis to determine whether, as seems to be the case in crops, traits are linked and controlled by some common genetic basis. We used three Arabidopsis recombinant inbred line populations optimized for QTL mapping, with Col-0 as a common parent (Simon et al., 2008), to map QTL for traits related to senescence, resource allocation, and seed yield. These populations were chosen as the parental lines display contrasting leaf senescence phenotypes (Balazadeh et al., 2008), and/or N remobilization efficiencies (Masclaux-Daubresse and Chardon, 2011). The use of common markers across the three different maps facilitated QTL meta-analysis approaches (Chardon et al., 2004; Sosnowski et al., 2012) leading to the identification of the most interesting regions where QTL co-localize. MetaQTL and candidate gene positions are discussed. Finally, the relationship between seed N concentrations and yield regarding leaf senescence is analysed in Arabidopsis.
Materials and methods
Plant material and growth conditions
A subset of 154 RILs from the Ct-1×Col-0 population, 164 RILs from the Cvi-0×Col-0 population, and 164 RILs from the Bur-0×Col-0 population (Simon et al., 2008), in addition to the four parental lines (Ct-1, Cvi-0, Bur-0, and Col-0) were used in this study. The three accessions crossed to Col-0 were rationally chosen from a core collection that was previously defined to maximize the genetic and phenotypic diversity in a reduced number of accessions (McKhann et al. 2004). Seeds were obtained from the Versailles Biological Resource Centre for Arabidopsis (http://publiclines.versailles.inra.fr/). Seeds were sown on damp Whatman filters, stratified for three d at 4 °C and then transferred to a growth cabinet under long-day conditions at 21 °C for 2 d. Three seedlings (with emerging radicle) per genotype were planted in soil in 7-cm pots and transferred to a non-heated and naturally lit greenhouse to be vernalized from November 2010 to February 2011 (mean temperature was 5.5 °C). After eight weeks, one plantlet per pot was randomly retained without phenotype selection. After 12 weeks of vernalization, plants were transferred to a growth chamber under long-day conditions (16/8h photoperiod at 150 mmol photons m–2 s–1); 21 °C day temperature and 18 °C night temperature; relative humidity of 65%. From this time, three times a week the plant trays were moved around the growth chamber to reduce position effects. The plants were no longer watered once the oldest siliques had turned yellow. At this stage, bags were put over the plants to prevent seed dispersion. Plants were kept in the growth chamber until dry and then harvested. Three replicates were grown for each RIL and ten for the parental lines.
Seed composition analyses (Seed C% and Seed N%)
Near-infrared spectroscopy was used to determine the seed composition. Spectra were acquired on approximately 100mg of intact seeds with a Fourier transform near-infrared (FTNIR) analyser (Antaris II spectrometer; Thermofisher Scientific, France). Seed carbon and nitrogen concentrations were estimated using developed NIRS calibration models.
Statistical analyses
Statistical analyses of traits were carried out on the mean of three replicates using XLSTAT (http://www.xlstat.com). Correlation coefficients were calculated using Pearson’s correlations. The coefficient of variation (CV) was computed as the ratio of the standard deviation to the mean.
QTL detection
Composite interval mapping was carried out using the R/QTL library in the R environment (Arends et al., 2010). A backward regression method was used for the genome scan. To identify an accurate significance threshold for each trait, an empirical threshold was determined using 1000 permutations (Churchill and Doerge, 1994). QTL positions were assigned to relevant regions at the point of the maximum likelihood odds ratio (LOD). QTL confidence intervals (CI) were calculated by 1.5 LOD drop from the maximum LOD position.
Map projection and QTL meta-analyses
Meta-analysis was performed to combine QTL information from independent experiments and refine chromosomal intervals when all collected QTL were projected onto the consensus map. For the same chromosome across multiple populations, a consensus map was constructed from the three population maps using BioMercator version 3.0 software (Sosnowski et al., 2012) as described by Arcade et al. (2004). All QTL identified for the ten traits in individual populations using R/QTL were projected onto the consensus map separately. Information on the original chromosomal position, confidence interval (CI), and proportion of phenotypic variance (R 2) explained by each QTL (as summarized in Supplementary Table S1 available at JXB online) were used for the projection. For each chromosome, meta-analysis was used to estimate the number, positions, and 95% confidence interval of the metaQTL using BioMercator version 3.0 software (Sosnowski et al., 2012). The meta-analysis first determines the best model based on the following criteria: AIC (Akaike information criterion), AICc, AIC3, BIC (Bayesian information criterion), and AWE (average weight of evidence). The best QTL model was selected when values of the model selection criteria were the lowest in at least three of the five models. Consensus QTL from the optimum model are regarded as metaQTL. The effect of metaQTL in each original population was estimated by the phenotypic difference between the two genotypes at the marker closest to the metaQTL.
Results
Analysis of ten traits related to leaf senescence and resource allocation in three Arabidopsis RIL populations and the corresponding parental accessions
Ten traits were measured or computed from measured traits to characterize leaf senescence and resource allocation (Table 1) in three RIL populations (Ct-1×Col-0, Cvi-0×Col-0, Bur-0×Col-0) and the corresponding parental accessions. The harvest index (HI, the ratio between seed dry weight and total plant dry weight [Seeds + Stem + Rosette]) is commonly used to estimate grain productivity per plant. Here, we defined the RV ratio (the ratio between reproductive organ weight [Stem + Seeds] and vegetative organ weight [Rosette]) as an indicator of the partition of biomass produced before and after flowering. The parental lines were highly contrasted for most of the studied traits, and Col-0 showed an intermediate phenotype within the range of the three others accessions (Table 2). The Ct-1 accession was characterized by earlier leaf senescence compared with the other three accessions. At harvest, the biomass before flowering of Cvi-0 and Ct-1 was lower than that of Col-0 and Bur-0, with earlier flowering time (FT) as well as a higher HI and RV. Cvi-0 seeds had low carbon content (Seed C%) and high nitrogen content (Seed N%) compared with the other three accessions. All ten traits showed continuous variation in the three RIL populations. Transgressive segregation in both directions was recorded for most of the traits, indicating the presence of favourable alleles in both parents (see Mean, Max, and Min values of RILs in Table 2). The three studied populations also showed different ranges of variation for the ten traits. For example, variation in leaf senescence scores was widespread in the Ct-1×Col-0 population, whereas in the Bur-0×Col-0 population it was low, and in the Cvi-0×Col-0 population no yellow leaves were observed for most of lines (Table 2; Fig. 1 A–C). The CVs were all very high, with 68–143% for leaf senescence, highlighting the huge phenotypic variation in the populations. CVs were higher for leaf senescence, Rosette, Stem, Seeds, RV, FT, and Seed N% in the Cvi-0×Col-0 population, but higher for HI, TGW, and Seed C% in the Bur-0×Col-0 population.
Table 1.
Measured or computed traits
| Trait name | Kind | Phenotyping scoring |
|---|---|---|
| Leaf senescence | Measured | Scores of leaf senescence before flowering time by visual phenotyping of leaf yellowing, from score 0: fully green plants to score 4: yellow rosette (Diaz et al. 2006) |
| Flowering time | Measured | Number of d following stratification to opening of first flower |
| Rosette | Measured | Dry rosette weight at harvest (mg/plant) |
| Stem | Measured | Inflorescence dry weight measured as the weight of stem and silique envelopes at harvest (mg/plant) |
| Seeds | Measured | Seed yield measured as the weight of all dry seeds (mg/plant) |
| HI | Computed | Ratio between Seeds and total plant dry weight (Seeds + Stem + Rosette) |
| RV | Computed | Ratio between reproductive organ weight (Stem + Seeds) and vegetative organ weight (Rosette) |
| Seed C% | Measured | Carbon percentage (g. (100g dry matter)–1) in seeds estimated by NIRS |
| Seed N% | Measured | Nitrogen percentage (g. (100g dry matter)–1) in seeds estimated by NIRS |
| TGW | Measured | Thousand grain (seed) weight (mg/plant) |
Table 2.
Descriptive statistics of traits in the three RIL populations and the parental lines
For each RIL population, mean and SD of each trait is calculated from all the RILs including three plant repeats per RIL.
| Traits1 | RIL populations | Parental lines | ||||||||||||||||||||
|---|---|---|---|---|---|---|---|---|---|---|---|---|---|---|---|---|---|---|---|---|---|---|
| Ct-1×Col-0 | Cvi-0×Col-0 | Bur-0×Col-0 | ||||||||||||||||||||
| Mean | Min | Max | SD | CV | Mean | Min | Max | SD | CV | Mean | Min | Max | SD | CV | Col-0 | Ct-1 | Cvi-0 | Bur-0 | ||||
| Leaf senescence | 1.4 | 0 | 4 | 1.11 | 0.79 | 0.5 | 0 | 3 | 0.73 | 1.43 | 1.0 | 0 | 2 | 0.66 | 0.68 | 0.3 | 1.6 | 0.0 | 0.6 | |||
| Rosette | 265 | 65 | 533 | 87 | 0.33 | 205 | 31 | 608 | 131 | 0.64 | 411 | 57 | 799 | 120 | 0.29 | 377 | 188 | 41 | 405 | |||
| Stem | 2128 | 908 | 3199 | 479 | 0.23 | 1617 | 631 | 2809 | 465 | 0.29 | 2347 | 877 | 3576 | 432 | 0.18 | 2302 | 1883 | 576 | 2546 | |||
| Seeds | 1454 | 614 | 2241 | 339 | 0.23 | 1056 | 326 | 1888 | 334 | 0.32 | 1243 | 78 | 1874 | 367 | 0.30 | 1583 | 1570 | 465 | 1412 | |||
| HI | 0.38 | 0.22 | 0.43 | 0.03 | 0.09 | 0.37 | 0.24 | 0.43 | 0.04 | 0.10 | 0.30 | 0.05 | 0.43 | 0.07 | 0.23 | 0.38 | 0.44 | 0.45 | 0.34 | |||
| RV | 14.8 | 7.3 | 31.2 | 4.19 | 0.28 | 17.8 | 5.9 | 48.6 | 8.67 | 0.49 | 9.5 | 4.8 | 31.0 | 3.05 | 0.32 | 10.4 | 18.8 | 27.1 | 9.9 | |||
| FT | 21.0 | 16 | 35.7 | 3.01 | 0.14 | 15.4 | 5 | 40.0 | 7.15 | 0.46 | 28.3 | 21 | 42.0 | 2.93 | 0.10 | 23.9 | 16 | 7 | 27.4 | |||
| TGW | 19 | 16 | 25 | 2 | 0.08 | 23 | 16 | 30 | 3 | 0.14 | 24 | 15 | 37 | 4 | 0.15 | 17 | 20 | 27 | 27 | |||
| Seed C% | 58.0 | 56.2 | 59.4 | 0.58 | 0.01 | 56.5 | 53.8 | 58.5 | 0.84 | 0.01 | 57.2 | 54.7 | 59.4 | 0.83 | 0.01 | 57.2 | 58.8 | 56.3 | 57.3 | |||
| Seed N% | 4.00 | 3.58 | 4.65 | 0.17 | 0.04 | 4.59 | 3.82 | 5.48 | 0.30 | 0.06 | 4.26 | 3.69 | 4.78 | 0.21 | 0.05 | 4.15 | 3.89 | 4.87 | 4.45 | |||
1Traits are described in Table 1. HI, harvest index; RV, ratio between reproductive and vegetative organ weights; FT, flowering time; TGW, thousand grain weight. Min: minimal value of the trait in the population; Max: maximal value of the trait in the population; SD: standard deviation; CV: coefficient of variation. For parental lines, only means are shown (n=10).
Fig. 1.

Phenotypic variation and corresponding QTL mapping for leaf senescence in the three RIL populations, Ct-1×Col-0 (A, D), Cvi-0×Col-0 (B, E), and Bur-0×Col-0 (C, F). (A–C) Distribution of RILs among the five classes of senescence, from score 0 for fully green plants to score 4 for yellow rosettes, in the three RIL populations. (D–F) QTL mapping for leaf senescence. LOD score curves for the five chromosomes are shown. Each peak above the threshold (dashed line corresponding to 2.3 LOD) identifies a QTL.
Genetic correlation between leaf senescence and resource allocation traits was observed in the three populations
In the three populations, Rosette, Stem, and Seeds were strongly and positively correlated with each other (Table 3), showing that the variation in plant biomass between RILs is uniformly distributed among the three organs. The HI was highly positively correlated to Seeds showing that HI variation is mainly due to grain yield variation. The RV was negatively correlated to both Rosette and FT, suggesting that RV is a good indicator of the partition of biomass produced before and after flowering. The trait Seeds was positively correlated with Seed C% in both the Cvi-0×Col-0 and Bur-0×Col-0 populations confirming that, as described for many crops, carbon fixation is a major limiting factor for yield. Surprisingly, this correlation was negative for the Ct-1×Col-0 population. Seed C% and Seed N% were negatively correlated in all populations suggesting that seed filling with either proteins or lipids is antagonistic. As a result, Seeds was negatively correlated with Seed N% in Cvi-0×Col-0 and Bur-0×Col-0, but not in Ct-1×Col-0. Despite these differences, the HI was positively correlated with Seed C% and negatively correlated with Seed N% in the three populations.
Table 3.
Pearson correlation coefficients between traits in each RIL population (light grey for Ct-1×Col-0, mid grey for Cvi-0×Col-0 and dark grey for Bur-0×Col-0)
For each correlation pair, only significant correlation coefficients are shown (P<0.05). ns for non-significant
| Trait1 | Leaf Senescence | Stem | Seeds | Rosette | HI | RV | FT | Seed C% | Seed N% | TGW |
|---|---|---|---|---|---|---|---|---|---|---|
| Leaf Senescence | –0.65 | –0.60 | –0.54 | ns | 0.21 | ns | 0.39 | –0.35 | ns | |
| ns | ns | ns | ns | ns | ns | ns | ns | –0.23 | ||
| ns | –0.25 | ns | 0.26 | –0.42 | ns | ns | –0.36 | |||
| Stem | –0.65 | 0.80 | 0.64 | –0.28 | ns | ns | –0.49 | 0.39 | 0.32 | |
| ns | 0.86 | 0.78 | –0.21 | –0.62 | 0.62 | ns | –0.28 | –0.33 | ||
| ns | 0.31 | 0.36 | ns | ns | –0.28 | ns | ns | ns | ||
| Seeds | –0.60 | 0.80 | 0.59 | 0.33 | ns | ns | –0.24 | ns | ns | |
| ns | 0.86 | 0.71 | 0.28 | –0.56 | 0.52 | 0.31 | –0.43 | –0.26 | ||
| ns | 0.31 | 0.53 | 0.85 | –0.25 | –0.47 | 0.62 | –0.54 | ns | ||
| Rosette | –0.54 | 0.64 | 0.59 | ns | –0.75 | 0.27 | –0.55 | 0.40 | ns | |
| ns | 0.78 | 0.71 | –0.26 | –0.81 | 0.76 | ns | ns | –0.48 | ||
| –0.25 | 0.36 | 0.53 | 0.30 | –0.76 | ns | 0.37 | ns | 0.38 | ||
| HI | ns | –0.28 | 0.33 | ns | ns | 0.48 | –0.41 | –0.22 | ||
| ns | –0.21 | 0.28 | –0.26 | 0.23 | –0.29 | 0.40 | –0.32 | 0.24 | ||
| ns | ns | 0.85 | 0.30 | –0.27 | –0.36 | 0.62 | –0.53 | ns | ||
| RV | 0.21 | ns | ns | –0.75 | ns | –0.38 | 0.35 | –0.24 | ns | |
| ns | –0.62 | –0.56 | –0.81 | 0.23 | –0.75 | 0.23 | ns | 0.47 | ||
| 0.26 | ns | –0.25 | –0.76 | –0.27 | –0.31 | –0.25 | ns | –0.31 | ||
| FT | ns | ns | ns | 0.27 | ns | –0.38 | ns | ns | ns | |
| ns | 0.62 | 0.52 | 0.76 | –0.29 | –0.75 | –0.22 | ns | –0.52 | ||
| –0.42 | –0.28 | –0.47 | ns | –0.36 | –0.31 | –0.24 | 0.28 | 0.47 | ||
| Seed C% | 0.39 | –0.49 | –0.24 | –0.55 | 0.48 | 0.35 | ns | –0.86 | ns | |
| ns | ns | 0.31 | ns | 0.40 | 0.23 | –0.22 | –0.88 | 0.29 | ||
| ns | ns | 0.62 | 0.37 | 0.62 | –0.25 | –0.24 | –0.85 | 0.30 | ||
| Seed N% | –0.35 | 0.39 | ns | 0.40 | –0.41 | –0.24 | ns | –0.86 | ns | |
| ns | –0.28 | –0.43 | ns | –0.32 | ns | ns | –0.88 | ns | ||
| ns | ns | –0.54 | ns | –0.53 | ns | 0.28 | –0.85 | ns | ||
| TGW | ns | 0.32 | ns | ns | –0.22 | ns | ns | ns | ns | |
| –0.23 | –0.33 | –0.26 | –0.48 | 0.24 | 0.47 | –0.52 | 0.29 | ns | ||
| –0.36 | ns | ns | 0.38 | ns | –0.31 | 0.47 | 0.30 | ns |
1Traits are described in Table 1. HI, harvest index; RV, ratio between reproductive and vegetative organ weights; FT, flowering time; TGW, thousand grain weight.
With regards to the leaf senescence trait, different correlation patterns were also found for the three populations. In the Ct-1×Col-0 population, leaf senescence was negatively correlated with plant biomass (Rosette, Stem, and Seeds) and Seed N%, and positively correlated to RV and Seed C% (Table 3). In the Bur-0×Col-0 population, leaf senescence was also negatively correlated to FT and positively to the RV. In the Cvi-0×Col-0 and Bur-0×Col-0 populations, leaf senescence was negatively correlated to TGW.
QTL analyses in the three RIL populations
The genetic architecture of the studied traits was addressed with a QTL approach using the R/QTL library in the R environment (Arends et al., 2010). Variation between RILs allowed us to map QTL for the ten studied traits in each population. For example, five QTL for leaf senescence were mapped in the Ct-1×Col-0 population, three in the Cvi-0×Col-0 population and two in the Bur-0×Col-0 population (Fig. 1D–F). Overall, the composite interval mapping method uncovered 101 QTL for the ten studied traits in the three RIL populations. The data for each QTL are shown in Supplementary Table S1 (available at JXB online), including the original chromosomal position, confidence interval (CI), and proportion of phenotypic variance (R 2) explained. The number of QTL for each trait varied from zero to seven per population, and each QTL explained 7–54% of the phenotypic variance. The use of common markers across the three different maps allowed us to directly compare the detected QTL in a single consensus map (Fig. 2).
Fig. 2.

Mapping of 101 QTL detected for leaf senescence and for traits related to resource allocation, onto a single consensus map. Each QTL is shown by a horizontal line, indicating the most likely position, with a vertical line indicating the confidence interval around this position. Line style indicates the population where the QTL was detected. Line colour shows the trait affected. Numbers on the right correspond to the genetic markers used to establish the consensus genetic map (Simon et al., 2008).
A major QTL, named Shoot Growth 1 (SG1), previously identified in the Bur-0×Col-0 population by Vlad et al. (2010, in Supplementary Fig. S1B available at JXB online), was consistently detected on chromosome 5, for several yield-related traits in the Bur-0×Col-0 and Ct-1×Col-0 populations. The SG1 locus accounted for the majority of the phenotypic variation for FT (R 2= 33%), HI (R 2=54%), Seeds (R 2=49%), Seed C% (R 2=35%), Seed N% (R 2=14%), and leaf senescence (R 2=11%) in the Bur-0×Col-0 population, and for Seed C% (R 2=26%), Seed N% (R 2=18%), Seeds (R 2=17%), TGW% (R 2=9%), and RV% (R 2=11%) in the Ct-1×Col-0 population (Supplementary Table S1 available at JXB online). The discovered effect of SG1 on resource allocation in seeds has been validated using near isogenic lines differing only at the SG1 locus (personal communication from O. Loudet, The Institut Jean-Pierre Bourgin, Versailles). The lines carrying the Bur-0 allele showed significantly higher scores for the traits Rosette, Stem, Seeds, as well as a significantly higher Seed C% and lower Seed N%, compared with the lines carrying the Col-0 allele, responsible for the defective shoot growth phenotype (Supplementary Table S2 available at JXB online). Owing to the strong effect of the SG1 locus, its presence hampered the detection of other minor QTL, especially in the Bur-0×Col-0 population.
Meta-analysis to decipher hot spots
The 101 detected QTL were projected onto the same consensus map (Sosnowski et al., 2012) and combined using a meta-analysis method. The meta-analysis resulted in a synthetic genetic model with 13 meta-QTL (Fig. 3, Table 4). These results are based on the hypothesis that the different traits are controlled by same genes, although we know that different QTL might overlap and be explained by different but close-by genes. Nevertheless, meta-analysis is a very good approach for identifying the most interesting loci (Table 4), in addition to the overview curve defined by Chardon et al. (2004), which represents the density of initial QTL detected (Fig. 3). The number of metaQTL identified on each chromosome varied from one on chromosome 2 to four on chromosome 1, with an average of 2.6 metaQTL per chromosome. The 13 metaQTL which form the synthetic genetic model are listed below and in Table 4:
Fig. 3.

QTL Meta-analysis results in a synthetic genetic model with 13 metaQTL. MetaQTL are shown in coloured squares on the five chromosomes. Dash curves, named overview curves in Chardon et al. (2004), represent the density of detected QTL. (This figure is available in colour at JXB online.)
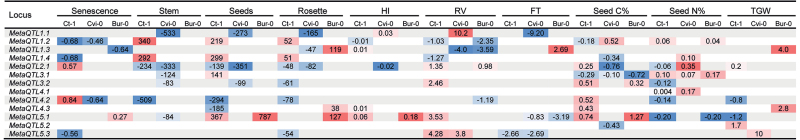
Table 4.
Meta-analysis results for ten traits related to leaf senescence and resource allocation in seeds. For each locus (metaQTL), populations and traits for which QTL were detected are indicated
Estimated effects of each metaQTL on traits in each population are shown when the effect is significant. Blue and red highlight negative and positive effects, respectively, of the Col-0 allele compared with the Ct-1, Cvi-0, and Bur-0 alleles. The colour intensity corresponds to the strength of the effect: the stronger the effect, the darker the colour.
|
Traits are described in Table 1. HI, harvest index; RV, ratio between reproductive and vegetative organ weights; FT, flowering time; TGW, thousand grain weight
MetaQTL1.1 is specific to the Cvi-0×Col-0 population as all QTL clustered at this locus were only detected in this population (Table 4). The Cvi-0 allele decreases plant biomass (–165mg, –533mg and –273mg for Rosette, Stem, and Seeds, respectively), induces early FT (–9.2 d) while it raises RV (+10.2). MetaQTL1.1 explains in part the high correlation observed between these traits in the Cvi-0×Col-0 population (Table 3). The effect of metaQTL1.1 is consistent with the effect of a gene involved in FT.
MetaQTL1.2 affects leaf senescence in Ct-1×Col-0 and Cvi-0×Col-0 populations. The Ct-1 and Cvi-0 alleles reduce leaf senescence compared with the Col-0 allele (–0.68 and –0.46, respectively). At metaQTL1.2, the Ct-1 allele increases plant biomass (+52mg, +340mg, and +219mg for Rosette, Stem, and Seeds, respectively), slightly reducing the HI (–0.01) and RV (–1.03), and resulting in lower Seed C% (–0.18%) and higher Seed N% (+0.06%). The Cvi-0 allele has no effect on plant biomass but significantly increases Seed C% (+0.52%). These contrasting allelic effects on growth traits and resource allocation could be explained by either (i) two independent loci in Ct-1×Col-0 and Cvi-0×Col-0 populations with allele-specific effects on traits, (ii) two loci located under metaQTL1.2 independently controlling leaf senescence and resource allocation, or (iii) a single locus with same allelic effect on leaf senescence but allele-specific effects on biomass and seed composition.
MetaQTL1.3 was mainly detected in the Bur-0×Col-0 population. The Bur-0 allele decreases leaf senescence (–0.64), but increases Rosette (+119mg) and delays FT (+2.7 d). No effect on seed C% and N% was detected, but TGW is affected (+4.0mg). Contrasting effects on Rosette (–47mg) and the RV (–4.0) were measured in the Cvi-0×Col-0 population.
MetaQTL1.4 mainly affects leaf senescence and plant biomass in the Ct-1×Col-0 population, whereas it is involved in seed composition traits in the Cvi-0×Col-0 population. The Ct-1 allele reduces leaf senescence (–0.68), increases plant biomass (+51mg, +299mg and +292mg for Rosette, Stem and Seeds respectively), slightly increasing the HI (+0.01) and decreasing the RV (–1.3), compared with the Col-0 allele. The Cvi-0 allele has no effect on plant growth but reduces Seed C% (–0.34%) and increases Seed N% (+0.10 %). The most likely explanation for these different effects is that metaQTL1.4 clusters two independent loci.
MetaQTL2.1 has contrasting effects on leaf senescence and plant biomass in the Ct-1×Col-0 population. The Ct-1 allele increases leaf senescence (+0.57), but reduces plant biomass (–48mg, –234mg and –139mg for Rosette, Stem, and Seeds, respectively), compared with the Col-0 allele. MetaQTL2.1 has similar effects on plant biomass in the Cvi-0×Col-0 population, but no significant effect on leaf senescence was detected in this population. The cvi-0 allele decreases plant biomass (–82mg, –333mg, and –351mg for Rosette, Stem, and Seeds, respectively), compared with the Col-0 allele. Interestingly, metaQTL2.1 has opposing effects on both Seed C% and Seed N% in the two populations. The Ct-1 allele increases Seed C% (+0.25%), but reduces Seed N% (–0.06%) whereas the Cvi-0 allele reduces Seed C% (–0.76%) but increases Seed N% (+0.35%), compared with the Col-0 allele. Such opposite effects at metaQTL2.1 could be explained by several hypotheses such as those described above for metaQTL1.2.
MetaQTL3.1 is mainly involved in seed composition in the three populations. The Ct-1, Cvi-0, and Bur-0 alleles reduce Seed C% (–0.29%, –0.10%, and –0.72%, respectively) and increase Seed N% (+0.10%, +0.07%, and +0.17%, respectively), compared with the Col-0 allele. Allele-specific effects on Stem (–124mg) and Seeds (+141mg) were detected in the Cvi-0×Col-0 and Ct-1×Col-0 populations, respectively.
MetaQTL3.2 is involved in the control of reproductive organs (Stem and Seeds) in the Cvi-0×Col-0 population, but without a detected effect on seed composition. The Cvi-0 allele reduces Stem (–83mg) and Seeds (–99mg) compared with the Col-0 allele. In contrast, metaQTL3.2 affects only Rosette in the Ct-1×Col-0 population, resulting in variation in the RV. This locus also dramatically affects Seed C% in the Ct-1×Col-0 and Bur-0×Col-0 populations. The Ct-1 and Bur-0 alleles increase Seed C% (respectively +0.51% and +0.32%), compared with the Col-0 allele.
MetaQTL4.1 has a weak effect on Seed N%, but no significant effect on Seed C% in the Ct-1×Col-0 and Cvi-0×Col-0 populations. The Ct-1 and Cvi-0 alleles increase Seed N% (+0.004% and +0.17%, respectively), compared with the Col-0 allele.
MetaQTL4.2 shows marked, but opposite effects on leaf senescence in the Ct-1×Col-0 and Cvi-0×Col-0 populations. The Ct-1 allele increases leaf senescence (+0.84), whereas the Cvi-0 allele reduces leaf senescence (–0.64), compared with the Col-0 allele. Together with this effect on leaf senescence, the Ct-1 allele decreases plant biomass (–78mg, –509mg, and –294mg for Rosette, Stem, and Seeds, respectively), shows higher Seed C% (+0.52%), and lower Seed N% (–0.14%), and reduced TGW (–0.8mg), compared with the Col-0 allele.
MetaQTL4.3 clusters QTL detected in the Ct-1×Col-0 and Bur-0×Col-0 populations. The Ct-1 allele decreases Seeds (–185mg), slightly increases the HI (+0.01), and leads to seeds with high Seed C% (+0.43%), compared with the Col-0 allele. The Bur-0 allele increases Rosette (+38mg) and TGW (+2.8mg), compared with the Col-0 allele. Such contrary effects suggest that metaQTL4.3 clusters different loci from the two populations.
MetaQTL5.1 is most likely the SG1 locus, as previously mentioned. It has a dramatic effect on Seeds, HI, FT, Seed C%, and Seed N% in the Ct-1×Col-0 and Bur-0×Col-0 populations.
MetaQTL5.2 is an incongruent locus clustering only two initial QTL. The Ct-1 allele increases TGW (–1.7mg), whereas the Cvi-0 allele reduces Seed C% (–0.43%), compared with the Col-0 allele.
MetaQTL5.3 clusters QTL detected in the Ct-1×Col-0 and Cvi-0×Col-0 populations. The Ct-1 and Cvi-0 alleles reduce FT (–2.66 d and –2.69 d, respectively) and increase the RV (+4.3 and +3.8, respectively), compared with the Col-0 allele. The Ct-1 allele also reduces leaf senescence (–0.56) and Rosette (–54mg), compared with the Col-0 allele. The metaQTL5.3 effect is consistent with the effect of a gene involved in FT.
Candidate genes overlapping metaQTL
In addition to the co-localization between SG1 and metaQTL5.1, several other overlaps were observed between detected metaQTL and genes known from the literature to be involved in flowering time, resource allocation, and leaf senescence, suggesting that they may be responsible for the phenotypic variation observed. Fig. 4 shows the metaQTL map with the localization of these candidate genes, which are also listed in Supplementary Table S3 (available at JXB online). MetaQTL1.1 and metaQTL5.3 overlapped with the CRY2 (CRYPTOCHROME 2) and MAF2/3/4/5 flowering time genes, respectively. Considering genes involved in leaf senescence and resource allocation processes, we also found several candidates which co-localized with metaQTL: MetaQTL1.2 with the ORE7 (ORESARA 7), ALAAT1 (ALANINE AMINOTRANSFERASE 1), and AOAT1 (ALANINE-2-OXOGLUTARATE AMINOTRANSFERASE 1) genes; MetaQTL1.4 with the ANAC029 gene; MetaQTL4.2 with the NYC1 (NON-YELLOW COLORING 1) gene; MetaQTL4.3 with the SGR (STAY-GREEN) and WRKY53 genes; and MetaQTL5.2 with the SAG113 (SENESCENCE-ASSOCIATED GENE 113) gene.
Fig. 4.

MetaQTL (mQTL) were compared with the position of candidate genes for flowering time, senescence, resource allocation and the SG1 locus. (This figure is available in colour at JXB online.)
Leaf senescence disrupts the negative correlation between Seed N% and Seeds
The seed N concentration is frequently negatively correlated to seed yield in crops (Uauy et al., 2006, Gregersen et al., 2013). A negative correlation was observed here in both the Cvi-0×Col-0 and Bur-0×Col-0 populations, but not in the Ct-1×Col-0 population (Table 3). We studied the different relationships between Seed N% and Seeds on the basis of our genetic architecture model controlling these traits. Fig. 5 shows a scatter plot of all the estimated effects of the 13 metaQTL on Seeds and Seed N% (significant as well as non-significant effects). This figure shows that the estimated effects of the metaQTL on Seeds and on Seed N% are negatively correlated in the Cvi-0×Col-0 (Fig. 5A) and Bur-0×Col-0 (Fig. 5B) populations, with correlation coefficients of r 2=–0.50 and r 2=–0.67 respectively. This means that for most of the metaQTL, when they have a positive effect on one trait they have a negative effect on the other trait (Table 4). In contrast, the estimated effects of metaQTL on Seeds and Seed N% were positively correlated in the Ct-1×Col-0 population (Fig. 5C). Although the correlation is low (r 2=+0.27) owing to the outlier metaQTL5.1 (SG1) mentioned before, the alleles at the different metaQTL act both on Seeds and Seed N% and in the same direction (Table 4).
Fig. 5.

Effect of meta-QTL estimated on Seeds and Seed N% in the three RIL populations: Cvi-0×Col-0 (A), Bur-0×Col-0 (B), and Ct-1×Col-0 (C). The size of the circle is proportional to the effect of meta-QTL on leaf senescence. (This figure is available in colour at JXB online.)
On the same scatter plot, the effects of the 13 metaQTL on leaf senescence are shown by the size of their plots (Fig. 5A–C). There was no relationship between leaf senescence and the two traits Seeds and Seed N% in the Cvi-0×Col-0 and Bur-0×Col-0 populations (Table 3). However, in the Ct-1×Col-0 population, the effect of the metaQTL on senescence is related to the positive correlation of metaQTL with Seeds and Seed N% (Fig. 5C). This suggests that the metaQTL with the weakest effects of the Ct-1 allele on Seeds and Seed N% traits together have the strongest positive effects on leaf senescence. In contrast, the metaQTL with the strongest effects of the Ct-1 allele on Seeds and Seed N% together have the most negative effects on leaf senescence. For example, the Ct-1 allele at metaQTL4.2 reduces Seeds (–294mg) and Seed N% (–0.14%), but increases leaf senescence (+0.84), whereas at metaQTL1.2 it increases Seeds (+219mg) and Seed N% (+0.06%), but moderates leaf senescence (–0.68). This suggests that in the Ct-1×Col-0 population the leaf senescence phenotype has reversed the negative correlation existing between Seed N% and Seeds in the Cvi-0×Col-0 and Bur-0×Col-0 populations.
Discussion
Association between leaf senescence and resource allocation traits in Arabidopsis
During plant development, leaf senescence occurring during vegetative growth has an impact on rosette size; plants showing strong senescence phenotypes have small rosettes (Loudet et al., 2003; Diaz et al., 2006; Diaz et al., 2008). However, the long-term effect of leaf senescence on resource allocation is largely unknown and to date none of the Arabidopsis studies on leaf senescence considered resource allocation to seeds. In the present study, leaf senescence was scored at the vegetative stage and compared with nine resource-allocation traits measured at seed maturity stage (Table 1) in three different RIL populations.
In the Ct-1×Col-0 population, in which the differences between the values for the parental lines were the highest, leaf senescence is negatively correlated to final rosette weight, confirming our previous observation (Diaz et al., 2006). Leaf senescence is also negatively correlated to reproductive organ growth and yield (Stem and Seeds; Table 3). Thus, leaf senescence seems to limit rosette development as well as the final plant development stages. However, because leaf senescence is positively correlated to the RV ratio (reproductive to vegetative biomass ratio; Table 3), its negative impact on growth seems to be stronger on rosettes than reproductive organs. Furthermore, leaf senescence also correlates positively with Seed C% and negatively with Seed N%, which is similar to the effects on seed resource allocation found in cereals (Table 3; Uauy et al., 2006). No correlation between seed composition or leaf senescence and flowering time was found in the Ct-1×Col-0 population showing that N and C seed allocation is most likely only related to leaf senescence and to the size of the source organs (rosette and stems) rather than to the duration of grain filling. Therefore, our results suggest that in the Ct-1×Col-0 population sequential senescence decreases the nitrogen remobilization efficiency from the rosette to the reproductive organs and alters Seed N%.
In contrast, in the Cvi-0×Col-0 and Bur-0×Col-0 populations, leaf senescence is not correlated to seed yield (Seeds) or to seed composition (Seed C% and Seed N% in Table 3). Leaf senescence is, however, negatively correlated to seed weight (TGW) in both populations, suggesting that the seeds of early senescing genotypes are smaller than those of late senescing genotypes, but that they produce a greater number of seeds so that overall seed yield remains unchanged. The negative correlation between rosette biomass and leaf senescence found in the Bay-0×Shahdara (Diaz et al. 2006) and Ct-1×Col-0 (present work) populations, is also found in the Bur-0×Col-0 population, which also shows a negative correlation between leaf senescence and flowering time, and a positive correlation between leaf senescence and RV.
Finally, as previously described for various accessions (Masclaux-Daubresse and Chardon, 2011), no correlation between the HI and leaf senescence was detected for any of the three RIL populations (Table 3). The positive relationship between HI, Seed C%, and yield (Seeds) with the negative correlation between HI and flowering time suggest that seed production and seed carbon filling are mainly due to the length of the reproductive stage.
These variations in the relationship between leaf senescence, nitrogen use efficiency (Diaz et al., 2006), rosette biomass, yield, and flowering related-traits suggest distinct and complex genetic control of leaf senescence in the different populations. This may explain why it was difficult to find clear links between all these traits when we analysed several accessions in our previous study (Masclaux-Daubresse and Chardon, 2011).
The genetic basis of leaf senescence and resource allocation in seeds
To decipher the genetic architecture of the studied traits, we performed QTL mapping in the three populations, resulting in the detection of 101 QTL. Using a meta-analysis method, we built a synthetic genetic model with 13 metaQTL clustering the initial QTL. Correlations between phenotypic traits could then be genetically analysed in light of metaQTL with pleotropic effects. Phenotypic co-variation between the different plant organs (Rosette, Stem, and Seeds) is supported by metaQTL clustering QTL for the three traits: metaQTL1.2, metaQT1.4, metaQT2.1, and metaQTL4.2 in the Ct-1×Col-0 population, and metaQTL1.1 and metaQTL2.1 in the Cvi-0×Col-0 population. Indeed, in these two populations, overall plant biomass is controlled by different loci revealing the complexity of the genetic architecture for these traits in Arabidopsis. Co-localization of QTL involved in growth of vegetative and reproductive organs was previously reported in maize and Brassica olacera (Lan and Paterson, 2001; Dignat et al., 2013). In the Bur-0×Col-0 population, no QTL for Stem were detected, explaining the absence of such a global metaQTL effect.
MetaQTL for HI, RV, and FT
The timely transition from vegetative to reproductive growth is critical for successful resource allocation in seeds. In this study, three traits were investigated to monitor seed resource allocation: the HI, the ratio between reproductive organ weight and vegetative organ weight (RV) and the FT (Table 1). In our genetic model, in addition to the SG1 locus, two major loci for FT, metaQTL1.1 and metaQTL5.3, were identified on chromosomes 1 and 5, respectively (Fig. 4 and Table 4). At these two loci, metaQTL also cluster QTL for HI and/or RV, both with an opposite allelic effect compared with FT. Three other loci, metaQTL1.2, metaQTL2.1 and metaQTL4.2, show significant effects mainly on the RV and to a lesser extent on the HI, but no significant effect on FT (Table 4). Therefore it seems that the negative correlation found between the HI and FT and discussed in the previous paragraph is mainly due to metaQTL1.1 and metaQTL5.3. The three other loci, metaQTL1.2, metaQTL2.1, and metaQTL4.2, suggest that the development of reproductive organs (stem and seeds) can be independent of flowering time. Interestingly, similar results have been reported in a QTL study for stem branching in Arabidopsis in which the authors found that only three of the eight mapped stem branching QTL co-localized with flowering time genes (Huang et al., 2013).
MetaQTL for leaf senescence
Seven metaQTL clustered the initial QTL for leaf senescence. Only three also grouped initial QTL for FT in the same population: metaQTL5.1-SG1, metaQTL1.3, and metaQTL5.3 (Table 4). Furthermore, no significant QTL for seed composition (Seed C% and Seed N%) was associated with these last two loci. This relationship is consistent with regulation of flowering time by leaf senescence previously reported in the Bay×Shadhara population (Wingler et al., 2010). The four other metaQTL, which cluster QTL for leaf senescence and exclude QTL for flowering time (metaQTL1.2, metaQTL1.4, metaQTL2.1, and metaQTL4.2) encompass QTL for plant biomass (Rosette, Stem, and Seeds) and seed composition (Seed C% and Seed N%, Table 4). For all these loci, their effects on leaf senescence are negatively correlated to plant biomass and Seed N%, but positively correlated to Seed C%. These loci support the phenotypic correlation between these traits observed in the Ct-1×Col-0 population. In this Ct-1×Col-0 population, we showed that the relationship between QTL effects on seed yield (Seeds) and Seed N% is the inverse of that commonly observed in crops (Oury and Godin, 2007; Ciampitti and Vyn, 2013) and to that found in the other two populations (Fig. 5). The absence of a negative correlation between seed N% and yield in the Ct-1×Col-0 population is probably due to interference of the leaf senescence effect on nitrogen-remobilization efficiency. This result shows that it is possible to find senescence-related genes in Arabidopsis that can disrupt the antagonistic effects of leaf senescence on grain yield and N content in seeds usually described in crops (Gregersen et al., 2013).
MetaQTL for seed composition
Among the three metaQTL (metaQTL3.1, metaQTL3.2, and metaQTL4.1) clustering QTL for seed composition (Seed C% and/or Seed N%), but not for flowering time or leaf senescence (Table 4), we found that two (metaQTL3.1 and metaQTL4.1) co-localize with QTL for seed oil content previously reported in other Arabidopsis populations by Hobbs et al. (2004) and O’Neill et al. (2012). This suggests that these two genomic regions are indeed involved in seed storage regulation. At the moment, no obvious candidate genes can be assigned to these loci. Nevertheless, the genes uncovered by these metaQTL should be good targets for plant breeding as these loci have low pleiotropic morphological effects. MetaQTL4.1 is of particular interest because it only affects Seed N% without affecting Seed C% in two populations (Ct-1×Col-0, Cvi-0×Col-0), even if the negative correlation between Seed C% and Seed N% was still observed (Table 3). The fine mapping of this locus will help understand its role in seed composition.
Diverse candidate genes underlie the genetic model
The relationship between traits at metaQTL may correspond to pleiotropic genes controlling leaf senescence and resource allocation, or to different closely linked genes. Considering genes involved in the regulation of flowering time, co-localization of metaQTL1.1 and metaQTL5.3 with CRY2 and MAF2/3/4/5, respectively, is consistent with their effects. Indeed, CRY2 and MAF2/3/4/5 have been shown to play a role in regulating flowering time (Guo et al., 1998) and similar co-localization results have been reported (Ungerer et al., 2002; El-Lithy et al., 2004; El-Lithy et al., 2006; Simon et al., 2008; Fournier-Level et al., 2013). CRY2 encodes the blue-light photoreceptor cryptochrome-2 shown to promote flowering in long-day photoperiods, which correspond to our experimental photoperiod (Guo et al., 1998). MetaQTL1.1 was only detected in the Cvi-0×Col-0 population. The Cvi-0 CRY2 allele is a natural variant that induces early flowering time (El-Assal et al., 2001). Plants carrying the Ct-1 and Cvi-0 alleles at metaQTL5.3 display an earlier FT with a concomitant enhanced RV compared with plants carrying the Col-0 allele. The genome structure of MAF2/3/4/5 genes, which were found to co-localize with metaQTL5.3, is complex and natural variation in this structure leads to accelerated flowering time (Caicedo et al., 2009; Rosloski et al., 2010). Further experiments are needed to determine if there is an effect on Seed C% in maf2/3/4/5 mutants.
Five other regions where metaQTL co-localized with genes involved in leaf senescence processes and resource allocation are shown in Fig. 4. MetaQTL1.2, which affects both leaf senescence and plant biomass, overlaps with the ORE7, ALAAT1, and AOAT1 genes. ORE7 encodes a protein with an AT-hook DNA-binding motif. Such proteins are known to co-regulate gene transcription through modification of chromatin architecture and it has been shown that leaf longevity increases markedly in the ore7 mutant (Lim et al., 2007). ALAAT1 encodes an alanine aminotransferase. In rice, the overexpression of a barley alanine aminotransferase (AlaAT) significantly increases plant biomass and grain yield by enhancing nitrogen-uptake efficiency (Shrawat et al., 2008). The AOAT1 gene codes for an alanine-2-oxoglutarate aminotransferase 1 and the rosette of the aoat1 mutant is pale green and grows more slowly than wild type (Verslues et al., 2007).
MetaQTL1.4 overlaps with the ANAC029 gene and shows a major effect on leaf senescence and plant biomass (Rosette, Stem, and Seeds) in the Ct-1×Col-0 population. The ANAC029 gene encodes a NAC family transcription factor, which is a key factor in the regulation of leaf senescence (Guo and Gan, 2006). As plants carrying the Ct-1 allele at this loci showed significantly delayed senescence compared with plants carrying the Col-0 allele, as in anac029 mutants, we hypothesize that the Ct-1 ANAC029 allele is less efficient at regulating the senescence process. In silico comparison of ANAC029 proteins of the four accessions identified Ct-1-specific polymorphisms (http://signal.salk.edu/atg1001/3.0/gebrowser.php). However, more experiments are needed to confirm that these polymorphisms are indeed responsible for the effect of MetaQTL1.4 on leaf senescence.
MetaQTL4.2 overlaps with the NYC1 gene, which encodes a chlorophyll b reductase involved in the degradation of chlorophyll b and LHCII (light harvesting complex II) and is annotated as a leaf-senescence-associated gene (Gepstein et al., 2003). NYC1 also plays a crucial role in seed maturation (Nakajima et al., 2012). The described roles of NYC1 are thus consistent with the effects of metaQTL4.2 on leaf senescence and seed composition. MetaQTL4.3 covers two senescence regulatory genes SGR and WRKY53. SGR is similar to the tomato senescence-inducible chloroplast stay-green protein 1 and is upregulated during the Arabidopsis life cycle, especially in senescing leaves (Ren et al., 2007). The WRKY53 transcription factor is also involved in the progression of leaf senescence (Koyama et al., 2013). Surprisingly, MetaQTL4.3 affects Seeds and Seed C% in the Ct-1×Col-0 population but not leaf senescence, suggesting that other genes besides SGR and WRKY53 are responsible for the phenotypic variation.
MetaQTL5.2, which affects Seed C% in Cvi-0×Col-0 and TGW in the Ct-1×Col-0 population, overlaps with the SAG113 gene encoding a member of the PP2C (PROTEIN PHOSPHATASE 2C) family controlling dehydration in senescing leaves (Zhang and Gan, 2012). No effect of SAG113 on seeds has been reported so far. However SAG113 is known to be under the control of the AtNAP transcription factor, which is a homologue of the wheat TtNAM-B1 gene known as a master regulator of grain protein content in wheat (Zhang and Gan, 2012).
In all cases, further experiments are required to determine whether these candidate genes control the phenotypic variations observed and to identify the molecular mechanisms involved (modification of the coding sequence, of the expression level or of epigenetic regulation).
Supplementary Data
Supplementary data are available at JXB online.
Supplementary Table S1: List of QTL detected in the three RIL populations. QTL nomenclature refers to (i) population, using the name of the parent different from Col-0; (ii) the trait; (iii) the chromosome where it is localized; and (iv) if several QTL for one trait are on the same chromosome, the number, as such: Parent_trait_chromosome_number. For each QTL the chromosome, the position (corresponding to the LOD score peak) and its confidence interval (CI, left and right borders) are indicated. The additive effect indicates the mean effect on the trait of the replacement of two Col-0 alleles by two Ct-1, Cvi-0, or Bur-0 alleles at the QTL. R 2 represents the proportion of phenotypic variance of the trait explained by the QTL.
Supplementary Table S2: Validation of the effects of the SG1 – metaQTL5.2 on plant biomass and seed composition using near isogenic lines carrying either Bur-0 or Col-0 alleles. Means and SD are shown (n=12) and probability that trait values are different depending on Col-0 or Bur-0 alleles at SG1 from T-tests.
Supplementary Table S3: List of candidate genes involved in senescence process, resource allocation and flowering time. Name gene, complete name gene and ATG code are recorded from TAIR (http://www.Arabidopsis.org/index.jsp). Gene positions are described by Chromosome, Position (the physical position on AGI map), and Marker code (estimated position onto the consensus genetic map by a homothetic projection).
References
- Abu-Shakra SS, Phillips DA, Huffaker RC. 1978. Nitrogen fixation and delayed leaf senescence in soybeans. Science 199, 973–975 [DOI] [PubMed] [Google Scholar]
- Arcade A, Labourdette A, Falque M, Mangin B, Chardon F, Charcosset A, Joets J. 2004. BioMercator: integrating genetic maps and QTL towards discovery of candidate genes. Bioinformatics 20, 2324–2326 [DOI] [PubMed] [Google Scholar]
- Arends D, Prins P, Jansen RC, Broman KW. 2010. R/qtl: high-throughput multiple QTL mapping. Bioinformatics 26, 2990–2992 [DOI] [PMC free article] [PubMed] [Google Scholar]
- Ay N, Irmler K, Fischer A, Uhlemann R, Reuter G, Humbeck K. 2009. Epigenetic programming via histone methylation at WRKY53 controls leaf senescence in Arabidopsis thaliana . The Plant Journal 58, 333–346 [DOI] [PubMed] [Google Scholar]
- Balazadeh S, Parlitz S, Mueller-Roeber B, Meyer RC. 2008. Natural developmental variations in leaf and plant senescence in Arabidopsis thaliana . Plant Biology 10, 136–147 [DOI] [PubMed] [Google Scholar]
- Balazadeh S, Siddiqui H, Allu AD, Matallana-Ramirez LP, Caldana C, Mehrnia M, Zanor MI, Kohler B, Mueller-Roeber B. 2010. A gene regulatory network controlled by the NAC transcription factor ANAC092/AtNAC2/ORE1 during salt-promoted senescence. The Plant Journal 62, 250–264 [DOI] [PubMed] [Google Scholar]
- Blanco A, Mangini G, Giancaspro A, et al. 2012. Relationships between grain protein content and grain yield components through quantitative trait locus analyses in a recombinant inbred line population derived from two elite durum wheat cultivars. Molecular Breeding 30, 79–92 [Google Scholar]
- Borrell AK, Hammer GL, Douglas ACL. 2000. Does maintaining green leaf area in Sorghum improve yield under drought? I. Leaf growth and senescence. Crop Science 40, 1026–1037 [Google Scholar]
- Caicedo AL, Richards C, Ehrenreich IM, Purugganan MD. 2009. Complex rearrangements lead to novel chimeric gene fusion polymorphisms at the Arabidopsis thaliana MAF2-5 flowering time gene cluster. Molecular Biology and Evolution 26, 699–711 [DOI] [PubMed] [Google Scholar]
- Chardon F, Virlon B, Moreau L, Falque M, Joets J, Decousset L, Murigneux A, Charcosset A. 2004. Genetic architecture of flowering time in maize as inferred from quantitative trait loci meta-analysis and synteny conservation with the rice genome. Genetics 168, 2169–2185 [DOI] [PMC free article] [PubMed] [Google Scholar]
- Churchill GA, Doerge RW. 1994. Empirical threshold values for quantitative trait mapping. Genetics 138, 963–971 [DOI] [PMC free article] [PubMed] [Google Scholar]
- Ciampitti IA, Vyn TJ. 2013. Grain nitrogen source changes over time in maize: A review. Crop Science 53, 366–377 [Google Scholar]
- Diaz C, Lemaitre T, Christ A, Azzopardi M, Kato Y, Sato F, Morot-Gaudry J-F, Le Dily F, Masclaux-Daubresse C. 2008. Nitrogen recycling and remobilization are differentially controlled by leaf senescence and development stage in Arabidopsis under low nitrogen nutrition. Plant Physiology 147, 1437–1449 [DOI] [PMC free article] [PubMed] [Google Scholar]
- Diaz C, Purdy S, Christ A, Morot-Gaudry JF, Wingler A, Masclaux-Daubresse C. 2005. Characterization of markers to determine the extent and variability of leaf senescence in Arabidopsis. A metabolic profiling approach. Plant Physiology 138, 898–908 [DOI] [PMC free article] [PubMed] [Google Scholar]
- Diaz C, Saliba-Colombani V, Loudet O, Belluomo P, Moreau L, Daniel-Vedele F, Morot-Gaudry J-F, Masclaux-Daubresse C. 2006. Leaf yellowing and anthocyanin accumulation are two genetically independent strategies in response to nitrogen limitation in Arabidopsis thaliana . Plant and Cell Physiology 47, 74–83 [DOI] [PubMed] [Google Scholar]
- Dignat G, Welcker C, Sawkins M, Ribaut JM, Tardieu F. 2013. The growths of leaves, shoots, roots and reproductive organs partly share their genetic control in maize plants. Plant, Cell & Environment 36, 1105–1119 [DOI] [PubMed] [Google Scholar]
- El-Assal SE, Alonso-Blanco C, Peeters AJ, Raz V, Koornneef M. 2001. A QTL for flowering time in Arabidopsis reveals a novel allele of CRY2 . Nature Genetics 29, 435–440 [DOI] [PubMed] [Google Scholar]
- El-Lithy ME, Bentsink L, Hanhart CJ, et al. 2006. New Arabidopsis recombinant inbred line populations genotyped using SNPWave and their use for mapping flowering-time quantitative trait loci. Genetics 172, 1867–1876 [DOI] [PMC free article] [PubMed] [Google Scholar]
- El-Lithy ME, Clerkx EJM, Ruys GJ, Koornneef M, Vreugdenhil D. 2004. Quantitative trait locus analysis of growth-related traits in a new Arabidopsis recombinant inbred population. Plant Physiology 135, 444–458 [DOI] [PMC free article] [PubMed] [Google Scholar]
- Fischer AM. 2012. The complex regulation of senescence. Critical Reviews in Plant Sciences 31, 124–147 [Google Scholar]
- Fournier-Level A, Wilczek AM, Cooper MD, et al. 2013. Paths to selection on life history loci in different natural environments across the native range of Arabidopsis thaliana . Molecular ecology 22, 3552–3566 [DOI] [PubMed] [Google Scholar]
- Gan S, Amasino RM. 1997. Making sense of senescence (molecular genetic regulation and manipulation of leaf senescence). Plant Physiology 113, 313–319 [DOI] [PMC free article] [PubMed] [Google Scholar]
- Gepstein S, Sabehi G, Carp M-J, Hajouj T, Nesher MFO, Yariv I, Dor C, Bassani M. 2003. Large-scale identification of leaf senescence-associated genes. The Plant Journal 36, 629–642 [DOI] [PubMed] [Google Scholar]
- Grbic B, Bleecker AB. 1996. An altered body plan is conferred on Arabidopsis plants carrying dominant alleles of two genes. Development 122, 2395–403 [DOI] [PubMed] [Google Scholar]
- Gregersen PL, Culetic A, Boschian L, Krupinska K. 2013. Plant senescence and crop productivity. Plant Molecular Biology 82, 603–622 [DOI] [PubMed] [Google Scholar]
- Guo H, Yang H, Mockler TC, Lin C. 1998. Regulation of flowering time by Arabidopsis photoreceptors. Science 279, 1360–1363 [DOI] [PubMed] [Google Scholar]
- Guo Y, Gan S. 2006. AtNAP, a NAC family transcription factor, has an important role in leaf senescence. The Plant Journal 46, 601–612 [DOI] [PubMed] [Google Scholar]
- Hobbs DH, Flintham JE, Hills MJ. 2004. Genetic control of storage oil synthesis in seeds of Arabidopsis . Plant Physiology 136, 3341–3349 [DOI] [PMC free article] [PubMed] [Google Scholar]
- Huang X, Ding J, Effgen S, Turck F, Koornneef M. 2013. Multiple loci and genetic interactions involving flowering time genes regulate stem branching among natural variants of Arabidopsis . New Phytologist 199, 843–857 [DOI] [PubMed] [Google Scholar]
- Hunkovà E, Živčák M, Olšovská K. 2011. Leaf area duration of oilseed rape (Brassica napus subsp. napus) varieties and hybrids and its relationship to selected growth and productivity parameters. Journal of Central European Agriculture 12, 1–15 [Google Scholar]
- Ismail AM, Hall AE, Ehlers JD. 2000. Delayed-leaf-senescence and heat-tolerance traits mainly are independently expressed in cowpea. Crop Science 40, 1049–1055 [Google Scholar]
- Kim JH, Woo HR, Kim J, Lim PO, Lee IC, Choi SH, Hwang D, Nam HG. 2009. Trifurcate feed-forward regulation of age-dependent cell death involving miR164 in Arabidopsis . Science 323, 1053–1057 [DOI] [PubMed] [Google Scholar]
- Koyama T, Nii H, Mitsuda N, Ohta M, Kitajima S, Ohme-Takagi M, Sato F. 2013. A regulatory cascade involving class II ETHYLENE RESPONSE FACTOR transcriptional repressors operates in the progression of leaf senescence. Plant Physiology 162, 991–1005 [DOI] [PMC free article] [PubMed] [Google Scholar]
- Lan TH, Paterson AH. 2001. Comparative mapping of QTLs determining the plant size of Brassica oleracea . Theoretical and Applied Genetics 103, 383–397 [Google Scholar]
- Lim PO, Kim Y, Breeze E, et al. 2007. Overexpression of a chromatin architecture-controlling AT-hook protein extends leaf longevity and increases the post-harvest storage life of plants. The Plant Journal 52, 1140–1153 [DOI] [PubMed] [Google Scholar]
- Loudet O, Chaillou S, Merigout P, Talbotec J, Daniel-Vedele F. 2003. Quantitative trait loci analysis of nitrogen use efficiency in Arabidopsis . Plant Physiology 131, 345–358 [DOI] [PMC free article] [PubMed] [Google Scholar]
- Masclaux-Daubresse C, Chardon F. 2011. Exploring nitrogen remobilization for seed filling using natural variation in Arabidopsis thaliana . Journal of Experimental Botany 62, 2131–2142 [DOI] [PMC free article] [PubMed] [Google Scholar]
- McKhann IH, Camilleri C, Bérard A, Bataillon T, David LJ, Reboud X, Le Corre V, Caloustian C, Gut GI, Brunel D. 2004. Nested core collections maximizing genetic diversity in Arabidopsis thaliana. The Plant Journal 38, 193–202 [DOI] [PubMed] [Google Scholar]
- Miao Y, Laun T, Zimmermann P, Zentgraf U. 2004. Targets of the WRKY53 transcription factor and its role during leaf senescence in Arabidopsis . Plant Molecular Biology 55, 853–867 [DOI] [PubMed] [Google Scholar]
- Miao Y, Smykowski A, Zentgraf U. 2008. A novel upstream regulator of WRKY53 transcription during leaf senescence in Arabidopsis thaliana . Plant Biology 10, 110–120 [DOI] [PubMed] [Google Scholar]
- Nakajima S, Ito H, Tanaka R, Tanaka A. 2012. Chlorophyll b reductase plays an essential role in maturation and storability of Arabidopsis seeds. Plant Physiology 160, 261–273 [DOI] [PMC free article] [PubMed] [Google Scholar]
- O’Neill CM, Morgan C, Hattori C, et al. 2012. Towards the genetic architecture of seed lipid biosynthesis and accumulation in Arabidopsis thaliana . Heredity 108, 115–123 [DOI] [PMC free article] [PubMed] [Google Scholar]
- Olsen AN, Ernst HA, Leggio LL, Skriver K. 2005. NAC transcription factors: structurally distinct, functionally diverse. Trends in Plant Science 10, 79–87 [DOI] [PubMed] [Google Scholar]
- Oury F-X, Godin C. 2007. Yield and grain protein concentration in bread wheat: how to use the negative relationship between the two characters to identify favourable genotypes? Euphytica 157, 45–57 [Google Scholar]
- Ren G, An K, Liao Y, Zhou X, Cao Y, Zhao H, Ge X, Kuai B. 2007. Identification of a novel chloroplast protein AtNYE1 regulating chlorophyll degradation during leaf senescence in Arabidopsis . Plant Physiology 144, 1429–41 [DOI] [PMC free article] [PubMed] [Google Scholar]
- Rosloski SM, Jali SS, Balasubramanian S, Weigel D, Grbic V. 2010. Natural diversity in flowering responses of Arabidopsis thaliana caused by variation in a tandem gene array. Genetics 186, 263–76 [DOI] [PMC free article] [PubMed] [Google Scholar]
- Schippers JHM, Jing H-C, Hille J, Dijkwel PP. 2007. Developmental and hormonal control of leaf senescence. In: Gan S, ed. Senescence Processes in Plants. Oxford: Blackwell Publishing Ltd, 145–170 [Google Scholar]
- Shrawat AK, Carroll RT, DePauw M, Taylor GJ, Good AG. 2008. Genetic engineering of improved nitrogen use efficiency in rice by the tissue-specific expression of alanine aminotransferase. Plant Biotechnology Journal 6, 722–732 [DOI] [PubMed] [Google Scholar]
- Simmonds NW. 1995. The relation between yield and protein in cereal grain. Journal of the Science of Food and Agriculture 67, 309–315 [Google Scholar]
- Simon M, Loudet O, Durand S, Bérard A, Brunel D, Sennesal F-X, Durand-Tardif M, Pelletier G, Camilleri C. 2008. Quantitative trait loci mapping in five new large recombinant inbred line populations of Arabidopsis thaliana genotyped with consensus single-nucleotide polymorphism markers. Genetics 178, 2253–2264 [DOI] [PMC free article] [PubMed] [Google Scholar]
- Sosnowski O, Charcosset A, Joets J. 2012. BioMercator V3: an upgrade of genetic map compilation and quantitative trait loci meta-analysis algorithms. Bioinformatics 28, 2082–2083 [DOI] [PMC free article] [PubMed] [Google Scholar]
- Thomas H, Stoddart JL. 1980. Leaf senescence. Annual Review of Plant Physiology 31, 83–111 [Google Scholar]
- Tian L, Chen ZJ. 2001. Blocking histone deacetylation in Arabidopsis induces pleiotropic effects on plant gene regulation and development. Proceedings of the National Academy of Sciences, USA 98, 200–205 [DOI] [PMC free article] [PubMed] [Google Scholar]
- Uauy C, Distelfeld A, Fahima T, Blechl A, Dubcovsky J. 2006. A NAC gene regulating senescence improves grain protein, zinc, and iron content in wheat. Science 314, 1298–1301 [DOI] [PMC free article] [PubMed] [Google Scholar]
- Ungerer MC, Halldorsdottir SS, Modliszewski JL, Mackay TFC, Purugganan MD. 2002. Quantitative trait loci for inflorescence development in Arabidopsis thaliana . Genetics 160, 1133–1151 [DOI] [PMC free article] [PubMed] [Google Scholar]
- Verslues PE, Kim Y-S, Zhu J-K. 2007. Altered ABA, proline and hydrogen peroxide in an Arabidopsis glutamate:glyoxylate aminotransferase mutant. Plant Molecular Biology 64, 205–217 [DOI] [PubMed] [Google Scholar]
- Vlad D, Rappaport F, Simon M, Loudet O. 2010. Gene transposition causing natural variation for growth in Arabidopsis thaliana . PLoS Genetics 6, e1000945. [DOI] [PMC free article] [PubMed] [Google Scholar]
- Wingler A, Purdy SJ, Edwards S-A, Chardon F, Masclaux-Daubresse C. 2010. QTL analysis for sugar-regulated leaf senescence supports flowering-dependent and -independent senescence pathways. New Phytologist 185, 420–433 [DOI] [PubMed] [Google Scholar]
- Zavaleta-Mancera HA, Thomas BJ, Thomas H, Scott IM. 1999. Regreening of senescent Nicotiana leaves: II. Redifferentiation of plastids. Journal of Experimental Botany 50, 1683–1689 [Google Scholar]
- Zentgraf U, Laun T, Miao Y. 2010. The complex regulation of WRKY53 during leaf senescence of Arabidopsis thaliana . European Journal of Cell Biology 89, 133–137 [DOI] [PubMed] [Google Scholar]
- Zhang K, Gan S-S. 2012. An abscisicacid-AtNAP transcription factor-SAG113 protein phosphatase 2C regulatory chain for controlling dehydration in senescing Arabidopsis leaves. Plant Physiology 158, 961–969 [DOI] [PMC free article] [PubMed] [Google Scholar]
Associated Data
This section collects any data citations, data availability statements, or supplementary materials included in this article.