
Figure 1.
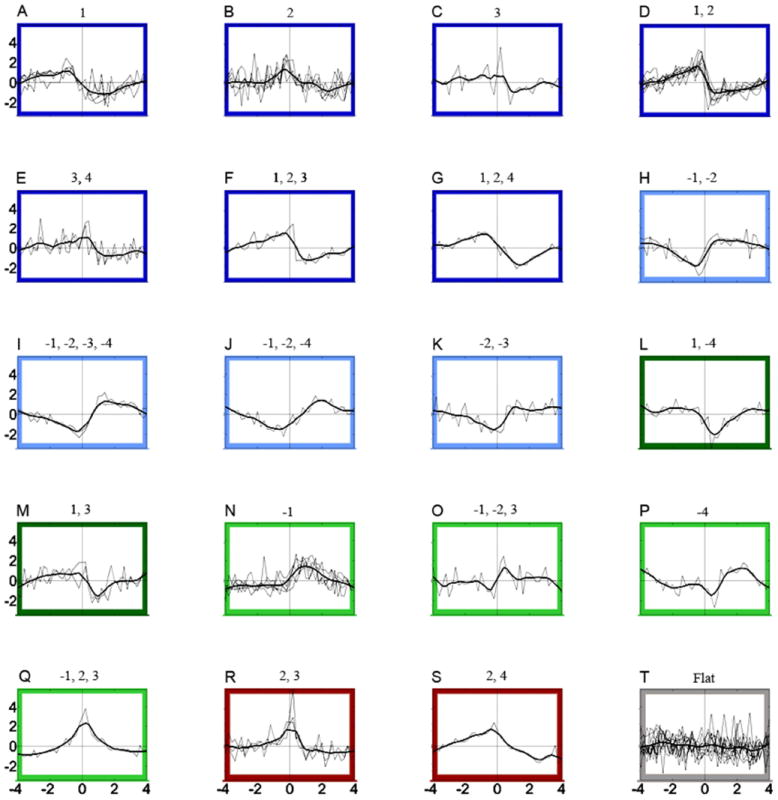
Slow phasic changes in firing. The entire population of recorded neurons is displayed for each PCA based category. Each PCA based category, a value consisting of the positive or negative loadings for a component in which the loading >= |0.32|, is listed above each plot at time zero. Thin black lines are z-score transformed slow phasic firing rate data from each neuron. Thick black lines are spline curves fitted to all z-score transformed slow-phasic firing rates for all individual neurons within each PCA category (number at center above each subplot). Outlining colors indicate post-press change + reversal patterns for each PCA category. Dark colors indicate decreases while light colors indicate increases in firing following the press (post-press change). The most predominant phasic firing pattern, the decrease + progressive reversal, is outlined by dark blue (A-G) while the increase + progressive reversal pattern is outlined in light blue (H-K). Decrease + early reversal neurons are outlined in dark green (L-M) while increase + early reversal neurons are outlined in light green (N-Q). Decrease + late reversal neurons are outlined in dark red (R-S). There were no increase + late reversal neurons. The “no change” category outlined in gray displays all neurons removed from the PCA analyses, whose firing rates were statistically determined to be unaltered over the inter-infusion interval. All x-axes are between -4 and +4 min and all y-axes are between +5 and -3 standardized units.