
Figure 7.
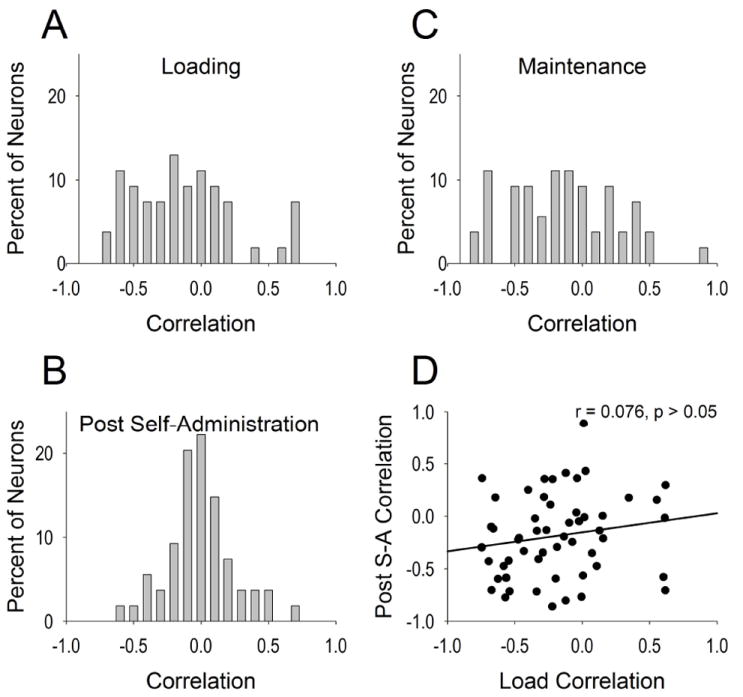
Correlation of firing rate and drug level over tonic timescale. X-axes refer to correlation of drug level and firing rate distributed across percent of neurons within VP (y-axes) for loading phase (A), maintenance phase (B), and post self-administration phase (C). Although similar in distribution, load correlation did not predict post self-administration correlation (D).