

Abstract
Continuous physiologic monitoring would add greatly to both home and clinical medical treatment for chronic conditions. Implantable nanosensors are a promising platform for designing continuous monitoring systems. This feature reviews design considerations and current approaches towards such devices.
1. Introduction
Implantable nanosensors are an emerging class of devices with a size less than one micron and the ability to measure a particular analyte in vivo. Their ability to reversibly measure a chemical or biological parameter in real time may potentially redefine the study, diagnosis, and treatment of disease. This potential will only become reality when such nanosensors meet the stringent design goals that are necessary for in vivo function. In particular, implanted nanosensors should be: easily deliverable and removable, reversibly responsive, sensitive and selective, biocompatible and biodegradable. These collective requirements are very difficult, a fact that explains why so few implantable nanosensors are clinically viable in the near future.
A growing number of rapid off-line or ex vivo biosensors like the I-stat1 or hand-held glucose monitor have been extensively developed and validated. Although they are not capable of truly continuous physiologic monitoring their designs can provide a starting point for in vivo sensor designs, as was the case for glucose monitors. However, as Wang and Wolfbeis recently noted2, too many sensor systems fail to detect analytes in relevant media, respond to a relevant concentration range, respond selectively to the analyte of interest, or provide quantitative information on analyte concentrations. For implantable nanosensors, the in vivo operating environment is complex and variable, therefore requiring robust sensor designs with respect to selectivity, sensitivity, stability, and more.
Implantable nanosensors could be either circulating in the blood or stationary at an anatomic site. They also can, in principle, produce electrical, optical, magnetic, or acoustic signals to report analyte measurements. Circulating nanosensor designs are very intriguing, but they also raise many discussion points such as biodistribution, circulation lifetime, and clearance that are too extensive for this review and are discussed elsewhere3. Optical readouts are appealing because they avoid the implantation site fouling and inflammation found with transdermal electrodes (see Kotanen et al4 for review) and, as discussed later, ratiometric signals or lifetime-based measurements can account for environmental variability at the implantation site. So while nano-scale electrochemical sensors have performed admirably for in vitro and, in some cases, short-term in vivo biosensing5, this feature article will focus on stationary optical nanosensors.
The feature will start by describing examples of implantable nanosensors that have been successfully produced and their importance to sensor development. Section three describes the performance characteristics that a nanosensor must meet, and section four discusses the performance and toxicity of different optical reporters. Section five discusses the types of recognition elements and their applicability to nanosensors. Since implantable nanosensors are relatively new, many of the examples are borrowed from existing in vitro or ex vivo sensors. However, the rigors of in vivo operation should be kept in mind.
2. Examples and importance
Continuous monitoring for multiple analytes such as a basic metabolic panel would provide high-value clinical information for chronic conditions such as diabetes mellitus, diabetes insipidus, and renal failure. Those conditions are characterized by a loss of kidney or pancreatic function, resulting in hypo/hyperglycemia, hyperkalemia, creatinine accumulation, and the concomitant effects of those imbalances. Renal patients are at risk of cardiac events due to blood-electrolyte dysregulaton6, but neither a continuous monitoring technology nor an at-home offline test kit exists to warn patients when their electrolyte concentrations are perturbed. Implantable nanosensors may someday be capable of optically reporting electrolyte concentrations in vivo7, but a lack of sensitivity, low signal-to-noise, and nanosensor stability remain significant obstacles.
Glucose monitoring is in a unique position with respect to other analytes because the large market and practical need have driven innovation so that both enzymatic8 and non-enzymatic9 glucose detection methods are now well-developed. Electrochemical continuous glucose monitors (CGMs) are only implantable for up to seven days10, and they have been put into clinical practice with mixed patient acceptance11 even though the readings are accurate. CGMs have been excellent clinical research tools and they show the value of continuous physiologic monitoring. However, the foreign body response to implanted CGMs limits their lifetimes and necessitates frequent in vivo calibrations12. The large patient population and benefits to patients' lives serve as incentive to develop alternatives to CGMs, and the difficulties in CGM implementation illustrate the difficulty of designing functional in vivo sensor systems.
Implantable nanosensors can mitigate these problems, though an implantable glucose nanosensor system has yet to be realized with the necessary combination of sensitivity and stability. While many groups have attempted to design implantable glucose sensors with boronic acids and fluorophores9a, few have actually monitored glucose in a live animal. One successful design used an injectable polyacrylamide hydrogel to immobilize a fluorescent boronic acid derivative and showed glucose responsiveness for up to 140 days9e, 13 (Figure 1). Their design is both injectable and explantable, but it induced substantial inflammation and relied on UV excitation. Another design paired boronic acid derivatives with alizarin to produce glucose nanosensors that fluoresce at 570 nm and selectively respond to glucose14. An improved design slowed nanoparticle diffusion from the injection site by encapsulating the nanoparticles in a hydrogel matrix, prolonging their in vivo residence three-fold15. The McShane group has developed an injectable glucose sensor in the form of a hydrogel microparticle and has achieved a linear response within the physiologic range16. Each of these implantable glucose nanosensors show that clinical implementation is getting closer, but several major challenges including sensitivity and stability, signal strength, and biocompatibility remain unreconciled. The remainder of this article describes the characteristics important for designing implantable nanosensors.
Figure 1.

Implantation and explantation of injectable hydrogel glucose sensor. Fiber was implanted through a syringe needle and removed with forceps. Reproduced from13, permission pending
Looking beyond electrolytes and saccharides, other bio-analytes such as oxygen, creatinine, urea, and reactive oxygen and nitrogen species (RONS) all have potential clinical applications. Recently, Pu et al developed a RONS nanosensor based on RONS-activated FRET between a semiconducting polymer and a NIR dye. Although it was not reversible, the nanosensor could image inflammatory microenvironments in vivo17. Another implantable nanosensor paired an oxygen-sensitive dye with an oxygen-consuming enzyme and demonstrated reversible in vivo detection of the small-molecule histamine (Figure 2) as a platform proof-of concept for nonsaccharides18. Due to the enzyme and nanosensor not being conjugated, the first design iterations were not sufficiently sensitive to physiologically-relevant histamine concentrations, and they were also not ratiometric. Given the large number of oxygen responsive dyes, such as the biocompatible Oxyphore series developed by Wilson and colleagues19, improvements in the analytical sensitivity of this platform are still achievable with commercially-available options and small changes to the sensor design.
Figure 2.
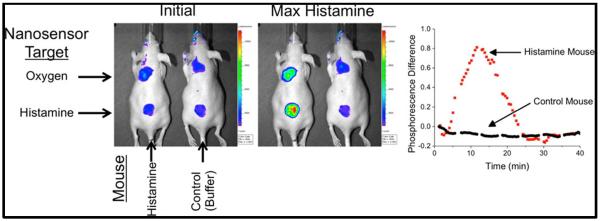
Implantable nanosensors were capable of detecting histamine in live mice. Sensor was based on pairing an oxygen-responsive dye with diamino oxidase. Reproduced from18, permission pending
Each of these nanosensors exemplifies the progress being made in implantable nanosensor design, but none meet all of the necessary performance criteria proposed in this feature article. However, the potential impact of better medical care management provides motivation for continued nanosensor development. The remainder of this feature article will address the design considerations that go into developing implantable nanosensors for continuous physiologic monitoring.
3. Sensor Performance Characteristics
An implantable nanosensor must perform reliably in vivo; this is a challenging task due to the complex biochemistry and ionic strength of the measurement medium. A reliable nanosensor must also reversibly measure the right analyte, be sensitive within the physiologic concentration range, and function continuously for a known amount of time. This section describes several performance characteristics and explains why each is vital to an implantable nanosensor.
3.1. Reversibility
In order to provide real-time information on bio-analyte concentrations, implantable nanosensors must be both fully reversible and responsive within relevant time intervals20. Reversibility is a necessity for continuous physiologic monitoring because analyte fluctuations are, themselves, valuable data21, and an irreversible nanosensor is a label and not a real-time nanosensor. Suppose an implantable glucose nanosensor was irreversible; after detecting a hyperglycemic event, what happens if a patient's glucose approaches hypoglycemic levels? Reversibility also distinguishes in vivo sensors from ex vivo detection systems that require multiple washing steps and often aim for near-irreversible antigen binding22. Some irreversible sensors have excellent sensitivity and selectivity, but their application in monitoring chronic conditions such as diabetes will never be realized until they are fully reversible. Implanted or injected irreversible nanosensors are essentially imaging labels, and those technologies are subject to different application and design considerations.
3.2. Sensitivity
Sensitivity requirements are driven by an analyte's physiological range and this cannot be compromised for in vivo measurements. We will focus on the sensitivity of the nanosensor's response, although it is worth noting that detectors such as CCD or sCMOS cameras have differing sensitivities that contribute to the nanosensor's performance requirements. Sensitive nanosensors should have a ratiometric, or two-wavelength, signal because ratiometric readouts can more reliably quantify analyte concentrations than single wavelength readouts20. It is possible to use time-resolved measurements with single wavelength sensors and obtain quantitative analyte measurements, though in vivo time-resolved measurements are not trivial and have thus far been limited to labels rather than sensors23. For applications that cannot rely on time-resolved measurements, a sensitive and quantitative implantable nanosensor must be ratiometric. Ratiometric designs can have one reference and one dynamic reporter, or they may have two dynamic reporters that change their signal in opposite directions. Either way the ratiometric measurement is less sensitive to variations in the number of nanosensors at the implantation site since the signal is normalized7b.
Ratiometric signals also mitigate the effects of changes in excitation intensity or absorption along the light path if both wavelengths can be excited with a single excitation source24. Sensitivity for individual wavelengths is generally defined as the slope of the linear response region for a sensor, with the x-axis being an analyte's concentration or the log of an analyte's concentration. For example, an implanted optical nanosensor's sensitivity would be defined according to the relative fluorescent units (RFU) as Δ(RFU)/Δ[analyte]. For a ratiometric signal based on two wavelengths, the sensitivity would be Δ(Ratio)/Δ[analyte]. The key point for designing implanted nanosensors is that the linear response range should be approximately centered at the analyte's physiologically-relevant range in order to produce a maximal and predictable signal change as the analyte's concentration changes.
Many reports on sensor development normalize the sensor responses and only present the normalized scale of 0 to 1. In order to scale appropriately, the endpoints of 0 and 1 should represent complete desaturation and complete saturation, not the endpoints of an arbitrary range of concentrations tested. For example, an ion-selective optode depends on an ion-proton exchange with a pH-responsive chromophore. The endpoints of 0 and 1 should only be based on low and high pH solutions so that calculations of selectivity (discussed below) and sensitivity are calculated with respect to the sensor's full dynamic range24. A well-designed nanosensor should be most sensitive and linearly responsive to the physiologically-relevant range for a particular analyte. Although signal normalization is necessary for calculating selectivity coefficients (Section 3.3), it is important to keep in mind that an implantable nanosensor will be measured through human tissue. Therefore, the absolute signal strength and sensitivity should be well-characterized and maximized.
3.3. Selectivity
Selectivity is an absolute necessity in order for accurate readings in vivo because tissues contain precursors and metabolites of many bio-analytes and their concentrations can all fluctuate. One common and well-established method for quantifying a sensor's selectivity is the Nicolskii-Eisenman method which was extensively developed for ion-selective electrodes25. The principles can be extended to many other types of sensors, including optical nanosensors26. The primary analyte, i, and the interfering analyte, j, each cause the sensor to respond, and a calibration curve for each will produce a separate values for Kd, the dissociation or equilibrium constant. The selectivity coefficient, Kij, can be quantified by comparing the sensor activity induced by the two different analytes separately, and it can be calculated as:
and generally the value of LogKij is reported. Kj and Ki are concentrations of the analytes that produce an equal sensor response. This approach calculates the differences in analyte concentration necessary to produce the same sensor response. For more extensive discussions see refs25–26.
3.4. Response time
In order to measure an analyte's rates of change, a sensor must respond much faster than the analyte changes. Sensors whose kinetics approximate first-order responses often report response times based on the time it takes to arrive at 90% or 95% of the steady-state value27. Theoretical derivations of surface-detection mediated nanosensors show a detailed derivation into how factors like shape and sensitivity affect sensor response times28. Using such predictions is a good starting point to try to meet response time and sensitivity criteria for an analyte of interest. Additionally, sensor response times should aim for the rate of physiological changes associated with the target analyte with the caveat that delays in sensor responses are the sum of the sensor kinetics plus the implantation site's lag behind changes in blood analyte levels. For example, blood analytes like glucose change over a matter of tens of minutes29, so a response time of five minutes is understandable, even admirable, in order to arrive at a nanosensor that is sensitive to within 10–20 mg/dL glucose30. However, continuous glucose monitors often report lag times of 4–10 minutes between the blood and other tissues29, meaning that the real 95% response time would be even longer. Some chronic conditions like kidney disease, for which creatinine is a standard biomarker, cause fluctuations over the course of many hours to a day31, and a creatinine sensor could trade response time for accuracy in such a case. Finally, the intervention time should also enter into decisions about sensitivity and response time. Creatinine fluctuations are non-emergent and they can be monitored over many hours before the patient would need medical intervention. However, a sensor for high-risk myocardial infarction patients should respond rapidly enough to an early serum marker of infarction to allow that patient to call for medical attention.
3.5. Biocompatibility
Implantable nanosensors have more challenging biocompatibility requirements than those for in vitro diagnostics. A nanosensor's functional lifetime will depend on its biocompatibility. Long-lasting biosensors would need to mitigate acute inflammation and then integrate with the surrounding tissue32, making a tissue scaffold/biosensor hybrid design preferable to a nanoparticle-based sensor design. However, nanosensors intended for several days of use would primarily aim to escape phagocytosis by varying nanoparticle size, shape, and surface chemistry and then safely clear the injection site. In either case, the nanosensor components, recognition action, and degradation byproducts must be non-toxic. For example, glucose oxidase produces hydrogen peroxide as a byproduct of glucose oxidation, but the concomitant oxidative stress is generally on the nano-scale. However, some nanosensor components such as fluorophores discussed in Section 4 are known toxins and could cause acute tissue necrosis. For this reason, many researchers choose to design nanosensors around FDA-approved materials like poly(ε-caprolactone) and imaging agents like fluorescein.
The immune response to nanoparticles is very difficult to eliminate, but it is possible to minimize biocompatibility concerns by taking a `safe-by-design' approach33. For example, size and shape are interdependently affect macrophage adhesion to micro- and nanoparticles34. High aspect ratio particles are particularly prone to macrophage attachment, but non-spherical particles of 6 μm in the largest dimension may reduce macrophage adhesion and have longer functional lifetimes. Nanoparticles injected into tissues are also susceptible to clearance by the neutrophil extracellular trap35 (NET), a tight network of debris that helps to link the innate and adaptive immune responses36. Neutrophils and mast cells contribute to the NET by releasing fibrillar matter into the extracellular space to physically trap pathogens and foreign bodies. This response is also likely to foul an implanted nanoparticle-based sensor and contribute to its clearance. While the biological mechanisms for NET formation are still unclear, there is some evidence that NF-κB inhibitors may prevent NET formation37. So while the innate immune response to implanted nanosensors is a serious design concern, physical (size and shape) and chemical (anti-inflammatory drugs, surface chemistry) design features may minimize nanosensor inflammation, increase biocompatibility, and prolong nanosensor lifetime33.
3.6. Implantation and Removal
Implantation and removal are closely related to biocompatibility because invasive procedures may induce a strong inflammatory response that could confound sensor performance. For this reason, nanosensors that are planar, nano-textured surfaces9c, face an additional challenge with implantation and removal. On the other hand, nanoparticle-based implantable nanosensors must develop strategies to immobilize the nanosensors at the injection site for a prolonged time. Spherical nanoparticles diffuse away within hours18, but high aspect-ratio nanoparticles like microworms7a or nanotubes show much less diffusion away from the implantation site. Implantable hydrogel microbeads also show promise by having a rapid response time and minimal diffusion from the implantation site9e. Some bi-modal drug delivery systems already impregnate implantable hydrogels with particles38, and this configuration could produce a stably-implanted nanosensors.
Removal can be accomplished either by explantation or clearance. Explantation, or the surgical removal of the sensors, can be accomplished with a syringe but that may still leave behind some of the sensor13. Clearance, the physiological process of removing chemicals from the body, can be mediated by immune cells34–35, diffusion from the implantation site7b, or by degradation7c. Nanosensor clearance by diffusion would not necessitate sensor degradation, meaning that none of the sensor components would be released into the surrounding tissue and the nanosensor constructs would remain intact. So long as the sensor has a ratiometric signal, its accuracy should not be compromised by diffusion.
Degradation is more complicated, particularly for polymer nanosensors, since short oligomers and monomers would be released along with the sensor components. Degradable polymer nanoparticles may undergo either bulk or surface erosion depending the polymer degradation rate, rate of water diffusion through the polymer, and nanoparticle size39. Erosion will release sensor components into the injection space, and there is no guarantee that each component releases at a similar rate. Furthermore, sensor accumulation will occur if remnants of expired sensors remain in the body for longer than their operational lifetime and new sensors are repeatedly injected. These problems may be avoided by making design choices around biocompatible components, characterizing nanosensor degradation well, and matching degradation rates with intended operational lifetimes.
4. Sensor Reporters
The readout or detection method is the type of signal (optical, acoustic, magnetic, or electric), and the choice or readout dictates the types of reporters used in an implantable nanosensor. Optical readouts are appealing for transdermal applications since they may be spatially and spectrally multiplexed in arrays of nanosensors that emit at unique wavelengths. However, implanted optical nanosensors can be limited in implantation depth due to light scattering and tissue absorbance of visible light, and tissue autofluorescence must be accounted for when choosing fluorophores18. Since skin absorbs strongly in the UV and short wavelengths, visible to IR-emitting fluorophores are less affected by tissue scattering and autofluorescence but they must still emit efficiently to be workable in vivo.
For one-photon fluorescent excitation, it is convenient to draw distinctions between fluorophores as organic dyes, semiconductor nanocrystals or graphene-based materials, lanthanides, and biological fluorophores. Some of these fluorophore classes are optically appealing but are not currently identified as feasible options for implantable nanosensors. Caged lanthanides have excellent fluorescent properties, and some complexes are environmentally responsive40. However, until a caged lanthanide is demonstrated to be systemically non-toxic, they are not suitable fluorophores for implantable nanosensors. In addition, there seems to be a lack of information regarding the inflammatory effects of biological fluorophores such as GFP. The discussion will therefore be limited to fluorophore classes that are currently feasible options for implantable nanosensors.
Some of the key characteristics for fluorophores include, but are not limited to, their molar extinction coefficient, fluorescence quantum yield, and fluorescence lifetime. The molar extinction coefficient is expressed in units of M−1 cm−1 and can be directly connected to a molecules quantum wave function, though that is beyond the scope here. For the purposes here, it can be viewed for its role in Beer's law, expressed mathematically as
| (Equation 1) |
where A is the absorbance of light in a medium at a particular wavelength, l is the path length that the light travels in that medium, c is the concentration of an absorptive molecule in the medium, and e is the molar extinction coefficient of the absorptive molecule. As is evident from Beer's law, the molar extinction coefficient links the concentration of an absorptive molecule to the measurable absorption of light.
The fluorescence quantum yield is a unit-less number that varies from 0 to 1 or from 0 to 100%. The value represents the rate of emitted photons to absorbed photons. A higher quantum yield means that a fluorophore more efficiently emits fluorescence when excited and will fluoresce brightly. The fluorescence lifetime is the exponential decay time constant for a fluorophore, and it represents the rate at which excited electrons undergo a transition from the excited state to ground state and emit a photon. Fluorescence lifetime is important for nanosensors because fluorescence lifetime requires no normalization and an environmentally-responsive fluorescence lifetime may be used to quantitatively measure an analyte's concentration.
4.1. Organic dyes
For any implantable nanosensor, the photostability or photobleaching can limit the maximum time it can reliably operate in vivo9b. Organic dyes are much more susceptible to photobleaching than semiconductor or lanthanide fluorophores, and they would have shorter operational lifetimes. Some types of organic dyes such as the BODIPY family resist photobleaching much better than others, such as fluoresceins, and their high quantum yields >0.8 can produce efficient fluorescence41. Despite susceptibility to photobleaching, organic dyes still enjoy wide use in nanosensor constructs, in part because of their functional versatility. It is possible to produce a novel biosensor by covalently bonding organic dyes to molecular recognition elements and modulating fluorescence through FRET, charge transfer, or other quenching mechanism42. Fluorophores that have intrinsic and reversible pH- or oxygen-dependent fluorescence can be part of modular sensor designs for ions18, 27 and small molecules18 that does not require FRET or time-gating. Having a relatively simple design and readout can be advantageous, and organic dyes excel on those criteria.
From a safety perspective, organic dyes range from inert to highly toxic. For example, fluorescein does not induce toxic effects until it is administered at 1000's of μg/mg body weight, though its optical properties are non-ideal for in vivo nanosensors43. Macrocyclic fluorophores such as porphyrins and pthalocyanines are optically attractive fluorophores due to their long fluorescent lifetimes, far-red to infra-red emission wavelengths44, large Stokes shifts, and potential environmentally-responsive fluorescence45. However, they would immediately raise concerns as implantable nanosensor components because of their well-known DNA interactions46. There is an extensive body of literature in developing photodynamic therapy reagents based on porphyrins because of the same properties – large extinction coefficients, long fluorescent lifetimes – that make them excellent fluorophores47. If an organic dye can be immobilized or sequestered away from the bio-interface, the more optically-attractive dye may still be feasible for an implantable nanosensor. One such example is the Oxyphore series, which is a Pd-porphyrin with several generations of glutamate grown out from the porphyrin core19a. They are oxygen sensitive and have not caused adverse effects during in vivo oximetry experiments19b.
4.2. Semiconductor fluorophores
Semiconductor fluorophores include semiconductor nanocrystals and non-crystalline semiconductors. Semiconductor nanocrystals, often referred to as quantum dots (QDs) are ultra-small nanoparticles that emit light from the UV to near IR range depending on their size48. They are often made from CdSe, CdTe, and InP and generally also have a thin cap of ZnS to enhance their stability. QDs undergo photobleaching several orders of magnitude slower than organic dyes, and some QDs have fluorescence lifetimes of 100 ns or greater49. Many quantum-dot based biosensors rely on conformation-sensitive FRET50, while others take advantage of QDs intrinsic charge-transfer sensitivity to produce QD-based sensors51. QD-based sensor designs for oxygen and pH have successfully measure those analytes in physiological ranges51–52. The QD sensor that measured pH relied on FRET between the QD and an organic dye although others have used FRET between the QD and protein fluorophores as well. These designs can be calibrated and made ratiometric, but designs with both quantum dots and dyes or proteins are susceptible to significant drift in the ratio of the two readout wavelengths due to large differences in susceptibility to photobleaching.
Silicon nanocrystals, carbon dots, and graphene quantum dots are also nanocrystalline semiconductor fluorophores that have similar optical properties as heavy-metal (e.g., CdSe) quantum dots. Depending on fabrication conditions and excitation wavelengths, they can have long fluorescent lifetimes (>1 μs) and size-dependent optical properties53. While these newer semiconductor fluorophores often have quantum yields between 0.01 and 0.0554, some fabrication improvements are producing fluorophores with quantum yields between 0.2 – 0.5555. With the toxicity of heavy metal quantum dots still unresolved, these three semiconductor fluorophores have the appeal of not eliciting toxic responses in vitro56 and in vivo57 even at relatively high doses. While these materials have strong potential for implantable nanosensors, they have yet to be rigorously tested as implantable nanosensors for continuous physiologic monitoring.
Similar to graphene quantum dots, multi-walled carbon nanotubes (MWCNTs) and single-walled carbon nanotubes (SWCNTs) are carbon semiconductors that have broad excitation and NIR to IR emission peaks, but they have yet to overcome their generally low quantum yields58. Most SWNTs have very short lifetimes, typically <2ns, which, combined with their low quantum yield, makes them poor FRET donors. However, robust absorbers with longer lifetimes like CdSe quantum dots and metal-porphyrins have been shown to be effective FRET donors to SWNTs59, opening up the possibility of FRET-based biosensors. A number of CNT-based, reversible nanosensor platforms have been developed, including nanosensors for glucose9a and reactive oxygen species60. These SWNT-based biosensors have enjoyed popularity in the literature, but they have not been functionally demonstrated in live animals to date. Thus, they are a robust sensor platform for ex vivo sensors but have yet to fulfill the potential of implantable nanosensors.
There is currently debate in the literature regarding the causes of observed carcinogenic effects by carbon nanotubes in vivo61. Jia et al showed that the inflammatory response against SWCNT, MWCNT, and C60 nanoparticles strongly depends on the material type, with C60 nanoparticles eliciting an almost undetectable inflammatory response in a mouse lung model62. Many such studies have focused on the effects of inhaled CNTs on the lung, which is populated by alveolar macrophages that will attack nanoparticles63. Circulating SWNTs are thought to be generally safe, based on mouse models64, but there is evidence that SWNTs may induce thrombogenesis by eliciting calcium currents and activating platelets65. Thus, while some groups have had successes in designing implantable nanosensors around carbon nanotubes9a, there are still considerable safety and durability questions to answer.
Other semiconductor fluorophores like non-crystalline semiconducting polymer-dots (Pdots)17 and upconverting nanocrystals have interesting optical properties for nanosensors66. Both fluorophores have been incorporated into ratiometric nanosensors67, and neither has raised acute toxicity concerns94b, c, 95 although their biocompatibilities are not fully characterized67b, 68. For now, both fluorophores are less widely used as quantum dots or carbon nanotubes, but they each offer unique properties for designing implantable nanosensors. Since their optical properties are largely compatible with near-IR excitation, their long-term prospects will most likely depend on safety and toxicity which needs more study.
4.3. Surface enhanced Raman spectroscopy (SERS) probes
Vibrational spectroscopy has advantages in nanosensors because every bio-analyte will have its own spectroscopic signal. IR spectroscopy can be difficult in vivo because water confounds the signal, but Raman spectroscopy measures a molecule's Raman shift, making it insensitive to the IR signature of water69. The discovery of the surface enhanced Raman effect was a major enabling discover in Raman spectroscopy because surface enhancing Raman spectroscopy (SERS) materials dramatically boost the strength of the Raman signal. SERS-based sensors either can use nanomaterials to enhance the signal for an analyte's Raman spectrum, or they can couple molecules such as 4-mercaptopyridine that have a pH-responsive Raman spectrum as part of a nanosensor construct70. In the second case, additional sensor components such as enzymes or ion chelators would modulate the local pH and that pH change would be measurable in the Raman spectrum.
SERS can also measure analyte concentrations by measuring the strength of the Raman spectrum unique to that analyte. Without any specific recognition elements, the Van Duyne group produced the first in vivo SERS-based glucose sensor with a nano-textured Raman-enhancing surface (Figure 3) and imaging through a transparent tissue window9c. Later, the same group demonstrated in vivo performance for 17 days, indicating that the foreign body response had not cause the sensor to fail9d. SERS offers far-red and near IR excitation9c, d, and it does not require recognition elements. Particle-based SERS nanoprobes have yet to detect glucose or other bio-analytes in vivo, but SERS holds of lot of promise for development of implantable nanosensors.
Figure 3.

SERS-based In vivo glucose sensor. Glucose was measured by its Raman spectrum using a Raman-enhancing nano-textured surface through an optical window. Reproduced from9c, permission pending
4.4. Photoacoustic dyes
Photoacoustics relies on the principle of the photoacoustic effect, reviewed for both microscopy and tomography elsewhere71. Briefly, the energy from an optical excitation source causes an optically absorbing molecule to heat and expand which transmits a pressure wave. As a cellular or sub-cellular imaging mode, photoacoustic imaging lacks the spatial resolution that purely optical imaging techniques can achieve, but cellular resolution is not necessary for taking measurements from implantable nanosensors. While optical imaging in vivo is generally limited to a ~1 mm depth, photoacoustics can achieve greater imaging depth, sometimes several millimeters72. Many of the aforementioned optical sensor chromophores, including carbon nanotubes73, can enhance the photoacoustic contrast. Currently, there are a suite a high-contrast photoacoustic labels74, but even irreversible photoacoustic sensor designs are still only in the early stages of development. Reversible photoacoustic sensors have not yet been demonstrated, and large part of the difficulty is due to the strong photoacoustic background signal from blood and skin pigment75. Currently the main obstacle for implantable photoacoustic nanosensors is the lack of an environmentally-responsive photoacoustic contrast agent that has a sufficiently high and sufficiently dynamic extinction coefficient to provide contrast above the endogenous photoacoustic tissue signal. Hemoglobin absorbs prolifically in the visible range; molar extinction coefficients range from ε > 100,000 cm−1/M for λ = 400–460 nm and ε ~ 30,000 cm−1/M for λ = 500–600 nm76. Fluorescein, a pH-responsive chromophore suitable for a wide range of sensor applications, has ε ~ 90,000 cm−1/M at λ = 496 nm77. With hemoglobin and fluorescein having similar extinction coefficients, and hemoglobin being nearly omnipresent at high concentrations in tissues, the challenge of producing a sufficiently strong photoacoustic sensor signal becomes apparent.
5. Analyte recognition methods
There are three general analyte recognition routes; reversibly non-reactive, reversibly reactive, and irreversible reactive78. Small molecule recognition elements such as crown ether or calixarene ionophores exemplify reversibly non-reactive recognition as they bind and release an ion of interest with no chemical reaction. Boronic acids, which reversibly react to glucose and other saccharides, are among the best known reversible reactive recognition elements. An irreversibly reactive recognition element may be enzymes that cleave a reporter-containing substrate79, thus changing the fluorescent spectrum of the construct. Enzymes may still be part of a reversibly reactive system, and glucose sensors that use glucose oxidase are one such example. The key differentiation is whether or not the recognition element and reporter are reversibly or irreversibly modified. For glucose oxidase-based systems, an oxygen-responsive reporter detects the local change in oxygen concentration due to glucose oxidase activity, but neither the enzyme nor the reporter is modified. Since reversibility has been established as a necessary feature for implantable nanosensors, only recognition methods that result in a reversible nanosensor will be discussed.
Ionophores exemplify reversibly non-reactive recognition elements9a and they selectively bind ions through chelation. Crown ethers are common ionophores, and the number of ether units on the crown contributes to its ion selectivity. An 18-crown chelates potassium while a smaller 15-crown chelates sodium. Substituting a nitrogen into the crown can also modulate the ion selectivity80. Coupling the ionophore to a reporter thus produces an ion indicator through local pH changes25–26, charge transfer80, or FRET81. Nanosensors can also borrow existing recognition elements from the ligand-binding domains of cellular receptors. This approach has worked well for genetically-encoded fluorescent reporters for small molecules such as acetylcholine82, but injectable chemical nanosensors do not benefit from genetic encoding and have not been translated for physiologic monitoring in humans. Practically, it is worth noting that reversibly non-reactive recognition elements will still buffer the bio-analyte's dynamics, but implantable nanosensors should have only a nominal and local effect.
Reversibly reactive recognition elements differ from non-reactive recognition elements in that they form transient bonds with their target analytes. By far the most documented examples of reversibly reactive recognition elements are boronic acid derivatives (Figure 4) and their interactions with saccharides such as glucose. Boronic acids fit into the design criteria for implantable nanosensors because they can reversibly detect glucose in the physiologically-relevant range and at near-neutral pH9a. They bind reversibly to glucose and other saccharides, and the saccharide is un-modified after bond breakage. Another reversibly-reactive design demonstrated by pairing an oxygen-sensitive dye with the enzyme diamino oxidase to detect histamine (Figure 5)18. In both cases, the enzyme recognizes the target analyte, and enzyme activity, which is reversible, is measured with a reporter.
Figure 4.
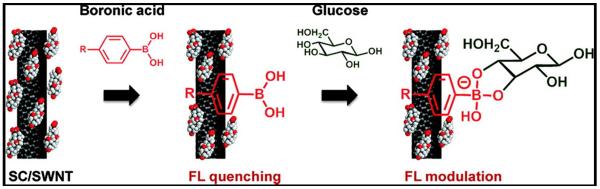
Boronic acids immobilized onto carbon nanotubes are reversibly reactive recognition elements. Glucose binding produces charge transfer to nanotubes and modulates fluorescence Reproduced from9a, permission pending
Figure 5.
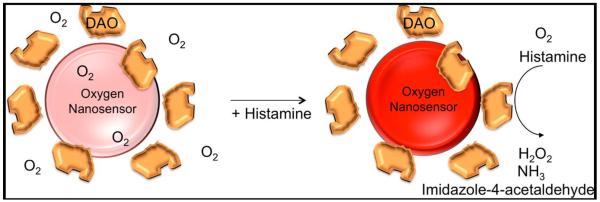
Enzyme-based reversibly reactive nanosenor design. An oxygen-responsive dye detects oxygen consumption by diamino oxidase in the presense of histamine. Oxygen dye returns to baseline fluorescence as histamine is cleared from sensor site. Reproduced from18, permission pending
6. Future Perspective
Designing a viable implantable nanosensor is a daunting task, but the potential impact of such tools could be far-reaching. Implantable nanosensors may contribute to the broad concept of personalized medicine by providing continuous physiologic monitoring and characterizing an individual's personal homeostasis. As a result, diagnosis may be based on detecting deviations from an individual's normal conditions, rather than cohort data. Such a high-impact contribution would require major advancements from the current state of technology as well as large investments into translational research.
In order for such potential to become reality, implantable nanosensors will inevitably need to pass the Food and Drug Administration (FDA) regulatory process. The FDA is collaborating with the inter-agency National Nanotechnology Initiative (NNI) to help formulate its guidelines with respect to many aspects of nanotechnology in the realms of cosmetics, diagnostics, and therapeutics. In fact, the NNI specifically solicited comments from nanosensor stakeholders in the Fall of 2013. These solicitations are likely to open up again and the nanosensor design community must actively partake in these discussions to ensure that regulatory standards are reasonable, achievable, and safe. Furthermore, nanosensor researchers must begin transitioning their nanosensor systems into relevant in vivo pre-clinical models and characterizing the safety and efficacy to provide evidence that safe and accurate nanosensor designs are achievable. Strong engagement in regulatory discussions and strong evidence for safety and efficacy will help de-risk the translation from benchtop research to commercialization by producing clear and reasonable regulations. Given the relative youth of in vivo nanosensor technology and the unclear regulatory environment, it is imperative for nanosensor experts to help guide the conversations and outcomes.
7. Conclusions and future outlook
The technical challenges involved with designing implantable nanosensors are numerous, and noncompliance on one of them will almost certainly result in errant information or adverse effects from toxicity and inflammation. From the choice of reporters and recognition elements to material considerations, all design decisions are critical pieces of the finished product. The design lessons learned over the past decade provide an indication However, the potential impact on patient health outcomes makes implantable nanosensors a promising alternative to single-point measurements.
Acknowledgements
HAC is funded by the NIH through grant numbers R01 GM084366 and R01 NS081641 and by DARPA through grant number D12AP00246. TTR is supported by the NIH through grant number F32 EB015847.
Biographies
Biographies
Tim Ruckh is a NIH Postdoctoral Fellow in the lab of Dr. Heather Clark. He received his degrees from University of Minnesota (B. Eng) and Colorado State University (MS, PhD) and joined Dr. Clark in 2011. His research focuses on designing ratiometric and photostable optical nanosensors that are capable of imaging ion fluxes in neurons.
Heather Clark is an associate professor in the Department of Pharmaceutical Science at Bouvé College, Northeastern University. She obtained her undergraduate and graduate degrees in Chemistry from the University of Michigan with Raoul Kopelman and then completed postdoctoral training at the Center for Biomedical Imaging Technology at the University of Connecticut Health Center with Les Loew. Dr. Clark's research focuses on the development of nanosensors to measure concentrations of ions and small molecules at the cellular and in vivo levels.
Footnotes
Competing Financial Interests None of the authors have any competing financial interests
References
- 1.Erickson KA, Wilding P. Evaluation of a novel point-of-care system, the i-STAT portable clinical analyzer. Clin Chem. 1993;39(2):283–7. [PubMed] [Google Scholar]
- 2.Wang XD, Wolfbeis OS. Fiber-optic chemical sensors and biosensors (2008–2012) Anal Chem. 2013;85(2):487–508. doi: 10.1021/ac303159b. [DOI] [PubMed] [Google Scholar]
- 3.Emerich DF, Thanos CG. The pinpoint promise of nanoparticle-based drug delivery and molecular diagnosis. Biomol Eng. 2006;23(4):171–84. doi: 10.1016/j.bioeng.2006.05.026. [DOI] [PubMed] [Google Scholar]
- 4.Kotanen CN, Moussy FG, Carrara S, Guiseppi-Elie A. Implantable enzyme amperometric biosensors. Biosens Bioelectron. 2012;35(1):14–26. doi: 10.1016/j.bios.2012.03.016. [DOI] [PubMed] [Google Scholar]
- 5.Jo A, Do H, Jhon GJ, Suh M, Lee Y. Electrochemical nanosensor for real-time direct imaging of nitric oxide in living brain. Anal Chem. 2011;83(21):8314–9. doi: 10.1021/ac202225n. [DOI] [PubMed] [Google Scholar]
- 6.Springel T, Laskin B, Shults J, Keren R, Furth S. Longer interdialytic interval and cause-specific hospitalization in children receiving chronic dialysis. Nephrol Dial Transplant. 2013 doi: 10.1093/ndt/gft276. [DOI] [PMC free article] [PubMed] [Google Scholar]
- 7.(a) Ozaydin-Ince G, Dubach JM, Gleason KK, Clark HA. Microworm optode sensors limit particle diffusion to enable in vivo measurements. Proc Natl Acad Sci U S A. 2011;108(7):2656–61. doi: 10.1073/pnas.1015544108. [DOI] [PMC free article] [PubMed] [Google Scholar]; (b) Dubach JM, Lim E, Zhang N, Francis KP, Clark H. In vivo sodium concentration continuously monitored with fluorescent sensors. Integr Biol (Camb) 2011;3(2):142–8. doi: 10.1039/c0ib00020e. [DOI] [PubMed] [Google Scholar]; (c) Balaconis MK, Clark HA. Biodegradable optode-based nanosensors for in vivo monitoring. Anal Chem. 2012;84(13):5787–93. doi: 10.1021/ac301137c. [DOI] [PMC free article] [PubMed] [Google Scholar]
- 8.Wu P, He Y, Wang HF, Yan XP. Conjugation of glucose oxidase onto Mn-doped ZnS quantum dots for phosphorescent sensing of glucose in biological fluids. Anal Chem. 2010;82(4):1427–33. doi: 10.1021/ac902531g. [DOI] [PubMed] [Google Scholar]
- 9.(a) Yum K, Ahn JH, McNicholas TP, Barone PW, Mu B, Kim JH, Jain RM, Strano MS. Boronic acid library for selective, reversible near-infrared fluorescence quenching of surfactant suspended single-walled carbon nanotubes in response to glucose. ACS Nano. 2012;6(1):819–30. doi: 10.1021/nn204323f. [DOI] [PubMed] [Google Scholar]; (b) Barone PW, Parker RS, Strano MS. In vivo fluorescence detection of glucose using a single-walled carbon nanotube optical sensor: design, fluorophore properties, advantages, and disadvantages. Anal Chem. 2005;77(23):7556–62. doi: 10.1021/ac0511997. [DOI] [PubMed] [Google Scholar]; (c) Stuart DA, Yuen JM, Shah N, Lyandres O, Yonzon CR, Glucksberg MR, Walsh JT, Van Duyne RP. In vivo glucose measurement by surface-enhanced Raman spectroscopy. Anal Chem. 2006;78(20):7211–5. doi: 10.1021/ac061238u. [DOI] [PubMed] [Google Scholar]; (d) Ma K, Yuen JM, Shah NC, Walsh JT, Jr., Glucksberg MR, Van Duyne RP. In vivo, transcutaneous glucose sensing using surface-enhanced spatially offset Raman spectroscopy: multiple rats, improved hypoglycemic accuracy, low incident power, and continuous monitoring for greater than 17 days. Anal Chem. 2011;83(23):9146–52. doi: 10.1021/ac202343e. [DOI] [PMC free article] [PubMed] [Google Scholar]; (e) Shibata H, Heo YJ, Okitsu T, Matsunaga Y, Kawanishi T, Takeuchi S. Injectable hydrogel microbeads for fluorescence-based in vivo continuous glucose monitoring. Proc Natl Acad Sci U S A. 2010;107(42):17894–8. doi: 10.1073/pnas.1006911107. [DOI] [PMC free article] [PubMed] [Google Scholar]
- 10.Garg SK, Smith J, Beatson C, Lopez-Baca B, Voelmle M, Gottlieb PA. Comparison of accuracy and safety of the SEVEN and the Navigator continuous glucose monitoring systems. Diabetes Technol Ther. 2009;11(2):65–72. doi: 10.1089/dia.2008.0109. [DOI] [PubMed] [Google Scholar]
- 11.Newman S, Cooke D, Casbard A, Walker S, Meredith S, Nunn A, Steed L, Manca A, Sculpher M, Barnard M. Comparison of minimally invasive glucose monitoring devices with conventional monitoring in MITRE. Health Technology Assessment. 2009;13(28) doi: 10.3310/hta13280. [DOI] [PubMed] [Google Scholar]
- 12.Nichols SP, Koh A, Storm WL, Shin JH, Schoenfisch MH. Biocompatible materials for continuous glucose monitoring devices. Chem Rev. 2013;113(4):2528–49. doi: 10.1021/cr300387j. [DOI] [PMC free article] [PubMed] [Google Scholar]
- 13.Heo YJ, Shibata H, Okitsu T, Kawanishi T, Takeuchi S. Long-term in vivo glucose monitoring using fluorescent hydrogel fibers. Proc Natl Acad Sci U S A. 2011;108(33):13399–403. doi: 10.1073/pnas.1104954108. [DOI] [PMC free article] [PubMed] [Google Scholar]
- 14.Balaconis MK, Billingsley K, Dubach MJ, Cash KJ, Clark HA. The design and development of fluorescent nano-optodes for in vivo glucose monitoring. J Diabetes Sci Technol. 2011;5(1):68–75. doi: 10.1177/193229681100500110. [DOI] [PMC free article] [PubMed] [Google Scholar]
- 15.Balaconis MK, Clark HA. Gel encapsulation of glucose nanosensors for prolonged in vivo lifetime. J Diabetes Sci Technol. 2013;7(1):53–61. doi: 10.1177/193229681300700107. [DOI] [PMC free article] [PubMed] [Google Scholar]
- 16.Singh S, McShane M. Role of porosity in tuning the response range of microsphere-based glucose sensors. Biosens Bioelectron. 2011;26(5):2478–83. doi: 10.1016/j.bios.2010.10.036. [DOI] [PMC free article] [PubMed] [Google Scholar]
- 17.Pu K, Shuhendler AJ, Rao J. Semiconducting Polymer Nanoprobe for In Vivo Imaging of Reactive Oxygen and Nitrogen Species. Angewandte Chemie International Edition. 2013 doi: 10.1002/anie.201303420. n/a-n/a. [DOI] [PMC free article] [PubMed] [Google Scholar]
- 18.Cash KJ, Clark HA. Phosphorescent nanosensors for in vivo tracking of histamine levels. Anal Chem. 2013;85(13):6312–8. doi: 10.1021/ac400575u. [DOI] [PMC free article] [PubMed] [Google Scholar]
- 19.(a) Dunphy I, Vinogradov SA, Wilson DF. Oxyphor R2 and G2: phosphors for measuring oxygen by oxygen-dependent quenching of phosphorescence. Anal Biochem. 2002;310(2):191–8. doi: 10.1016/s0003-2697(02)00384-6. [DOI] [PubMed] [Google Scholar]; (b) Esipova TV, Karagodov A, Miller J, Wilson DF, Busch TM, Vinogradov SA. Two new “protected” oxyphors for biological oximetry: properties and application in tumor imaging. Anal Chem. 2011;83(22):8756–65. doi: 10.1021/ac2022234. [DOI] [PMC free article] [PubMed] [Google Scholar]
- 20.Doussineau T, Schulz A, Lapresta-Fernandez A, Moro A, Korsten S, Trupp S, Mohr GJ. On the design of fluorescent ratiometric nanosensors. Chemistry. 2010;16(34):10290–9. doi: 10.1002/chem.201000829. [DOI] [PubMed] [Google Scholar]
- 21.(a) Chauhan VM, Orsi G, Brown A, Pritchard DI, Aylott JW. Mapping the pharyngeal and intestinal pH of Caenorhabditis elegans and real-time luminal pH oscillations using extended dynamic range pH-sensitive nanosensors. ACS Nano. 2013;7(6):5577–87. doi: 10.1021/nn401856u. [DOI] [PubMed] [Google Scholar]; (b) Ndukum J, Fonseca LL, Santos H, Voit EO, Datta S. Statistical inference methods for sparse biological time series data. BMC Syst Biol. 2011;5:57. doi: 10.1186/1752-0509-5-57. [DOI] [PMC free article] [PubMed] [Google Scholar]
- 22.Tarn MD, Pamme N. Microfluidic platforms for performing surface-based clinical assays. Expert Rev Mol Diagn. 2011;11(7):711–20. doi: 10.1586/erm.11.59. [DOI] [PubMed] [Google Scholar]
- 23.Cheng S, Rico-Jimenez JJ, Jabbour J, Malik B, Maitland KC, Wright J, Cheng YS, Jo JA. Flexible endoscope for continuous in vivo multispectral fluorescence lifetime imaging. Opt Lett. 2013;38(9):1515–7. doi: 10.1364/OL.38.001515. [DOI] [PMC free article] [PubMed] [Google Scholar]
- 24.Xu C, Bakker E. Multicolor quantum dot encoding for polymeric particle-based optical ion sensors. Anal Chem. 2007;79(10):3716–23. doi: 10.1021/ac0701233. [DOI] [PubMed] [Google Scholar]
- 25.Bakker E, Meruva RK, Pretsch E, Meyerhoff ME. Selectivity of polymer membrane-based ion-selective electrodes: self-consistent model describing the potentiometric response in mixed ion solutions of different charge. Anal Chem. 1994;66(19):3021–30. doi: 10.1021/ac00091a600. [DOI] [PubMed] [Google Scholar]
- 26.Bakker E, Simon W. Selectivity of ion-sensitive bulk optodes. Analytical Chemistry. 1992;64(17):1805–1812. [Google Scholar]
- 27.Clark HA, Hoyer M, Philbert MA, Kopelman R. Optical nanosensors for chemical analysis inside single living cells. 1. Fabrication, characterization, and methods for intracellular delivery of PEBBLE sensors. Anal Chem. 1999;71(21):4831–6. doi: 10.1021/ac990629o. [DOI] [PubMed] [Google Scholar]
- 28.Nair PR, Alam MA. Performance limits of nanobiosensors. Applied Physics Letters. 2006;88(23):233120–233120-3. [Google Scholar]
- 29.Boyne MS, Silver DM, Kaplan J, Saudek CD. Timing of changes in interstitial and venous blood glucose measured with a continuous subcutaneous glucose sensor. Diabetes. 2003;52(11):2790–4. doi: 10.2337/diabetes.52.11.2790. [DOI] [PubMed] [Google Scholar]
- 30.Keenan DB, Mastrototaro JJ, Voskanyan G, Steil GM. Delays in minimally invasive continuous glucose monitoring devices: a review of current technology. J Diabetes Sci Technol. 2009;3(5):1207–14. doi: 10.1177/193229680900300528. [DOI] [PMC free article] [PubMed] [Google Scholar]
- 31.Sun TY, Lee KE, Kendrick-Jones JC, Marshall MR. Ethnic differences in creatinine kinetics in a New Zealand end-stage kidney disease cohort. Nephrology (Carlton) 2013;18(3):222–8. doi: 10.1111/nep.12030. [DOI] [PubMed] [Google Scholar]
- 32.Wisniewski N, Reichert M. Methods for reducing biosensor membrane biofouling. Colloids Surf B Biointerfaces. 2000;18(3–4):197–219. doi: 10.1016/s0927-7765(99)00148-4. [DOI] [PubMed] [Google Scholar]
- 33.Boraschi D, Costantino L, Italiani P. Interaction of nanoparticles with immunocompetent cells: nanosafety considerations. Nanomedicine (Lond) 2012;7(1):121–31. doi: 10.2217/nnm.11.169. [DOI] [PubMed] [Google Scholar]
- 34.Lin SY, Hsu WH, Lo JM, Tsai HC, Hsiue GH. Novel geometry type of nanocarriers mitigated the phagocytosis for drug delivery. J Control Release. 2011;154(1):84–92. doi: 10.1016/j.jconrel.2011.04.023. [DOI] [PubMed] [Google Scholar]
- 35.Bartneck M, Keul HA, Zwadlo-Klarwasser G, Groll J. Phagocytosis independent extracellular nanoparticle clearance by human immune cells. Nano Lett. 2010;10(1):59–63. doi: 10.1021/nl902830x. [DOI] [PubMed] [Google Scholar]
- 36.Tillack K, Breiden P, Martin R, Sospedra M. T lymphocyte priming by neutrophil extracellular traps links innate and adaptive immune responses. J Immunol. 2012;188(7):3150–9. doi: 10.4049/jimmunol.1103414. [DOI] [PubMed] [Google Scholar]
- 37.Lapponi MJ, Carestia A, Landoni VI, Rivadeneyra L, Etulain J, Negrotto S, Pozner RG, Schattner M. Regulation of neutrophil extracellular trap formation by anti-inflammatory drugs. J Pharmacol Exp Ther. 2013;345(3):430–7. doi: 10.1124/jpet.112.202879. [DOI] [PubMed] [Google Scholar]
- 38.Chen FM, Zhang M, Wu ZF. Toward delivery of multiple growth factors in tissue engineering. Biomaterials. 2010;31(24):6279–308. doi: 10.1016/j.biomaterials.2010.04.053. [DOI] [PubMed] [Google Scholar]
- 39.von Burkersroda F, Schedl L, Gopferich A. Why degradable polymers undergo surface erosion or bulk erosion. Biomaterials. 2002;23(21):4221–31. doi: 10.1016/s0142-9612(02)00170-9. [DOI] [PubMed] [Google Scholar]
- 40.Liu M, Ye Z, Xin C, Yuan J. Development of a ratiometric time-resolved luminescence sensor for pH based on lanthanide complexes. Anal Chim Acta. 2013;761:149–56. doi: 10.1016/j.aca.2012.11.025. [DOI] [PubMed] [Google Scholar]
- 41.Karolin J, Johansson LBA, Strandberg L, Ny T. Fluorescence and Absorption Spectroscopic Properties of Dipyrrometheneboron Difluoride (BODIPY) Derivatives in Liquids, Lipid Membranes, and Proteins. Journal of the American Chemical Society. 1994;116(17):7801–7806. [Google Scholar]
- 42.Collot M, Loukou C, Yakovlev AV, Wilms CD, Li D, Evrard A, Zamaleeva A, Bourdieu L, Leger JF, Ropert N, Eilers J, Oheim M, Feltz A, Mallet JM. Calcium rubies: a family of red-emitting functionalizable indicators suitable for two-photon Ca2+ imaging. J Am Chem Soc. 2012;134(36):14923–31. doi: 10.1021/ja304018d. [DOI] [PubMed] [Google Scholar]
- 43.Alford R, Simpson HM, Duberman J, Hill GC, Ogawa M, Regino C, Kobayashi H, Choyke PL. Toxicity of Organic Fluorophores Used in Molecular Imaging: Literature Review. Molecular Imaging. 2009;8(6):341–354. [PubMed] [Google Scholar]
- 44.Kamat NP, Liao Z, Moses LE, Rawson J, Therien MJ, Dmochowski IJ, Hammer DA. Sensing membrane stress with near IR-emissive porphyrins. Proc Natl Acad Sci U S A. 2011;108(34):13984–9. doi: 10.1073/pnas.1102125108. [DOI] [PMC free article] [PubMed] [Google Scholar]
- 45.Wang XD, Stolwijk JA, Lang T, Sperber M, Meier RJ, Wegener J, Wolfbeis OS. Ultra-small, highly stable, and sensitive dual nanosensors for imaging intracellular oxygen and pH in cytosol. J Am Chem Soc. 2012;134(41):17011–4. doi: 10.1021/ja308830e. [DOI] [PubMed] [Google Scholar]
- 46.Zhao P, Xu LC, Huang JW, Zheng KC, Fu B, Yu HC, Ji LN. Tricationic pyridium porphyrins appending different peripheral substituents: experimental and DFT studies on their interactions with DNA. Biophys Chem. 2008;135(1–3):102–9. doi: 10.1016/j.bpc.2008.03.013. [DOI] [PubMed] [Google Scholar]
- 47.Pansare V, Hejazi S, Faenza W, Prud'homme RK. Review of Long-Wavelength Optical and NIR Imaging Materials: Contrast Agents, Fluorophores and Multifunctional Nano Carriers. Chem Mater. 2012;24(5):812–827. doi: 10.1021/cm2028367. [DOI] [PMC free article] [PubMed] [Google Scholar]
- 48.Smith AM, Nie S. Semiconductor nanocrystals: structure, properties, and band gap engineering. Acc Chem Res. 2010;43(2):190–200. doi: 10.1021/ar9001069. [DOI] [PMC free article] [PubMed] [Google Scholar]
- 49.Cassette E, Helle M, Bezdetnaya L, Marchal F, Dubertret B, Pons T. Design of new quantum dot materials for deep tissue infrared imaging. Adv Drug Deliv Rev. 2013;65(5):719–31. doi: 10.1016/j.addr.2012.08.016. [DOI] [PubMed] [Google Scholar]
- 50.Dennis AM, Rhee WJ, Sotto D, Dublin SN, Bao G. Quantum dot-fluorescent protein FRET probes for sensing intracellular pH. ACS Nano. 2012;6(4):2917–24. doi: 10.1021/nn2038077. [DOI] [PMC free article] [PubMed] [Google Scholar]
- 51.Ji X, Palui G, Avellini T, Na HB, Yi C, Knappenberger KL, Jr., Mattoussi H. On the pH-dependent quenching of quantum dot photoluminescence by redox active dopamine. J Am Chem Soc. 2012;134(13):6006–17. doi: 10.1021/ja300724x. [DOI] [PubMed] [Google Scholar]
- 52.Li DW, Qin LX, Li Y, Nia RP, Long YT, Chen HY. CdSe/ZnS quantum dot-Cytochrome c bioconjugates for selective intracellular O2 (−) sensing. Chem Commun (Camb) 2011;47(30):8539–41. doi: 10.1039/c1cc13160e. [DOI] [PubMed] [Google Scholar]
- 53.(a) Mueller ML, Yan X, McGuire JA, Li LS. Triplet States and electronic relaxation in photoexcited graphene quantum dots. Nano Lett. 2010;10(7):2679–82. doi: 10.1021/nl101474d. [DOI] [PubMed] [Google Scholar]; (b) Mastronardi ML, Maier-Flaig F, Faulkner D, Henderson EJ, Kubel C, Lemmer U, Ozin GA. Size-dependent absolute quantum yields for size-separated colloidally-stable silicon nanocrystals. Nano Lett. 2012;12(1):337–42. doi: 10.1021/nl2036194. [DOI] [PubMed] [Google Scholar]; (c) Sun YP, Zhou B, Lin Y, Wang W, Fernando KA, Pathak P, Meziani MJ, Harruff BA, Wang X, Wang H, Luo PG, Yang H, Kose ME, Chen B, Veca LM, Xie SY. Quantum-sized carbon dots for bright and colorful photoluminescence. J Am Chem Soc. 2006;128(24):7756–7. doi: 10.1021/ja062677d. [DOI] [PubMed] [Google Scholar]
- 54.Sun Y, Wang S, Li C, Luo P, Tao L, Wei Y, Shi G. Large scale preparation of graphene quantum dots from graphite with tunable fluorescence properties. Phys Chem Chem Phys. 2013;15(24):9907–13. doi: 10.1039/c3cp50691f. [DOI] [PubMed] [Google Scholar]
- 55.Wu X, Tian F, Wang W, Chen J, Wu M, Zhao JX. Fabrication of highly fluorescent graphene quantum dots using l-glutamic acid for in vitro/in vivo imaging and sensing. Journal of Materials Chemistry C. 2013;1(31):4676–4684. doi: 10.1039/C3TC30820K. [DOI] [PMC free article] [PubMed] [Google Scholar]
- 56.Erogbogbo F, Yong KT, Roy I, Xu G, Prasad PN, Swihart MT. Biocompatible luminescent silicon quantum dots for imaging of cancer cells. ACS Nano. 2008;2(5):873–8. doi: 10.1021/nn700319z. [DOI] [PMC free article] [PubMed] [Google Scholar]
- 57.Nurunnabi M, Khatun Z, Huh KM, Park SY, Lee DY, Cho KJ, Lee YK. In Vivo Biodistribution and Toxicology of Carboxylated Graphene Quantum Dots. ACS Nano. 2013 doi: 10.1021/nn402043c. [DOI] [PubMed] [Google Scholar]
- 58.O'Connell MJ, Bachilo SM, Huffman CB, Moore VC, Strano MS, Haroz EH, Rialon KL, Boul PJ, Noon WH, Kittrell C, Ma J, Hauge RH, Weisman RB, Smalley RE. Band gap fluorescence from individual single-walled carbon nanotubes. Science. 2002;297(5581):593–6. doi: 10.1126/science.1072631. [DOI] [PubMed] [Google Scholar]
- 59.Shafran E, Mangum BD, Gerton JM. Energy transfer from an individual quantum dot to a carbon nanotube. Nano Lett. 2010;10(10):4049–54. doi: 10.1021/nl102045g. [DOI] [PubMed] [Google Scholar]
- 60.Jin H, Heller DA, Kalbacova M, Kim JH, Zhang J, Boghossian AA, Maheshri N, Strano MS. Detection of single-molecule H2O2 signalling from epidermal growth factor receptor using fluorescent single-walled carbon nanotubes. Nat Nanotechnol. 2010;5(4):302–9. doi: 10.1038/nnano.2010.24. [DOI] [PMC free article] [PubMed] [Google Scholar]
- 61.Poland CA, Duffin R, Kinloch I, Maynard A, Wallace WA, Seaton A, Stone V, Brown S, Macnee W, Donaldson K. Carbon nanotubes introduced into the abdominal cavity of mice show asbestos-like pathogenicity in a pilot study. Nat Nanotechnol. 2008;3(7):423–8. doi: 10.1038/nnano.2008.111. [DOI] [PubMed] [Google Scholar]
- 62.Jia G, Wang H, Yan L, Wang X, Pei R, Yan T, Zhao Y, Guo X. Cytotoxicity of carbon nanomaterials: single-wall nanotube, multi-wall nanotube, and fullerene. Environ Sci Technol. 2005;39(5):1378–83. doi: 10.1021/es048729l. [DOI] [PubMed] [Google Scholar]
- 63.Shinohara N, Nakazato T, Tamura M, Endoh S, Fukui H, Morimoto Y, Myojo T, Shimada M, Yamamoto K, Tao H, Yoshida Y, Nakanishi J. Clearance kinetics of fullerene C(6)(0) nanoparticles from rat lungs after intratracheal C(6)(0) instillation and inhalation C(6)(0) exposure. Toxicol Sci. 2010;118(2):564–73. doi: 10.1093/toxsci/kfq288. [DOI] [PubMed] [Google Scholar]
- 64.Liu Z, Davis C, Cai W, He L, Chen X, Dai H. Circulation and long-term fate of functionalized, biocompatible single-walled carbon nanotubes in mice probed by Raman spectroscopy. Proc Natl Acad Sci U S A. 2008;105(5):1410–5. doi: 10.1073/pnas.0707654105. [DOI] [PMC free article] [PubMed] [Google Scholar]
- 65.Semberova J, De Paoli Lacerda SH, Simakova O, Holada K, Gelderman MP, Simak J. Carbon nanotubes activate blood platelets by inducing extracellular Ca2+ influx sensitive to calcium entry inhibitors. Nano Lett. 2009;9(9):3312–7. doi: 10.1021/nl901603k. [DOI] [PubMed] [Google Scholar]
- 66.Zhang C, Yuan Y, Zhang S, Wang Y, Liu Z. Biosensing platform based on fluorescence resonance energy transfer from upconverting nanocrystals to graphene oxide. Angew Chem Int Ed Engl. 2011;50(30):6851–4. doi: 10.1002/anie.201100769. [DOI] [PubMed] [Google Scholar]
- 67.(a) Ye F, Wu C, Jin Y, Chan YH, Zhang X, Chiu DT. Ratiometric temperature sensing with semiconducting polymer dots. J Am Chem Soc. 2011;133(21):8146–9. doi: 10.1021/ja202945g. [DOI] [PMC free article] [PubMed] [Google Scholar]; (b) Dong B, Cao B, He Y, Liu Z, Li Z, Feng Z. Temperature sensing and in vivo imaging by molybdenum sensitized visible upconversion luminescence of rare-earth oxides. Adv Mater. 2012;24(15):1987–93. doi: 10.1002/adma.201200431. [DOI] [PubMed] [Google Scholar]
- 68.Wu C, Hansen SJ, Hou Q, Yu J, Zeigler M, Jin Y, Burnham DR, McNeill JD, Olson JM, Chiu DT. Design of highly emissive polymer dot bioconjugates for in vivo tumor targeting. Angew Chem Int Ed Engl. 2011;50(15):3430–4. doi: 10.1002/anie.201007461. [DOI] [PMC free article] [PubMed] [Google Scholar]
- 69.Stiles PL, Dieringer JA, Shah NC, Van Duyne RP. Surface-enhanced Raman spectroscopy. Annu Rev Anal Chem (Palo Alto Calif) 2008;1:601–26. doi: 10.1146/annurev.anchem.1.031207.112814. [DOI] [PubMed] [Google Scholar]
- 70.Nowak-Lovato KL, Rector KD. Targeted surface-enhanced Raman scattering nanosensors for whole-cell pH imagery. Appl Spectrosc. 2009;63(4):387–95. doi: 10.1366/000370209787944406. [DOI] [PubMed] [Google Scholar]
- 71.Wang LV, Hu S. Photoacoustic tomography: in vivo imaging from organelles to organs. Science. 2012;335(6075):1458–62. doi: 10.1126/science.1216210. [DOI] [PMC free article] [PubMed] [Google Scholar]
- 72.Zhang HF, Maslov K, Wang LV. In vivo imaging of subcutaneous structures using functional photoacoustic microscopy. Nat Protoc. 2007;2(4):797–804. doi: 10.1038/nprot.2007.108. [DOI] [PubMed] [Google Scholar]
- 73.Zhang HF, Maslov K, Stoica G, Wang LV. Functional photoacoustic microscopy for high-resolution and noninvasive in vivo imaging. Nat Biotechnol. 2006;24(7):848–51. doi: 10.1038/nbt1220. [DOI] [PubMed] [Google Scholar]
- 74.Cai X, Paratala BS, Hu S, Sitharaman B, Wang LV. Multiscale photoacoustic microscopy of single-walled carbon nanotube-incorporated tissue engineering scaffolds. Tissue Eng Part C Methods. 2012;18(4):310–7. doi: 10.1089/ten.tec.2011.0519. [DOI] [PMC free article] [PubMed] [Google Scholar]
- 75.Dragulescu-Andrasi A, Kothapalli SR, Tikhomirov GA, Rao J, Gambhir SS. Activatable oligomerizable imaging agents for photoacoustic imaging of furin-like activity in living subjects. J Am Chem Soc. 2013;135(30):11015–22. doi: 10.1021/ja4010078. [DOI] [PMC free article] [PubMed] [Google Scholar]
- 76.Oh JT, Li ML, Zhang HF, Maslov K, Stoica G, Wang LV. Three-dimensional imaging of skin melanoma in vivo by dual-wavelength photoacoustic microscopy. J Biomed Opt. 2006;11(3):34032. doi: 10.1117/1.2210907. [DOI] [PubMed] [Google Scholar]
- 77.Ansari AA, Mohajerani E. Mechanisms of laser-tissue interaction: I. Optical properties of tissue. J. Lasers MedSci. 2011;2(3):119–125. [Google Scholar]
- 78.Cho B, Tiwari V, Jonas DM. Simultaneous all-optical determination of molecular concentration and extinction coefficient. Anal Chem. 2013;85(11):5514–21. doi: 10.1021/ac400656r. [DOI] [PubMed] [Google Scholar]
- 79.Nahrendorf M, Waterman P, Thurber G, Groves K, Rajopadhye M, Panizzi P, Marinelli B, Aikawa E, Pittet MJ, Swirski FK, Weissleder R. Hybrid in vivo FMT-CT imaging of protease activity in atherosclerosis with customized nanosensors. Arterioscler Thromb Vasc Biol. 2009;29(10):1444–51. doi: 10.1161/ATVBAHA.109.193086. [DOI] [PMC free article] [PubMed] [Google Scholar]
- 80.Minta A, Tsien RY. Fluorescent indicators for cytosolic sodium. J Biol Chem. 1989;264(32):19449–57. [PubMed] [Google Scholar]
- 81.Chen CY, Cheng CT, Lai CW, Wu PW, Wu KC, Chou PT, Chou YH, Chiu HT. Potassium ion recognition by 15-crown-5 functionalized CdSe/ZnS quantum dots in H2O. Chem Commun (Camb) 2006;(3):263–5. doi: 10.1039/b512677k. [DOI] [PubMed] [Google Scholar]
- 82.Chang S, Ross EM. Activation biosensor for G protein-coupled receptors: a FRET-based m1 muscarinic activation sensor that regulates G(q) PLoS One. 2012;7(9):e45651. doi: 10.1371/journal.pone.0045651. [DOI] [PMC free article] [PubMed] [Google Scholar]