Abstract
There are no clinically relevant treatments available that improve function in the growing population of very preterm infants (<32 weeks gestation) with neonatal brain injury. Diffuse white matter injury (DWMI) is a common finding in these children and results in chronic neurodevelopmental impairments1,2. As shown recently, failure in oligodendrocyte progenitor cell maturation contributes to DWMI3. In a previous study, we demonstrated that epidermal growth factor receptor (EGFR) plays an important role in oligodendrocyte development4. Here, we examine whether enhanced epidermal growth factor receptor (EGFR) signaling stimulates the endogenous response of EGFR-expressing progenitor cells during a critical period after brain injury, and promotes cellular and behavioral recovery in the developing brain. Using an established model of very preterm brain injury, we demonstrate that selective overexpression of human (h)EGFR in oligodendrocyte lineage cells or the administration of intranasal heparin binding EGF immediately after injury decreases oligodendroglia death, enhances generation of new oligodendrocytes from progenitor cells (OPCs) and promotes functional recovery. Furthermore, these interventions diminish ultrastructural abnormalities and alleviate behavioral deficits on white matter-specific paradigms. Inhibition of EGFR signaling with a molecularly targeted agent used for cancer therapy demonstrates that EGFR activation is an important contributor to oligodendrocyte regeneration and functional recovery after DWMI. Thus, our study provides direct evidence that targeting EGFR in OPCs at a specific time after injury is clinically feasible and applicable for the treatment of premature children with white matter injury.
Chronic neonatal hypoxia (Hyp) is a clinically relevant model of premature brain injury caused by insufficient gas exchange from poor lung development5. This ‘hypoxic’ state is a major contributor to DWMI – a common finding in infants born very preterm (VPT), resulting in sensori-motor deficits that persist throughout their lifetime1,2,6. We used a mouse model of chronic Hyp, which replicates DWMI and other neuropathologic hallmarks of brain injury resulting from premature birth7–9.
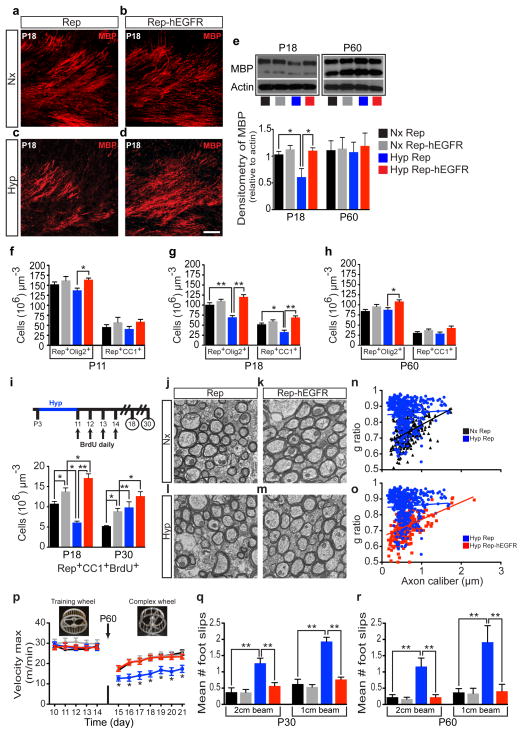
The cellular and molecular mechanisms underlying DWMI in VPT children - and in Hyp - are unknown. It has been previously demonstrated that enhanced EGFR signaling in WM OL lineage cells promotes their proliferation, migration, myelination and remyelination in the adult4,10. We observed a significant increase in endogenous EGF levels in WM after Hyp (Extended Data Fig. 1). Therefore, we compared OL development in WM injury and recovery in 2′,3′-cyclic nucleotide 3′-phosphodiesterase (CNP) enhanced fluorescent green protein (GFP) mice (Rep mice) and Rep mice in which hEGFR was overexpressed in the OL lineage under the CNP promoter (Rep-hEGFR mice)4,11–13. Hyp decreased myelin basic protein (MBP) expression in WM of Rep mice, but not in Rep-hEGFR mice (Fig. 1a–e). At P60, MBP expression recovered in the Hyp Rep group (Fig. 1e). At P11, Hyp did not cause any change in the number of Rep+Olig2+ cells and mature (Rep+CC1+) OLs (Fig. 1f). At P18, we observed a decrease in Rep+Olig2+ and Rep+CC1+ OLs in the WM of Hyp Rep mice (Fig. 1g), but no change in the Rep-hEGFR mice. OL recovery was evident by P60 in the Hyp Rep group (Fig. 1h).
Figure 1. Enhanced EGFR expression in oligodendrocyte lineage cells prevents oligodendrocyte and myelin loss, and ultrastructural and behavioral deficits caused by neonatal hypoxia.
a–d, Confocal images of WM immunostained for MBP. e, Western blot of WM tissue (n=4 mice per group and per age except P18 Nx and Hyp n=5; One-way ANOVA, Bonferroni post hoc test for individual comparisons). f–h, Number of Rep+Olig2+ and Rep+CC1+ cells. i, Number of newly-generated OLs in WM. f–i, n=4 mice per group and per age; One-way ANOVA, Bonferroni post hoc test for individual comparisons. j–m, EM images from P60 WM. n,o, Scatter plots of g-ratios of individual axons relative to axon diameters (n=3 mice per group; One-way ANOVA of all 4 groups with a post hoc unpaired t-tests). p, Vmax (meters/minutes) over time (days) on the complex wheel (linear regression comparison of slopes between all 4 groups; post hoc comparison of individual days between groups, Nx Rep n=12, Nx Rep-hEGFR n=9, Hyp Rep n=12, Hyp Rep-hEGFR n=10). q, Naïve mice were tested on the 2 and 1cm-width inclined beam-walking (Poisson multiple regression analysis, Nx Rep n=8, Nx Rep-hEGFR n=10, Hyp Rep n=10, Hyp Rep-hEGFR n=10). r, A separate group of naïve mice was assessed (Poisson multiple regression analysis, Nx Rep n=9, Nx Rep-hEGFR n=8, Hyp Rep n=10, Hyp Rep-hEGFR n=9). Line-graph and histograms are presented as means ± s.e.m. *P<0.05; **P<0.01. Scale bar, 50μm.
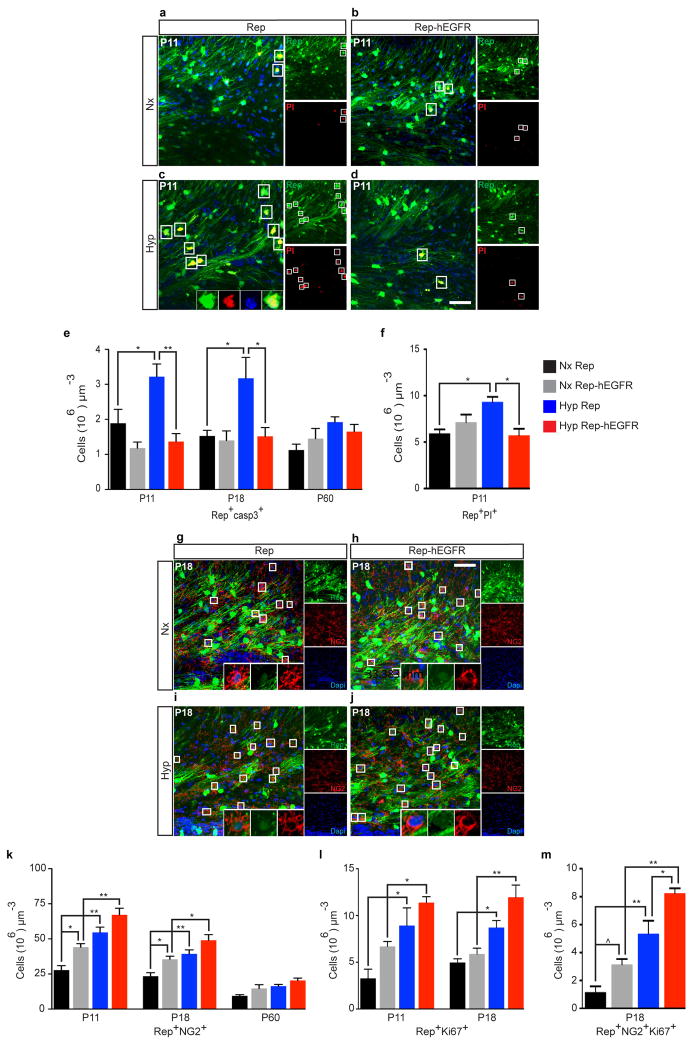
There was an increase in apoptosis of OL lineage cells in Rep mice after Hyp at P11 and P18, but no change at P60 (Extended Data Fig. 2e). No significant apoptosis was observed in Rep-hEGFR mice (Extended Data Fig. 2e). Hyp caused an increase in the number of Propidium Iodide (PI)+ cells (data not shown) and Rep+PI+ cells (Extended Data Fig. 2a–d, f). This increase was not observed in Rep-hEGFR mice. These results indicate that enhanced EGFR expression prevents OL loss by decreasing cell death after Hyp.
We next assessed the effects of Hyp on OL progenitor (Rep+NG2+) cells (OPCs) in WM (Extended Data Fig. 2g–k). Enhanced hEGFR expression caused an increase in Rep+NG2+ OPCs at P11 and P18 (Extended Data Fig. 2k; Nx Rep vs. Nx Rep-hEGFR). Hyp caused a significant increase in WM OPCs in both Rep and Rep-hEGFR mice at the same ages (Extended Data Fig. 2k). Similar findings were obtained after assessing proliferation of Rep+ OL lineage cells (Extended Data Fig. 2l). Enhanced hEGFR expression increased Rep+NG2+ OPC proliferation in Nx, and had an additive effect on Hyp-induced OPC proliferation (Extended Data Fig. 2m). Enhanced hEGFR expression increased oligodendrogenesis at P18, but, at P30, no difference was evident between Hyp Rep and Hyp Rep-hEGFR (Fig. 1i). These results indicate that enhanced hEGFR expression in OLs promoted generation of new OLs after Hyp.
We used electron microscopy (EM) to determine whether Hyp caused myelination abnormalities, and to assess whether EGFR overexpression rescued these abnormalities. (Fig. 1j–o). At P60, when OL cell numbers and MBP expression recovered, myelination was still abnormal after Hyp (Fig. 1j–o). Hyp caused a significant increase in g-ratio and hEGFR expression prevented this increase (Fig. 1n,o).
Next, we investigated behavioral deficits resulting from DWMI after perinatal Hyp by using subcortical WM-dependent sensori-motor behavioral tests (complex wheel and inclined beam-walking task)14–18. In the complex wheel, there was no difference in training maximum velocity (Vmax) between all 4 groups (Fig. 1p). On day 15, all 4 groups had a decline in Vmax, however the largest decline was in the Hyp Rep group (Fig. 1p). The Hyp Rep group performed poorly on the complex wheel (days 15–21), as compared to the other 3 groups (Fig. 1p), suggesting altered subcortical WM integrity.
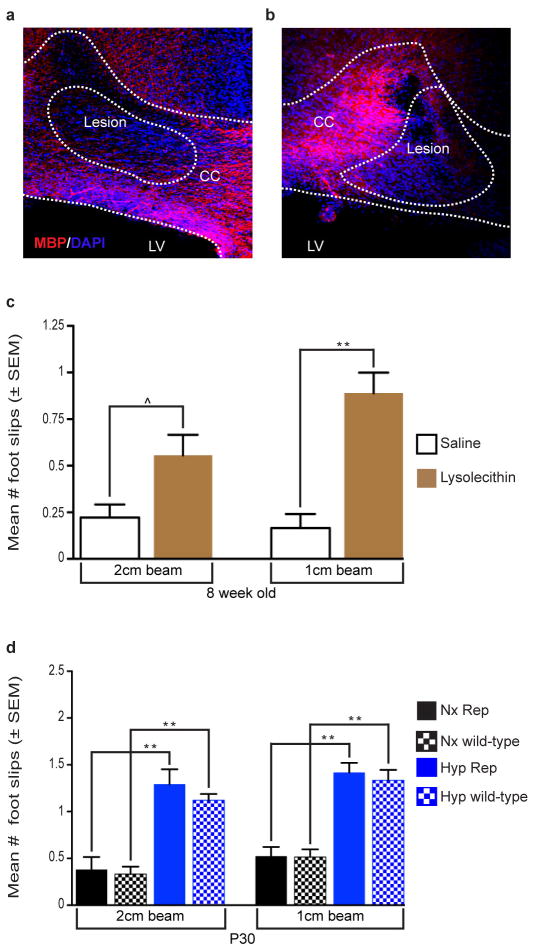
The inclined beam-walking task17,18 requires subcortical WM integrity (Extended Data Fig. 3a–c) and no difference was observed between Rep mice and C57Bl/6 mice (Extended Data Fig. 3d). At P30, the Hyp Rep group displayed more foot slips than the Nx Rep group (Fig. 1q). The Hyp Rep-hEGFR mice displayed no significant increase in the number of foot slips as compared with Nx Rep-hEGFR group. At P60, the Hyp Rep group continued to display an increase in number of foot slips, while the Hyp Rep-hEGFR group had no difference (Fig. 1r). These behavioral studies confirm that Hyp during a critical period in myelin development results in poor performance on WM-specific behavioral tasks. Enhanced EGFR activity prevents the effects of Hyp, strongly suggesting that EGFR signaling in OL lineage cells plays a crucial role in WM recovery after perinatal injury.
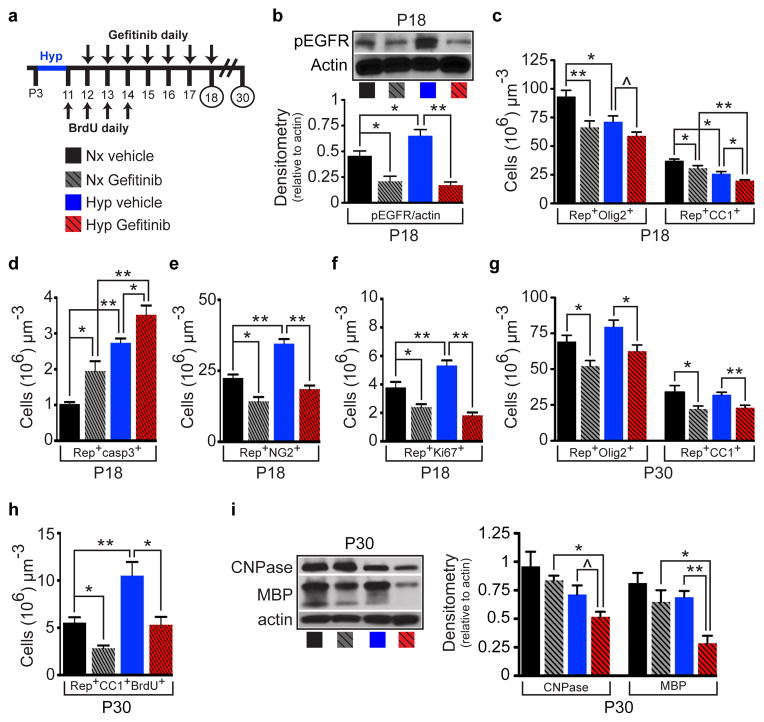
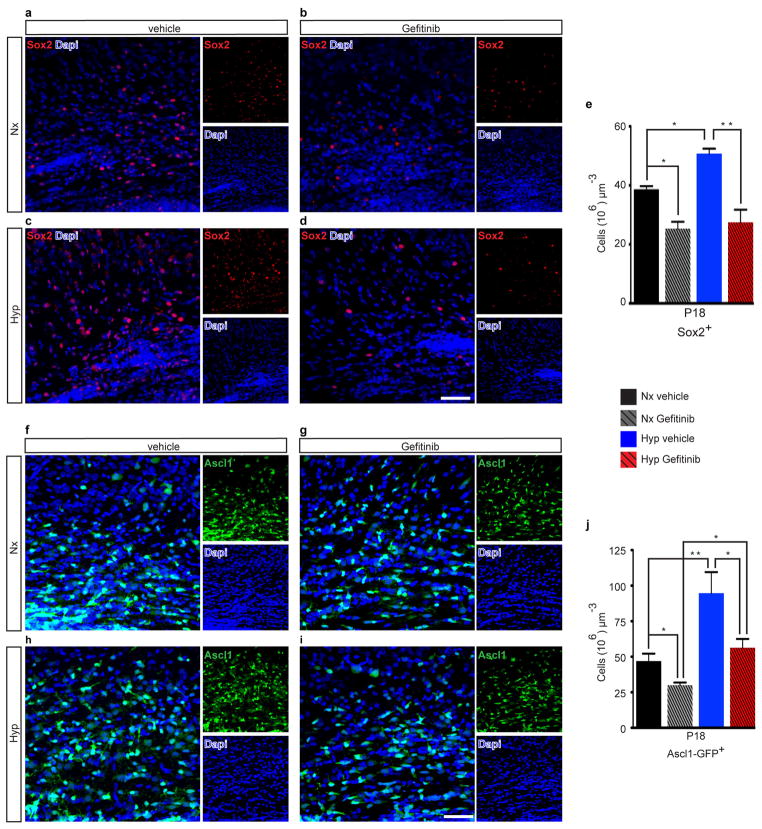
We directly tested the role of endogenous EGFR signaling in OL recovery after Hyp by Gefitinib administration from P12-P18 (Fig. 2a). Gefitinib, a specific EGFR antagonist19, caused a small reduction in basal phosphorylated (p)EGFR levels in WM of Nx mice at P18, but completely prevented the increase in pEGFR induced by Hyp (Fig. 2b). Gefitinib caused a decrease of WM Rep+Olig2+ and Rep+CC1+ OL lineage cells in Nx (Fig. 2c). Hyp resulted in a decrease of these cell populations, which were further reduced by Gefitinib (Fig. 2c). This decrease was attributed to a significant increase in OL apoptosis in both Nx and Hyp (Fig. 2d). Gefitinib also decreased NG2+ OPCs in Nx WM, and prevented their increase observed after Hyp (Fig. 2e). Similarly, Gefitinib decreased WM OL linage cell proliferation in Nx and prevented the proliferative response observed after Hyp (Fig. 2f). Gefitinib also decreased Sox2- and Ascl1-expressing progenitors (Extended Data Fig. 4a–e and f–j, respectively). At P30, Gefitinib still caused a decrease in OL lineage cells and mature OLs in Nx, and prevented OL recovery and oligodendrogenesis observed after Hyp (Fig. 2g,h). Finally, Gefitinib prevented the recovery in CNPase and MBP protein levels observed after Hyp at P30 (Fig. 2i). These results confirm that endogenous EGFR signaling is important in WM cellular and biochemical recovery after Hyp.
Figure 2. EGFR activity is crucial for white matter recovery after neonatal hypoxia.
a, Protocol of Gefitinib and BrdU administration. b, Western blot of WM shows that Gefitinib decreased pEGFR in Nx and prevented the increase in pEGFR after Hyp (n=5 mice per group; One-way ANOVA, Bonferroni post hoc test for individual comparisons). c, Counts of Rep+Olig2+ and Rep+CC1+ cells in WM. d, Gerfinitib increased cell apoptosis in Nx and Hyp. e,f, Gefitinib decreased Rep+NG2+ OPCs (e) and OL-lineage cell proliferation (f) in Nx and prevented Hyp-induced increase in OPC and OL-lineage cell proliferation. g, Lon-term effects of Gefinitib on Rep+Olig2+ and Rep+CC1+ cells. h, Gefinitib decreased newly-generated Rep+CC1+ OLs in Nx and prevented oligodendrogenesis after Hyp. i, Gefitinib prevented recovery of CNPase and MBP expression after Hyp. c–i; n=4 mice per all groups and per age; One-way ANOVA, Bonferroni post hoc test for individual comparisons. All histograms are presented as means ± s.e.m. ^P=0.05; *P<0.05; **P<0.01.
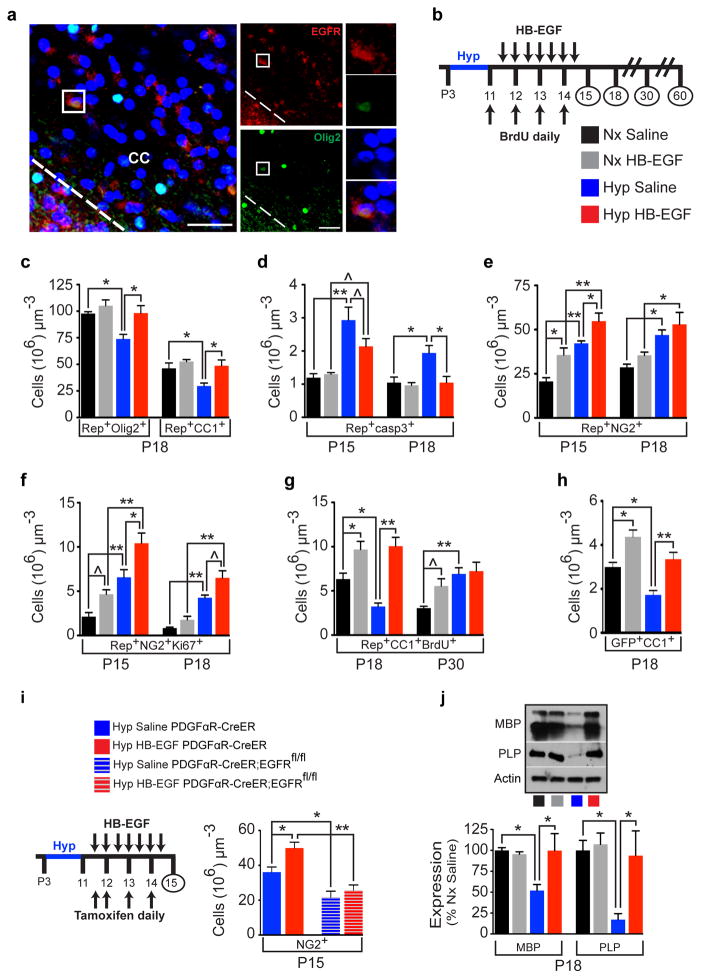
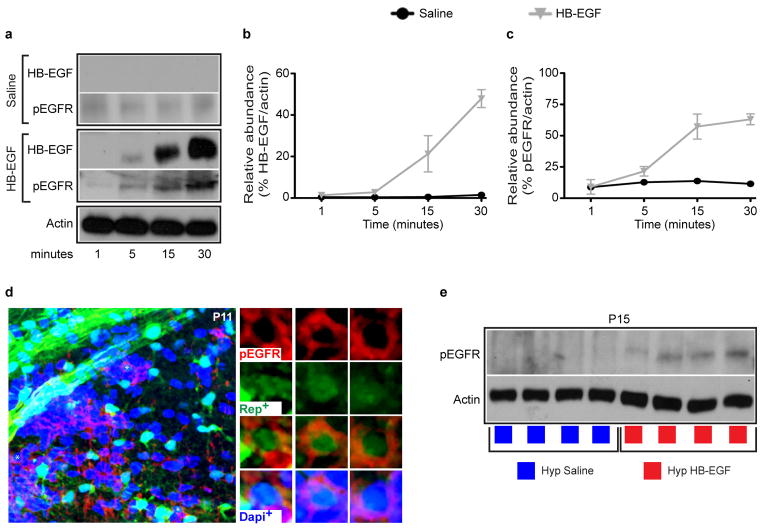
We wanted to examine whether directly targeting EGFR with a selective ligand [recombinant heparin binding EGF (HB-EGF)] via intranasal route promoted cellular recovery of WM OLs after Hyp. The clinical relevance of targeting endogenous OLs was demonstrated by the presence of EGFR-expressing OL lineage cells (Olig2+EGFR+) in neonatal preterm human WM (Figure 3a). The intranasal route allows rapid drug delivery directly to the brain from the nasal mucosa20–22. HB-EGF via intranasal route entered the brain20,23 and acts on WM (Extended Data Fig. 5a–c), where Rep+pEGFR+ cells could be identified (Extended Data Fig. 5d). FACS-purification of Hyp WM Rep+ cells after HB-EGF treatment directly demonstrated activation of EGFR in OL lineage cells (Extended Data Fig. 5e). Treatment with 7 doses of intranasal HB-EGF from P11-P14 (Fig. 3b) prevented WM OL lineage cell loss after Hyp (Fig. 3c). Rep+ cells were stained for caspase-3 in all groups. At all ages examined, HB-EGF treatment reduced (P15) or prevented (P18) the effects of Hyp on OL cell death (Fig. 3d).
Figure 3. Intranasal HB-EGF accelerates oligodendrocyte regeneration and promotes cellular recovery in white matter after neonatal hypoxia.
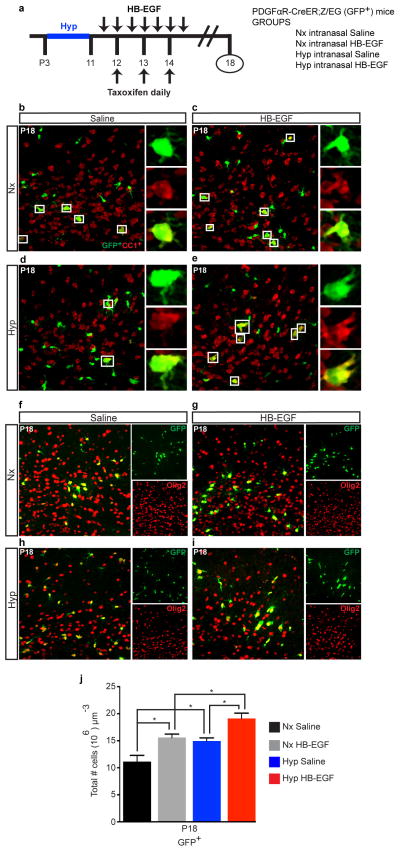
a, Confocal image of a preterm corpus callosum (CC) highlighting an Olig2+EGFR+ cell (box). b, Protocol of intranasal HB-EGF/BrdU administration and tissue collection. c, Number of WM Rep+Olig2+ and Rep+CC1+ cells in HB-EGF-treated mice. d, HB-EGF attenuated or prevented the effects of Hyp on OL apoptosis. e, HB-EGF had an additive effect on Hyp-induced increase of Rep+NG2+ OPCs at P15, but not at P18. f, HB-EGF had an additive effect on Hyp-induced increase of OPC proliferation. g, HB-EGF promoted oligodendrogenesis after Hyp at P18. h, Fate-mapping of OPCs [PDGFαR-CreER;Z/EG (GFP) mouse] demonstrated that oligodendrogenesis occurred from PDGFαR+ cells. c–h, n=4 mice per group and per age; One-way ANOVA, Bonferroni post hoc test for individual comparisons. i. Removal of EGFR in PDGFαR-expressing OPCs (PDGFαR-CreER;EGFRfl/fl;Z/EG mouse) caused a decrease in NG2+ OPCs after Hyp and prevented the effects of HB-EGF (n=4 mice per group except Hyp HB-EGF PDGFαR-CreER;EGFRfl/fl n=3; One-way ANOVA of all 4 groups with a post hoc unpaired t-tests). j, HB-EGF promoted recovery in WM MBP and PLP protein levels after Hyp (Western blot) (n=6 mice per group except Nx HB-EGF n=4; One-way ANOVA, Bonferroni post hoc test for individual comparisons). All histograms are presented as means ± s.e.m. ^P=0.05; *P<0.05; **P<0.01. Scale bars, 50μm.
HB-EGF treatment also caused an increase in WM Rep+NG2+ OPCs in both Nx and Hyp groups, and enhanced OPC proliferation (Fig. 3e,f)24. To determine whether OL recovery was a result of increased oligodendrogenesis from this expanded pool of proliferative OPCs, we performed BrdU-pulse chase labeling of newly generated OLs. HB-EGF increased the number of Rep+CC1+BrdU+ cells under Nx and Hyp conditions at P18 (Fig. 3g). At P30, the additive effect of Hyp and HB-EGF was not as evident (Fig. 3g). Genetic lineage tracing of OLs in vivo by using the platelet-derived growth factor alpha receptor [PDGFαR-CreER:Z/EG] (GFP+) reporter mouse (Extended Data Fig. 6; Fig. 3h)25 confirmed that Hyp and HB-EGF treatment have an additive effect on the generation of Olig2-expressing cells (Extended Data Fig. 6j). Conversely, PDGFαR-driven EGFR deletion in OPCs prevented the cellular effects of HB-EGF on NG2+ OPCs (Fig. 3i). HB-EGF treatment after Hyp also resulted in recovery of MBP and Proteolipid Protein (PLP) expression (Fig. 3j). These results indicate that, after Hyp, HB-EGF promotes expansion of the OPC pool, and OL regeneration and maturation.
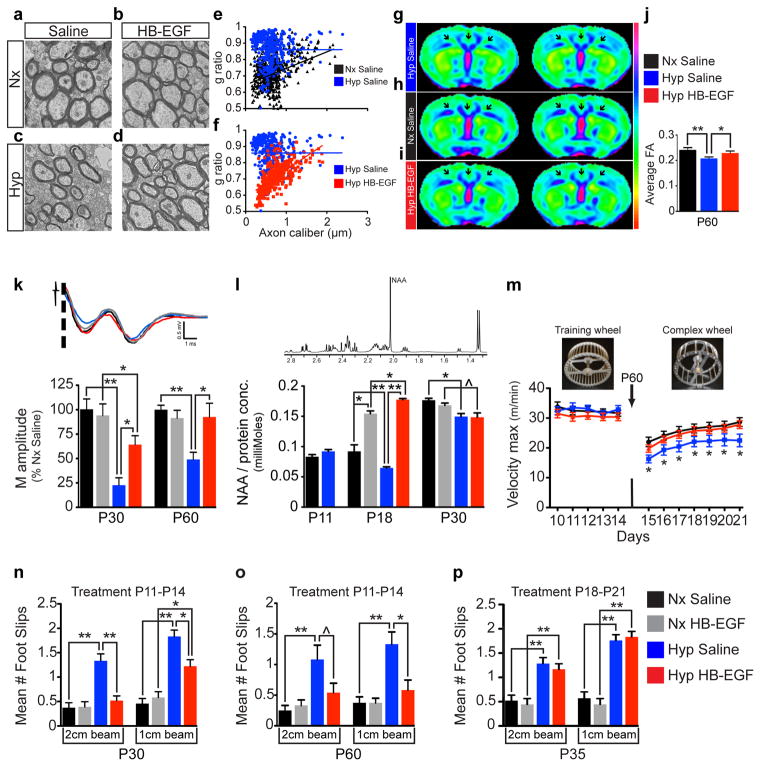
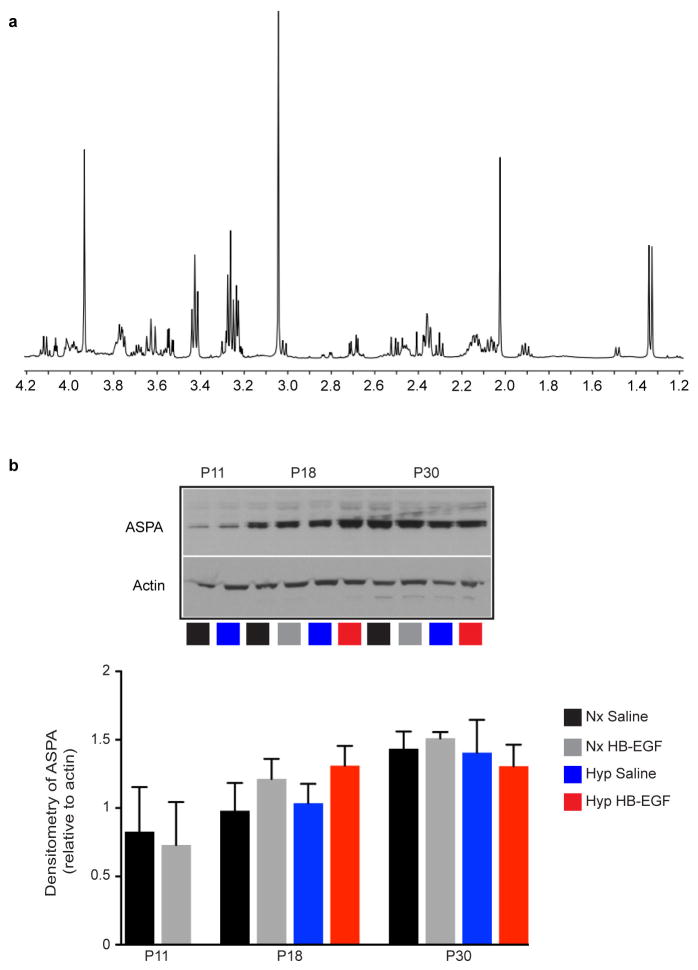
EM analysis revealed that HB-EGF treatment rescued the increase in g-ratio observed in Hyp and partially prevented the decrease in % of myelinated axons (Fig. 4a–f; Extended Data Fig. 7). Diffusion Tensor Imaging (DTI) demonstrated that, at P60, fractional anisotropy (FA) values are significantly decreased in corpus callosum, cingulum and external capsule regions of Hyp mice, but not in the HB-EGF-treated Hyp group (Fig. 4g–j). Electrophysiological analysis of extracellular compound action potentials (CAPs) demonstrated that HB-EGF prevented the decrease in amplitude of myelinated axons observed after Hyp (Fig. 4k). Finally, analysis of N-Acetyl Aspartate (NAA) in WM decreased levels at P18 and P30, which was prevented by HB-EGF (Fig. 4l; Extended Data Fig. 8).
Figure 4. Intranasal HB-EGF promotes ultrastructural, physiological and behavioral recovery in white matter after neonatal hypoxia.
a–d, EM images of P30 WM and (e–f) scatter plots of g-ratios of individual axons relative to axon diameters (n=3 mice per group; One-way ANOVA of all 4 groups with post hoc unpaired t-tests). g–j, Ex vivo DTI analysis (representative averaged FA maps) shows that HB-EGF attenuates Hyp-induced reduction of FA in corpus callosum, cingulum and external capsule (arrows point to regions of interest; n=5 for each group). k, CAP extracellular recordings. Representative waveforms and histograms show that the Hyp HB-EGF group displayed larger M amplitudes compared to Hyp Saline (n=5–7 per group per age). l, Ex vivo measurements of WM NAA using 1H-NMR spectroscopy. Representative 1H-NMR spectra showing the NAA peak. At P18 there was significantly less NAA in the Hyp Saline group compared to the Hyp HB-EGF (n=5 per group per age; One-way ANOVA, Bonferroni post hoc test for individual comparisons, except P11 unpaired t-test). m, On the complex wheel, Hyp HB-EGF-treated mice performed similar to Nx Saline group (linear regression comparison of slopes between all 3 groups and post hoc comparison of individual days between groups, Nx Saline n=8, Hyp Saline n=12, Hyp HB-EGF n=10). n,o, On the inclined beam-walking task, HB-EGF treatment (P11-P14) decreased the number of foot slips observed in Hyp mice (Poisson multiple regression analysis; all groups were n=8, except for P30 Hyp HB-EGF n=9). p, Delayed HB-EGF administration at P18-P21 resulted in no difference in foot slips (Poisson multiple regression analysis, Nx Saline and Nx HB-EGF n=7, Hyp Saline and Hyp HB-EGF n=8). All histograms are presented as means ± s.e.m. ^P=0.05; *P<0.05; **P<0.01.
On the complex wheel, Hyp HB-EGF-treated mice had similar performance to the Nx Saline group (Fig. 4m). Furthermore, in the inclined beam-walking task, HB-EGF treatment completely prevented Hyp-induced behavioral deficit tested on the 2cm-width beam, and reduced the effects of Hyp tested on the 1cm-width beam (Fig. 4n,o). Importantly, when HB-EGF treatment was performed at P18-P21, it had no effect on the Hyp-induced behavioral phenotype (Fig. 4p; Extended Data Fig. 9).
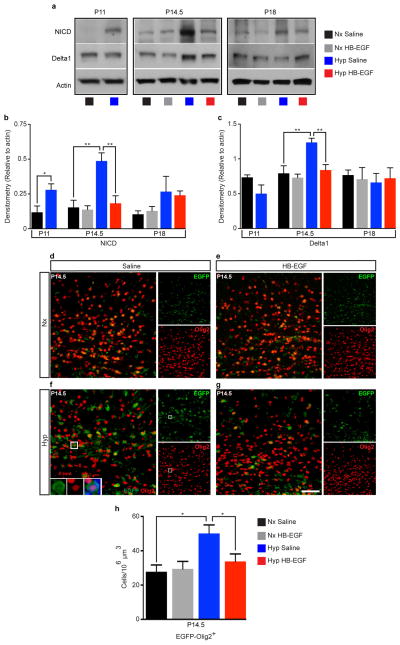
Importantly, HB-EGF strongly inhibited Hyp-induced upregulation of Notch signaling elements (Extended Data Fig. 10a–c) and functional activation of Notch in WM Olig2+ OL lineage cells (Extended Data Fig. 10d–h), which could be at least in part responsible for delayed OL maturation after perinatal injury26. These results are consistent with the notion that HB-EGF accelerated OPC maturation after Hyp through inhibition of Notch11, and indicates that HB-EGF treatment promotes functional recovery during a critical developmental time window for effective therapeutic intervention.
Our results reveal that activating EGF/EGFR signaling promotes cellular and functional recovery after neonatal brain injury. Enhancing EGFR signaling through overexpression of the EGFR prevents DWMI, promotes the generation of new OLs and prevents behavioral deficits in different WM-related tasks. Furthermore, a brief pharmacological treatment that targets endogenous EGFRs using a clinically feasible (intranasal) mode of entry during a critical window promotes cellular, developmental, myelin structural improvement and behavioral recovery. Intranasal treatment is a plausible route to introduce sufficient HB-EGF into the brain and WM of critically ill VPT infants.
METHODS
Animals
The CNP-EGFP (Rep) and CNP-EGFP-hEGFR (Rep-hEGFR) strains were generated as described previously and backcrossed to a C57BL/6 genetic background greater than 9 generations29–31. The Rep-hEGFR mice used for these experiments were crossed with heterozygote Rep mice to ensure that all pups were positive for green fluorescent protein (GFP), but not all expressed hEGFR. This ensured littermate controls. For experiments that required only Rep line of mice, a Rep adult mouse was crossed with a C57BL/6 (Jackson laboratories). Only mice that expressed green fluorescent protein (Rep) during screening on postnatal day 2 with ultraviolet goggles were used. The PDGFαR-CreERT2 (Courtesy of Dr. Dwight Bergles; referred in the text as PDGFαR-CreER) was crossed with Z/EG reporter mice (Jackson Laboratories; stock number 003920) and genotyped as previously reported32. Z/EG reporter mice were crossed with EGFRfl/fl33 followed by PDGFαR-CreER transgenic mice. These mice were backcrossed to ensure homozygote EGFRfl/fl so that all mice were PDGFαR-CreER;EGFRfl/fl;Z/EG. The Ascl1GFP mice (Jackson Laboratories, stock 012881; also known as Mash1) were used to determine the effects of Gefitinib on white matter (WM) Ascl1-expressing cells. In this study, unless described below or in the figure legends, only male mice were used due to male preterm children displaying more clinically relevant injury and neurological deficits compared to females34,35. All animal procedures were performed according to the Institutional Animal Care and Use Committee of Children’s National Medical Center and the National Institutes of Health “Guide for the Care and Use of Laboratory Animals.”
Hypoxic rearing
Mice were randomly chosen to either undergo Hypoxic (Hyp) rearing or serve as Normoxia (Nx) controls. The Hyp mice were placed in a sealed chamber maintaining O2 concentration at 10.5% by displacement with N2 as described previously36–38. Hyp began at P3 for 8 days until P11. This time window in rodent WM oligodendrocyte (OL) development reproduces changes that occur at 23–40 weeks of gestation in the human brain39. A separate group of mice from the same breeding cage were used for age and strain matched Normoxia (Nx) controls. Genotyping (CNP-hEGFR; PDGFαR-CreER;Z/EG; Ascl1GFP; and EGFRfl/fl) was performed at P11 by PCR of tissue obtained from the tail as previously reported29,30,32,33. Time points chosen for immunohistochemistry or protein quantification were P11, P15, P18, P30 and P60.
BrdU administration
The BrdU labeling protocol was performed in all mice as follows: Mice were injected intraperitoneal (IP) at the same time of the day with BrdU (50μg/g body weight) daily for four days (P11-P14) in the morning. In studies using HB-EGF or Gefitinib, BrdU was administered one hour prior to vehicle or drug administration.
Gefitinib administration
Gefitinib (Iressa; Tocris (Astra Zeneca)) was prepared with strong sonication in a 25% DMSO and 75% sunflower seed oil at a concentration of 10mg/mL. Male mice in each litter were randomly chosen to receive either drug or vehicle. The drug dose for this study was 75 mg/kg/day and administered once daily. Equal amount of vehicle was administered to control animals. A total of 7 doses of vehicle or drug were administered beginning at P12.
HB-EGF administration
The intranasal route allows for small molecules to rapidly enter the cerebrospinal fluid (CSF) from the nasal cavity, followed by subsequent distribution to the brain and spinal cord40–43. Recombinant human heparin binding epidermal growth factor constituent free (HB-EGF; R&D Biosciences) was prepared using 0.45% normal sterile saline solution (Saline) at a concentration of 10μg/mL and stored at −20°C Mice were randomized to the vehicle (Saline) or HB-EGF group. Saline or HB-EGF was administered intranasally at no more than 5μL increments 5–10 minutes apart for a total of 100 nanograms/gram (ng/g). The mouse was held ventral-side up, and a small-modified 27-French catheter was inserted into either nare. Saline or drug was slowly administered and mouse was held for 1–2 minutes to ensure absorption. Drug or Saline was administered every 12 hours beginning on the evening of P11.
Immunohistochemistry and antibodies
Freshly cut, free-floating brain sections (40 μ thick) from P11-P60 mice were prepared as described previously29,30,36,38. Primary antibody dilutions were 1:500 for anti-BrdU (Accurate), anti-NG2 (Millipore), anti-Olig2 (Millipore), anti-Ki67 (Vector), anti-APC (also referred as CC1, Millipore) and anti-cleaved caspase-3 (caspase-3; Millipore); 1:250 for anti-MBP (Covance); and 1:500 anti-EGFR phosphorylated Tyr1068 (Novus Biologicals). Sections were incubated at room temperature for one-to-three hours, followed by overnight at 4 °C in primary antibodies diluted in 0.1M phosphate-buffered saline containing 0.1% Triton X-100 and 5% normal goat serum (vol/vol). Three washes were performed with cold 1x PBS prior to secondary antibodies being administered. The secondary antibodies (1:200) used were AlexaFluor 488, AlexaFluor 546 and AlexaFluor 633 conjugated goat anti-rabbit, anti-rat or anti-mouse IgG (Invitrogen). Sections were incubated with secondary antibodies for 1 hour at room temperature, followed by three 1x PBS washes. Sections were treated with DAPI (4′,6-diamidino-2-phenylindole) (Sigma-Aldrich) for 10–15 min at room temperature and mounted with Mowiol. Human tissue was obtained from a deceased 3-day old infant born at 36-week gestation with approval from Children’s National Institutional Review Board. Sections of corpus callosum and periventricular region were removed after fixation of the brain for 2 weeks in formalin solution. Tissue was kept in PBS for 1 week with daily changes of PBS solution to remove excess formalin. The brain was then placed in 20% glycerol solution for 24 hours. Freshly cut, free-floating sections (40 μ thick) were made on a sliding microtome. Sections were immunostained as described above.
Microscopy and cell counting
All fluorescent images were taken on a Zeiss LSM confocal laser-scanning microscope with sequential scanning mode using 40x oil objectives. Microscopy and cell counting were as recently described44,45. Z-stack images of 1 μm thick single plane were captured through the entire thickness of the slice and each cell was analyzed using Zeiss LSM Image Browser (version 4.2) in its entire z-axis to exclude false double labeling due to overlay of signals from different cells. Four different laser lines were used to image localization of FITC (488 nm excitation; 522/35 emission filter), CY3 (560 nm excitation; 605/32 emission filter), Cy5 (647 nm excitation; 680/32 emission filter), and DAPI (400 nm excitation). Data acquisition and processing were controlled by modified LSM software. Analysis of immunofluorescence was performed on confocal z-stack as previously described44,45. Cells were counted in 225 × 225 × 10μm (X,Y,Z planes) images for cells/volume quantifications. Data were obtained from an average of 6 tissue sections per mouse per immunostain. Analysis of subcortical WM - rostral to the hippocampus - was performed in the corpus callosum, cingulum and external capsule. Cells were counted in a blinded fashion. The merged image for each confocal z-stack was analyzed and positive immunofluorescence identified for each individual channel counted double or triple labeled cells. Merged images were processed in Photoshop CS5.5 with minimal manipulation of contrast.
Propidium iodide
To assess loss of membrane integrity and increased plasmalemma permeability in vivo, propidium iodide was used as demonstrated previously46. Propidium iodide (10mg/mL; Sigma) was diluted in 0.9% NaCl and 1mg/kg was administered intraperitoneally 1 hour prior to sacrifice. As described above, mice were perfused, brains collected in all groups and free floating brain sections (40 μ thick) were prepared. Sections were washed, incubated with DAPI for 10 minutes, washed and then mounted on a slide. Propidium iodide (PI) emits bright red fluorescence when bound to RNA or DNA. Confocal microscopy was used to visualize the GFP+ PI+ Dapi+ cells.
Western blot analysis
For Western blot analysis of WM lysates, the subcortical WM was dissected on ice-cold medium from 300–400 μm-thick sections as previously described29,36,38. Briefly, brains were sliced coronally and only sections anterior to the hippocampus were used. Using Roboz – a fine-straight and fine-angled microdissecting forceps under a dissecting microscope – the cortex was dissected away leaving the subcortical WM attached to the striatum. The WM was then easily pushed away from the striatum, leaving only WM tissue. The dissected WM was rinsed with ice-cold PBS, and then lysed on ice in 150–200 μl of RIPA lysis buffer with protease inhibitors. Protein concentrations were determined by using the Bradford protein assay kit (Bio-rad). Western blot analysis was performed using 10–40 μg of total cell lysates. Proteins were resolved on 4–20% Tris glycine gels (Nusep) and transferred to Immobilon PVDF membranes in transfer buffer overnight at 4°C. Membranes were blocked for 1 hour in 5% milk in Tris-buffered saline-Tween 20 (TBST), then incubated at 4°C overnight with primary antibodies diluted in 5% milk in TBST: (1:5000 for anti-MBP (Covance), anti-CNP (Covance) and anti-Actin (Millipore); 1:1000 for anti-PLP (Abcam); 1:1000 for anti-HB-EGF (Santa Cruz); 1:1000 for anti-Delta1 (Santa Cruz); 1:1000 for anti-NICD (Iowa Hybridoma Bank C17.9C6); and 1:4,000 for anti-Aspartoacylase (ThermoScientific)). The membranes were then washed in TBST three times for 10–15 min at room temperature followed by the addition of either horseradish peroxidase-conjugated goat polyclonal anti-rabbit IgG (Santa Cruz) for polyclonal primary antibodies, or horseradish peroxidase-conjugated goat anti-mouse (Santa Cruz) for mouse monoclonal primary antibodies diluted in 5% milk in TBST. For phosphorylated EGFR (Novus Biologicals), 5% bovine serum albumin (BSA) in TBST was used as block and for primary antibody incubation overnight. For all Western blots, chemiluminescent signals were detected using Pierce ECL Western blotting substrate. X-ray films were scanned using an Agfa T1200 scanner and densitometric measurements were obtained using ImageJ software. Western blots were obtained from WM of 3–6 male mice in each group. Densitometric measurements were obtained using ImageJ software averaged as previously described29,36,38.
EGF ELISA
WM was grossly dissected on ice-cold 1x PBS from P11, P15 and P18 Rep and Rep-hEGFR Nx and Hyp mice as described above. Assay procedure was performed according to manufacturer’s instructions (R&D Systems, Mouse EGF Quantikine ELISA Kit). Experiments were performed in triplicates and averaged.
Fluorescent Activated Cell Sorting [FACS]
WM microdissected tissue from Hyp P15 Rep+ (CNP-EGFP+) vehicle or HB-EGF treated mice were FACS-purified. Two- to three male and female brains were pooled for each sample (individual n). Tissue was dissociated into single cell suspensions as previously described30,47, and analyzed for light forward and side scatter using a FACSAria instrument (BD Bioscience, San Jose, CA). The collected Rep+ cells were used for Western blot analysis.
Electron microscopy
Mice at P30 and P60 were perfused with 4% paraformaldehyde containing 10% picric acid and 5% glutaraldehyde and postfixed for 2 weeks48. Brains were sectioned and prepared in groups at the same time as previously described38,48. Sagittal sections of white matter were examined with a JEOL transmission electron microscope (JEM-1400), and pictures were taken with a Gatan SC1000 ORIUS CCD camera. Measurements and image processing was performed using ImageJ (US National Institute of Health). Myelin thickness was calculated from the average of radial measurements at four points per sheath, avoiding areas of tongue processes or fixation artifact48,49. Axon diameters were calculated from measurement of the axon circumference. Axons with diameters typical of unmyelinated fibers (<0.3 μm) were excluded from analysis48,49. The extent of myelination was quantitatively compared by determining g-ratios, which were calculated by dividing the diameter of the axon by the diameter of the entire myelinated fiber, as previously described48–50. Measurements were performed by J.S. who was blinded to groups. At least 100 axons were measured for each brain.
LPC-induced demyelination
Bilateral demyelination was performed in adult male and female C57Bl/6 (8 weeks old) mice after deep ketamine/xylazine anesthesia (10mg/gram body weight). Mice were placed in a modified stereotaxic frame (Stoetling) and 2 μl of 2% lysolecithin (EMD Chemicals, LPC) solution (vol/vol) and/or 0.9% NaCl (vol/vol) was injected bilaterally into the corpus callosum using a Hamilton micropette (Stoetling). Injection time lasted for 5 min to reduce reflux along needle track. The needle was then slowly withdrawn over a 5 min period. Stereotaxic coordinates for corpus callosum were taken from bregma (0.26 mm caudal, 1.0 mm lateral and 3.0 mm ventral). Inclined beam-walking behavioral test testing began 5 days after surgery in both groups of mice as described below. Bilateral demyelination was confirmed after testing by perfusing the mice as described above and immunohistochemical analysis of corpus callosum using anti-MBP. Only mice that displayed clear bilateral lesions on microscopic examination were included in the behavioral analysis. Three (n=3) mice were excluded from the study because bilateral WM demyelination was not clearly evident.
Diffusion Tensor Imaging (DTI) Analysis (ex vivo)
Mice (P60) used for DTI were perfused and imaged as previously described51. One hour prior to DTI scans the brains were soaked 3 times for 10 minutes each time in 10 mL PBS to remove the PFA solution. The brains were placed into a custom built MRI compatible tube, filled with Fluorinert - an MRI susceptibility-matching fluid (Sigma-Aldrich, Inc., St. Louis, MO). The DTI datasets were obtained on a 9.4 T horizontal bore magnet (Bruker, Billerica, MA, U.S.A.) with a custom-made 1H radio frequency coil. The DTI experiments were performed using the Stejskal-Tanner spin-echo diffusion-weighted sequence with a diffusion gradient of 5ms and a delay between the two diffusion gradients of 15ms. 24 contiguous coronal slices of 0.5mm thickness were acquired using a repetition time (TR) of 2s and an echo time (TE) of 25.1ms. Two Shinnar–Le Roux (SLR) pulses of 1ms each were used for excitation and inversion, respectively. 20 averages were acquired for each slice and the 128 × 64 images were zero-filled to 256 × 256, resulting in an in-plane resolution of 100 μm × 100 μm. Sixteen different images were acquired for each slice, fifteen corresponding to various noncollinear diffusion weighting directions with the same b = 1000 s/mm2 and one with no diffusion weighting. The DTI processing and analysis was performed blindly as described previously51,52.
Compound Action Potential [CAPs]
Compound action potential (CAP) recordings were performed in all 4 groups at P30 and P60 using methods previously described29,45. Briefly, following sacrifice, coronal slices 400 μm in thickness were obtained using a VT1000S vibratome (Leica) in ice-cold slicing solution (85 mM NaCl, 2.5 mM KCl, 25 mM NaHCO3, 1.25 mM NaH2PO4, 0.5 mM CaCl2, 7 mM MgCl2, 25 mM glucose, 75 mM sucrose). Slices were placed in recording solution (125 mM NaCl, 2.5 mM KCl, 26 mM NaHCO3, 1.25 mM NaH2PO4, 2.5 mM CaCl2, 1.3 mM MgCl2, 11 mM glucose, pH = 7.4) bubbled in 95% O2/5% CO2 and maintained at 37°C for 1 hour then kept in the same solution at room temperature (22–25°C) until recording. CAP recordings were performed on five slices corresponding to sections 13–18 (Bregma 1.32 to −0.94 mm) of the National Institutes of Mental Health’s mouse brain atlas (http://www.mbl,org/atlas170/atlas170_frame.html). Slices were placed in a recording chamber superfused with oxygenated recording solution at a flow rate of 2 mL min−1 and viewed using the 10x objective of an Olympus BX61WI microscope. CAP recordings were obtained using a FHC concentric bipolar stimulating electrode and an extracellular field electrode with a tip resistance of 1MΩ. The stimulating and recording electrodes were placed ~2 mm apart (~1 mm on each side of the midline) in the corpus callosum of sub-cortical WM and a constant stimulus was delivered for each recording in current clamp. A single pulse protocol was used with a pulse frequency of 200 Hz and a period of 5 ms. Fifty sweeps were recorded, averaged and used in analysis for CAP amplitude. Two distinguishable downward waves were evident for each CAP recording, with the first corresponding to rapidly propagating myelinated (M) axons and the second to slower propagating unmyelinated (UM) axons29,45,53.
1Hydrogen-Nucleur Magnetic Resonance Spectroscopy [1H-NMR]
Brains from all groups were collected at P11, P18 and P30. The brains were removed and placed on dry ice. The WM was dissected, snap frozen in liquid nitrogen (total time <60sec), and stored in −80°C freezer until extraction. Samples for 1H-NMR spectroscopy were prepared as previously published54. Each frozen sample was homogenized in 1ml of 7% perchloric acid and centrifuged for 10min at 4°C and 7000rpm. Supernatants were transferred to separate tubes and pellets were re-extracted. Combined supernatants were neutralized with KOH, centrifuged and lyophilized. Lyophilized samples were dissolved in 0.8ml of 99% D2O and pH was adjusted to 7.0. Fully-relaxed 1H NMR spectra was acquired on Varian 500 with the following parameters: 90° pulse angle, an acquisition time of 1.36sec, relaxation delay of 17sec, total number of 800 scans per sample. Low-power pre-saturation pulse at water frequency was used to achieve water suppression. Obtained spectra was analyzed using MestReNova software (version 8.1; Mestrelab Research, Spain) and the amounts of metabolites were quantified from integrals of the peak areas corrected for number of protons and using 2,2,3,3-D(4)-sodium-3-trimethylsilylpropionate as internal control.
Behavioral testing
Each behavioral experiment was performed in separate naïve mice that had not undergone any previous behavioral testing. Complex running wheel task was performed as previously described55–57. At P45, naïve mice that did not undergo any prior behavioral testing, were individually housed in a modified cage equipped with a running wheel attached to an optical sensor to constantly detect the number of wheel revolutions per time interval (minute). Animals were kept on a regular 12-hour light/dark cycle. Food and water were made available ad lib. During the first 2 weeks, a training wheel with all 38 rungs was present allowing for normalization of running behavior. On the third week (day 15; age P60), the regular training wheel was replaced with a complex wheel of the same diameter with 22 rungs missing in an alternative pattern. Using the Activity Wheel Monitoring Software (Lafayette Instrument, Lafayette, IN), wheel revolutions were recorded each day and exported to a Microsoft Excel file in which daily total distance traveled and maximum daily velocity were calculated. All mice showed spontaneous running behavior and no mice were excluded from this study. Inclined beam-walking task was performed as previously described58,59. Two elevated 80 cm in length wooden beams were placed at a 30-degree angle. One beam was 2cm in width and the other 1cm in width. A dark box with bedding was at the end of the incline and served as target for the mouse to reach. A blinded experimenter observing and recording from above assessed mice performance by documenting the number of foot slips (either hind legs or front legs) and the time to traverse the beam58. In pilot studies, we determined that Hyp Rep mice less than 30 days of age - or on a beam that was inclined more than 30 degrees - were unable to perform this task (data not shown). To confirm whether this sensori-motor task is dependent on subcortical WM, bilateral LPC or 0.9% saline injected adult mice were tested on day 5 after surgery (described above). Bilateral demyelination was confirmed after testing by removal of brains and immunohistochemical analysis of corpus callosum. Only mice that displayed clear bilateral lesions on microscopic examination were included in the behavioral analysis (n=3 mice were excluded due to failure in demyelination).
Statistics
All data in histograms are presented as averages ± s.e.m. All cell counting and Western blot data were statistically compared using One way Analysis of Variance (ANOVA) to determine whether overall differences exist across study groups. Comparisons between specific groups were treated as unplanned comparisons, which were adjusted using a Bonferroni correction. A two-tailed type I error (p value < 0.05) was used to determine statistical significance. Each experiment evaluated outcomes in 4 groups. The Bonferroni correction was applied for the following comparisons: Nxa vs Nxb; Nxa vs Hypa; and Nxb vs Hypb. The 2 Hyp groups were compared post hoc if the one way ANOVA was significant using a two-tailed unpaired t-test (Hypa vs Hypb) with two-tailed type 1 error set at p=0.05. For the EM data, a one-way ANOVA was used to compare the g-ratio for each mice in each of the 4 respective groups. If significance was found, then a two-tailed unpaired t-test with two-tailed type I error set at p=0.05 was used to make the following comparisons: Nxa vs Hypa; Hypa vs Hypb; Nxa vs Nxb; and Nxb vs Hypb. Scatter plots of g-ratios of individual fibers in relation to axon diameter are shown comparing the groups outlined above. The average FA anisotropy for each mouse in each group was compared using a one-way ANOVA as described above. The Bonferroni correction was applied for the following comparisons: Nx Saline vs Hyp Saline; Nx Saline vs Hyp HB-EGF; and Hyp Saline vs Hyp HB-EGF. For the complex running wheel data, we used a longitudinal linear regression analysis to compare slopes (trajectories) of change. We also performed post hoc testing between the four groups for each individual day. For the beam walking behavioral results, the number of foot slips, the time to traverse the beam and the size of the beam was analyzed using a Poisson multiple regression analysis, which allowed us to overcome the lack of normality in count type data and account for other variables to compare the rate of foot slips. The one-way ANOVA with post hoc comparisons was performed using GraphPad Prism 5.0 (for Mac; La Jolla, CA). All histograms and scatter plots in this manuscript were created with GraphPad Prism.
Extended Data
Extended Data Figure 1. Hypoxia results in a significant increase in EGF levels in the white matter.
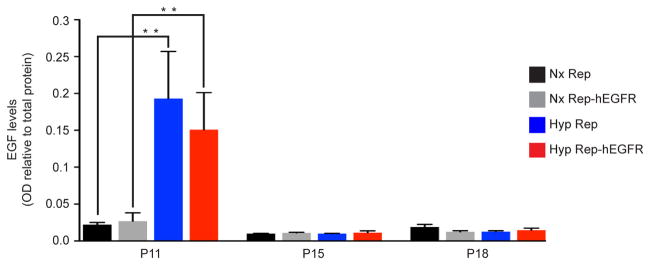
The WM was dissected out at P11, 15 and 18 in normoxia (Nx) and Hyp CNP-EGFP (Rep) and CNP-EGFP-hEGFR (Rep-hEGFR) mice. At P11, in both Hyp groups, there was a significant increase in EGF levels, as measured by ELISA. There was no significant difference between the two Hyp groups, indicating that overexpression of EGFR in oligodendrocyte (OL) lineage cells does not modify endogenous EGF levels. At P15 and P18, there was no difference between all 4 groups. All histograms are presented as mean absorption (OD) relative to total protein concentration ± s.e.m. *P<0.05; **P<0.01 (P11 and P15: n=4 mice per group and per age; P18: n=3 mice per group; One-way ANOVA, Bonferroni post hoc test for individual comparisons).
Extended Data Figure 2. Enhanced EGFR expression in oligodendrocyte lineage cells prevents oligodendrocyte death and promotes proliferation of OPCs in white matter.
a–d, Representative 40x confocal images of Rep+PI+ cells from Nx and Hyp WM at P11 in Rep and Rep-hEGFR mice. e, At P11 and P18, Hyp resulted in a significant increase in the number of OL cells undergoing apoptosis (Rep+casp3+). Enhanced EGFR expression prevented this increase at all time points, except P60 where no difference was evident. Comparison of the Hyp Rep with the Hyp Rep-hEGFR groups demonstrates that hEGFR in OL lineage cells is protective against apoptosis induced by Hyp (n=4 mice per group and per age; One-way ANOVA, Bonferroni post hoc test for individual comparisons). f, PI was injected intraperitoneally (IP) 1-hour prior to sacrifice. A significant increase in the number of Rep+PI+ OL cells indicated membrane disruption contributing to cell death (n=3 mice per group; One-way ANOVA, Bonferroni post hoc test for individual comparisons). g–j, Representative 40x confocal images of Rep+NG2+ OPCs from Nx and Hyp WM at P18 in the Rep and Rep-hEGFR mice. k, At P11 and P18, Rep-hEGFR Nx mice had more NG2+ expressing OPCs compared to the Rep Nx group. Hyp resulted in a significant increase in the number of Rep+NG2+ OPCs in both Rep and Rep-hEGFR groups, however, overexpression of hEGFR did not have an additive effect (n=4 mice per group and per age; One-way ANOVA, Bonferroni post hoc test for individual comparisons). l, At P11 and P18, the Rep-hEGFR group had more Rep+Ki67+ cells, however this did not reach significance (P>0.05). Hyp resulted in enhanced OL-lineage proliferation at P11 and P18, but hEGFR overexpression did not have a significantly additive effect, when compared to the Rep Hyp group. k,l, n=4 mice per group and per age; One-way ANOVA, Bonferroni post hoc test for individual comparisons. m, More OPCs were in a proliferative state in Rep-hEGFR Nx mice compared to Rep Nx. Hyp enhanced OPC proliferation, and overexpression of hEGFR resulted in a significantly additive increase compared to the Rep Hyp group (n=3 mice per group; One-way ANOVA, Bonferroni post hoc test for individual comparisons). All histograms are presented as means ± s.e.m. Scale bars, 50μm (a–d, g–j). ^P=0.05; *P<0.05; **P<0.01.
Extended Data Figure 3. The inclined beam-walking task requires normal subcortical white matter.
This study was performed to test the hypothesis that the inclined beam-walking task is a good assessment of subcortical WM function. In order to test this hypothesis, we performed a well-established model of subcortical WM demyelination induced by bilateral lysolecithin injections in 8-week-old C57Bl/6J male and female mice. Animals were tested at 5 days post-surgical intervention - which is a time period when demyelination is at its maximum - to determine whether subcortical WM integrity is important in this behavioral task. Control mice received bilateral injections of normal saline using the same coordinates as the lysolecithin group. a–b, Bilateral demyelination was confirmed after testing by removal of brains and immunohistochemical analysis of corpus callosum. Only mice that displayed clear bilateral lesions on microscopic examination were included in the behavioral analysis (n=3 mice were excluded). c, The lysolecithin injected mice had marginally significant or very significant increase in average number of foot slips on 2-and-1cm wide inclined beam, respectively (2-tailed Mann Whitney test, n=6 per group). d, We wanted to determine whether the Rep (CNP-EGFP) transgenic mice performance on the inclined beam-walking task was similar to C57Bl/6 mice (wild-type). No difference in performance was evident between the 2 different lines of male mice. We found that the Rep and wild type mice performed similarly in either Nx or Hyp conditions (Poisson multiple regression analysis, Nx Rep n=7, Nx wild-type n=11, Hyp Rep n=8, Hyp wild-type n=11). All histograms are presented as means ± s.e.m. ^P=0.05; *P<0.05; **P<0.01.
Extended Data Figure 4. Inhibition of EGFR prevents expansion of progenitor cells in the developing white matter and after Hyp.
a–d, Representative 40x confocal images of subcortical WM Sox2+ cells, a transcription factor expressed in proliferating multipotential neural progenitor cells. e, Gefitinib, a specific EGFR inhibitor, resulted in a significant decrease in the number of WM Sox2 expressing cells compared to Nx vehicle-treated mice. After Hyp, there was a significant expansion of Sox2+ cells in the WM compared to Nx vehicle group, however, this expansion was prevented by Gefitinib (Hyp Gefitinib) (Hyp vehicle vs. Hyp Gefitinib, P<0.01) (n=4 for each group; One-way ANOVA, Bonferroni post hoc test for individual comparisons). f–i, Representative 40x confocal images of subcortical WM Ascl1+ cells (Mash1) in the Ascl1-EGFP (Mash1-EGFP) transgenic mice. Ascl1 is a proneural transcription factor expressed in proliferating multipotential neural progenitor cells. j, Similar to above, Gefitinib resulted in a significant decrease in the total number of Ascl1-EGFP+ cells in the WM compared to Nx vehicle-treated mice. Hyp resulted in a significant expansion in the number of Ascl1-EGFP+ cells, which Gefitinib prevented (Hyp vehicle vs. Hyp Gefitinib, P<0.05) (n=4 for each group; One-way ANOVA, Bonferroni post hoc test for individual comparisons). All histograms are presented as means ± s.e.m. *P<0.05; **P<0.01. Scale bars, 50μm (a–d, f–i).
Extended Data Figure 5. Intranasal HB-EGF does enter the brain and activates EGFRs in oligodendrocyte lineage cells.
a–c, Saline or HB-EGF were administered intranasally once in P11 mice, which were then sacrificed at 1, 5, 15 and 30 minutes after administration. a, Western blot analysis was performed on microdissected WM probing for actin, HB-EGF and pEGFR (tyrosine 1068 phosphorylation site). In the Saline group, no HB-EGF was detected in WM and no change in pEGFR was detected. In the mice that received HB-EGF, the HB-EGF protein was detected at 5 minutes and increased up to 30 minutes. The pEGFR signal steadily increased at 5, 15 and 30 minutes after HB-EGF administration. b,c The line-graphs represent relative abundance of protein compared to actin (n=3 for each time point and condition). Line graphs are presented as means ± s.e.m. d, A Nx P11 mouse was administered HB-EGF and sacrificed 30 minutes later. Immunohistochemistry of pEGFR was performed. In the WM, there were several Rep+pEGFR+Dapi+ cells indicating that OL lineage cells express activated EGFR (pEGFR). Shown is a 40x representative image of the WM demonstrating Rep+pEGFR+Dapi+ cells. e, In this set of experiments, Hyp Rep mice received either intranasal Saline or HB-EGF from P11-P14 (Fig. 3b). The subcortical WM was microdissected at P15 and CNP-EGFP+ cells were FACS-purified. Western blot analysis was performed to probe for pEGFR. The Western blot demonstrates that a more robust signal for pEGFR was present in the Hyp HB-EGF-treated group, relative to actin (n=4 for each group of 2–3 pooled brains).
Extended Data Figure 6. Intranasal HB-EGF treatment increases the number of oligodendrocyte lineage cells derived from PDGFαR-expressing OPCs.
a, PDGFαR-CreER;Z/EG transgenic mice were divided into 4 groups. Saline or HB-EGF were administered intranasally. IP injections of tamoxifen were administered at P12, P13 and P14 in the AM and one hour prior to the morning dose of Saline/HB-EGF. Mice were sacrificed at P18. b–e, Representative 40x confocal images of CC1+ cells (red) derived from PDGFαR-CreER;Z/EG (GFP+) (green) progenitors at P18. f–i, Cells derived from PDGFαR-expressing progenitors after Hyp and after HB-EGF treatment belong to the oligodendrocyte lineage (Olig2+). Representative 40x confocal images of the subcortical WM in all 4 groups at P18. In serial sections from each PDGFαR-CreER;Z/EG mouse, all GFP+ cells in the subcortical WM co-stained with anti-Olig2+ antibody in all 4 groups (n=4 for each group). In all 4 groups, no GFP+ cells co-stained with anti-GFAP or anti-Glutamate/Aspartate Transporter (GLAST) antibody (data not shown). j, Hyp results in a significant increase in the number of GFP+ cells in the WM and HB-EGF has an additive effect (n=4 mice per group; One way ANOVA, Bonferroni post hoc test for individual comparisons). Histograms are presented as means ± s.e.m. Scale bars, 50μm (b–i). *P<0.05; **P<0.01.
Extended Data Figure 7. HB-EGF treatment prevents Hyp-induced changes in white matter axonal g-ratios at P30.

a–b, Scatter plots depicting g-ratios versus axon diameter. The lines represent linear fits to pooled data from all mice for each genotype (n=3 mice per group). a, The scatter plot demonstrates that the Nx Saline and Nx HB-EGF were similar. b, The scatter plot demonstrates that the Nx HB-EGF and Hyp HB-EGF were similar. c, Histogram demonstrating that, at P30, the percentage of myelinated subcortical WM fibers was significantly decreased in the Hyp Saline group. No significant different was found in the Hyp HB-EGF-treated group. *P<0.05; **P<0.01.
Extended Data Figure 8. Intranasal HB-EGF prevents loss of NAA after Hyp.
a, 1H-NMR spectroscopy was performed on dissected WM at P11, P18 and P30. A full-scale representative spectra is shown where the peak for NAA is at 2.0 ppm. The spectra shown on Fig 4l is truncated. b, Western blots of Aspartoacylase (ASPA), an enzyme found in OLs and responsible for hydrolyzation of NAA for myelin production in the developing brain. Hyp does not result in any significant change in the amount of ASPA present in the WM at each of the time points listed (P11 and P30: n=4 for each group and age; P18: n=5 for each group; One way ANOVA, Bonferroni post hoc test for individual comparisons, except P11 unpaired t-test). Histograms are presented as means ± s.e.m.
Extended Data Figure 9. Protocol for late HB-EGF administration used for this study.
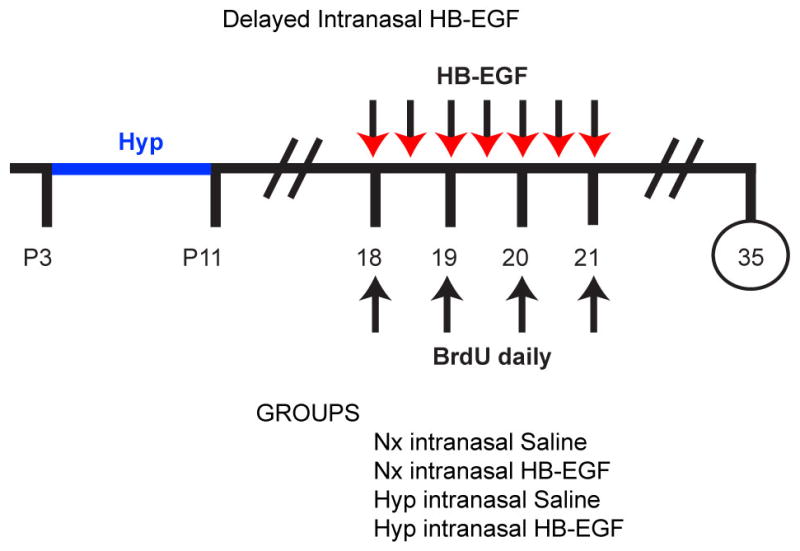
In this study, HB-EGF or Saline was administered at a later time point. Beginning in the morning of P18, HB-EGF or Saline was administered every 12 hours until the morning of P21. IP BrdU was administered one hour prior to HB-EGF or Saline administration, from P18-P21. The inclined beam-walking task was performed at P35. Only Rep mice were used for this study. The histogram is presented in Fig 4p.
Extended Data Figure 10. Intranasal HB-EGF accelerates oligodendrocyte maturation in WM after Hyp by preventing Notch activation.
a, Microdissected WM was probed for activated Notch Intracellular Domain (NICD) and its ligand Delta1. Western blot analysis obtained from microdissected WM at P11, P14.5 and P18 with actin as a loading control. Histograms represent quantification of the density of NICD (b) and Delta1 (c) signal normalized to actin. b, At P11 and P14.5, there was a significant increase in the amount of NICD in the Hyp group. No significant difference was evident at P18. The Hyp HB-EGF treated mice had no significant increase at P14.5 compared to Nx, and significantly less than the Hyp Saline group (n=4 mice for each group and age; One way ANOVA, Bonferroni post hoc test for individual comparisons). c, Delta1 was increased at P14.5 only in the Hyp Saline group (P11: n=4 for each group; P14.5 and P18: n=5 for each group and age; One way ANOVA, Bonferroni post hoc test for individual comparisons). d–g, Representative 40x confocal images of subcortical WM in the transgenic Notch reporter (TNR) mice, where EGFP is expressed upon activation of Notch-effector C-promoter binding factor 1 (CBF1), a downstream transcriptional target of Notch. h, Histogram represents the number of EGFP+Olig2+ cells at P14.5 in the WM. The Hyp Saline group displayed a significant increase in EGFP+Olig2+ cells, corresponding to enhanced Notch activation in OL lineage cells. This contributes to delayed maturation of OL lineage cells observed after Hyp (n=4 mice per group; One-way ANOVA, Bonferroni post hoc test for individual comparisons). Histogram is presented as means ± s.e.m. Scale bars, 50μm (d–g). *P<0.05; **P<0.01.
Acknowledgments
We thank Dr. Jeff Dupree (VCU) for advise on EM analysis. We thank Drs. Li-Jin Chew, Joshua Corbin and Judy Liu for comments on the manuscript. We thank Dr. Mary McKenna (UMd) for discussion on metabolic studies. We thank Dr. Dwight Bergles (JHU) for providing the PDGFαR-CreER mice and Dr. David W. Threadgill (NC State U) for the EGFRfl/fl mice. We thank Dr. Roger Packer for his support. This work was supported by National Institutes of Health grants: K08NS073793 (J.S.); NSADA K12NS052159 (JS); K08NS069815 (S.S); P01 NS062686 (V.G, T.L.H); R01NS045702 (V.G.); R01NS056427 (V.G.); P30HD040677 (V.G.); R01MH067528 (F.H.); P30 NS05219 (F.H. and D.C.); R01CA140102 (F.H., D.C., Y.H.); R01EB011968 (F.H., D.C.); and the Pioneer Award DP1 OD006850 (T.L.H.). The Childhood Brain Tumor Foundation (J.S.) and the National Brain Tumor Society (J.S.) also provided support.
Footnotes
SUPPLEMENTARY INFORMATION
Supplementary information is linked to the online version of the paper at www.nature.com/nature
AUTHOR CONTRIBUTIONS
J.S. designed all experiments with V.G. J.S. performed all experiments except electron microscopy and DTI imaging. T.H. performed all the Notch analysis. S.S. performed metabolic studies. J.R. and J.S. performed all electrophysiological analysis of CAPs. B.J. and M.R assisted with experiments. K.S. and T.L.H. performed the electron microscopy studies. D.C., Y.H. and F.H. performed DTI imaging and analysis. R.J.M. performed statistical analysis with J.S. on all behavioral experiments. V.G. supervised the entire project. J.S. and V.G. wrote the manuscript.
Reprints and permission information are available at www.nature.com/reprints.
The authors declare no competing financial interests.
References
- 1.Ment LR, Hirtz D, Huppi PS. Imaging biomarkers of outcome in the developing preterm brain. Lancet Neurol. 2009;8:1042–1055. doi: 10.1016/S1474-4422(09)70257-1. [DOI] [PubMed] [Google Scholar]
- 2.Woodward LJ, Anderson PJ, Austin NC, Howard K, Inder TE. Neonatal MRI to Predict Neurodevelopmental Outcomes in Preterm Infants. New England Journal of Medicine. 2006;355:685–694. doi: 10.1056/NEJMoa053792. [DOI] [PubMed] [Google Scholar]
- 3.Buser JR, et al. Arrested preoligodendrocyte maturation contributes to myelination failure in premature infants. Annals of Neurology. 2012;71:93–109. doi: 10.1002/ana.22627. [DOI] [PMC free article] [PubMed] [Google Scholar]
- 4.Aguirre A, Dupree JL, Mangin JM, Gallo V. A functional role for EGFR signaling in myelination and remyelination. Nat Neurosci. 2007;10:990–1002. doi: 10.1038/nn1938. http://www.nature.com/neuro/journal/v10/n8/suppinfo/nn1938_S1.html. [DOI] [PubMed] [Google Scholar]
- 5.Anjari M, et al. The Association of Lung Disease With Cerebral White Matter Abnormalities in Preterm Infants. Pediatrics. 2009;124:268–276. doi: 10.1542/peds.2008-1294. [DOI] [PubMed] [Google Scholar]
- 6.Skranes J, et al. Clinical findings and white matter abnormalities seen on diffusion tensor imaging in adolescents with very low birth weight. Brain. 2007;130:654–666. doi: 10.1093/brain/awm001. [DOI] [PubMed] [Google Scholar]
- 7.Scafidi J, Fagel DM, Ment LR, Vaccarino FM. Modeling premature brain injury and recovery. International Journal of Developmental Neuroscience. 2009;27:863–871. doi: 10.1016/j.ijdevneu.2009.05.009. [DOI] [PMC free article] [PubMed] [Google Scholar]
- 8.Silbereis JC, Huang EJ, Back SA, Rowitch DH. Towards improved animal models of neonatal white matter injury associated with cerebral palsy. Disease Models & Mechanisms. 2010;3:678–688. doi: 10.1242/dmm.002915. [DOI] [PMC free article] [PubMed] [Google Scholar]
- 9.Back SA, et al. Late Oligodendrocyte Progenitors Coincide with the Developmental Window of Vulnerability for Human Perinatal White Matter Injury. The Journal of Neuroscience. 2001;21:1302–1312. doi: 10.1523/JNEUROSCI.21-04-01302.2001. [DOI] [PMC free article] [PubMed] [Google Scholar]
- 10.Ivkovic S, Canoll P, Goldman JE. Constitutive EGFR Signaling in Oligodendrocyte Progenitors Leads to Diffuse Hyperplasia in Postnatal White Matter. The Journal of Neuroscience. 2008;28:914–922. doi: 10.1523/jneurosci.4327-07.2008. [DOI] [PMC free article] [PubMed] [Google Scholar]
- 11.Aguirre A, Rubio ME, Gallo V. Notch and EGFR pathway interaction regulates neural stem cell number and self-renewal. Nature. 2010;467:323–327. doi: 10.1038/nature09347. http://www.nature.com/nature/journal/v467/n7313/abs/nature09347.html-supplementary-information. [DOI] [PMC free article] [PubMed] [Google Scholar]
- 12.Yuan X, et al. Expression of the green fluorescent protein in the oligodendrocyte lineage: A transgenic mouse for developmental and physiological studies. Journal of Neuroscience Research. 2002;70:529–545. doi: 10.1002/jnr.10368. [DOI] [PubMed] [Google Scholar]
- 13.Aguirre A, Rizvi TA, Ratner N, Gallo V. Overexpression of the Epidermal Growth Factor Receptor Confers Migratory Properties to Nonmigratory Postnatal Neural Progenitors. The Journal of Neuroscience. 2005;25:11092–11106. doi: 10.1523/JNEUROSCI.2981-05.2005. [DOI] [PMC free article] [PubMed] [Google Scholar]
- 14.Hibbits N, Pannu R, John Wu T, Armstrong RC. Cuprizone demyelination of the corpus callosum in mice correlates with altered social interaction and impaired bilateral sensorimotor coordination. ASN NEURO. 2009;1 doi: 10.1042/AN20090032. [DOI] [PMC free article] [PubMed] [Google Scholar]
- 15.Liebetanz D, Merkler D. Effects of commissural de- and remyelination on motor skill behaviour in the cuprizone mouse model of multiple sclerosis. Experimental Neurology. 2006;202:217–224. doi: 10.1016/j.expneurol.2006.05.032. [DOI] [PubMed] [Google Scholar]
- 16.Schalomon PM, Wahlsten D. Wheel running behavior is impaired by both surgical section and genetic absence of the mouse corpus callosum. Brain Research Bulletin. 2002;57:27–33. doi: 10.1016/s0361-9230(01)00633-5. [DOI] [PubMed] [Google Scholar]
- 17.Brooks SP, Dunnett SB. Tests to assess motor phenotype in mice: a user’s guide. Nat Rev Neurosci. 2009;10:519–529. doi: 10.1038/nrn2652. http://www.nature.com/nrn/journal/v10/n7/suppinfo/nrn2652_S1.html. [DOI] [PubMed] [Google Scholar]
- 18.Carter RJ, Morton J, Dunnett SB. Current Protocols in Neuroscience. John Wiley & Sons, Inc; 2001. [DOI] [PubMed] [Google Scholar]
- 19.Heimberger AB, et al. Brain Tumors in Mice Are Susceptible to Blockade of Epidermal Growth Factor Receptor (EGFR) with the Oral, Specific, EGFR-Tyrosine Kinase Inhibitor ZD1839 (Iressa) Clinical Cancer Research. 2002;8:3496–3502. [PubMed] [Google Scholar]
- 20.Jin K, et al. Cerebral neurogenesis is induced by intranasal administration of growth factors. Annals of Neurology. 2003;53:405–409. doi: 10.1002/ana.10506. [DOI] [PubMed] [Google Scholar]
- 21.Illum L. Transport of drugs from the nasal cavity to the central nervous system. European Journal of Pharmaceutical Sciences. 2000;11:1–18. doi: 10.1016/s0928-0987(00)00087-7. [DOI] [PubMed] [Google Scholar]
- 22.Dhuria SV, Hanson LR, Frey WH. Intranasal delivery to the central nervous system: Mechanisms and experimental considerations. Journal of Pharmaceutical Sciences. 2010;99:1654–1673. doi: 10.1002/jps.21924. [DOI] [PubMed] [Google Scholar]
- 23.Cantarella C, Cayre M, Magalon K, Pascale D. Intranasal HB-EGF administration favors adult SVZ cell mobilization to demyelinated lesions in mouse corpus callosum. Developmental Neurobiology. 2008;68:223–236. doi: 10.1002/dneu.20588. [DOI] [PubMed] [Google Scholar]
- 24.Sugiarto S, et al. Asymmetry-Defective Oligodendrocyte Progenitors Are Glioma Precursors. Cancer Cell. 2011;20:328–340. doi: 10.1016/j.ccr.2011.08.011. [DOI] [PMC free article] [PubMed] [Google Scholar]
- 25.Kang SH, Fukaya M, Yang JK, Rothstein JD, Bergles DE. NG2+ CNS Glial Progenitors Remain Committed to the Oligodendrocyte Lineage in Postnatal Life and following Neurodegeneration. Neuron. 2010;68:668–681. doi: 10.1016/j.neuron.2010.09.009. [DOI] [PMC free article] [PubMed] [Google Scholar]
- 26.Zhang Y, et al. Notch1 signaling plays a role in regulating precursor differentiation during CNS remyelination. Proceedings of the National Academy of Sciences. 2009;106:19162–19167. doi: 10.1073/pnas.0902834106. [DOI] [PMC free article] [PubMed] [Google Scholar]
- 27.Raymond M, Li P, Mangin JM, Huntsman M, Gallo V. Chronic Perinatal Hypoxia Reduces Glutamate AiAspartate Transporter Function in Astrocytes through the Janus Kinase/Signal Transducer and Activator of Transcription Pathway. The Journal of Neuroscience. 2011;31:17864–17871. doi: 10.1523/JNEUROSCI.3179-11.2011. [DOI] [PMC free article] [PubMed] [Google Scholar]
- 28.Bi B, et al. Cortical Glial Fibrillary Acidic Protein-Positive Cells Generate Neurons after Perinatal Hypoxic Injury. The Journal of Neuroscience. 2011;31:9205–9221. doi: 10.1523/JNEUROSCI.0518-11.2011. [DOI] [PMC free article] [PubMed] [Google Scholar]
- 29.Aguirre A, Dupree JL, Mangin JM, Gallo V. A functional role for EGFR signaling in myelination and remyelination. Nat Neurosci. 2007;10:990–1002. doi: 10.1038/nn1938. http://www.nature.com/neuro/journal/v10/n8/suppinfo/nn1938_S1.html. [DOI] [PubMed] [Google Scholar]
- 30.Aguirre A, Rubio ME, Gallo V. Notch and EGFR pathway interaction regulates neural stem cell number and self-renewal. Nature. 2010;467:323–327. doi: 10.1038/nature09347. http://www.nature.com/nature/journal/v467/n7313/abs/nature09347.html-supplementary-information. [DOI] [PMC free article] [PubMed] [Google Scholar]
- 31.Yuan X, et al. Expression of the green fluorescent protein in the oligodendrocyte lineage: A transgenic mouse for developmental and physiological studies. Journal of Neuroscience Research. 2002;70:529–545. doi: 10.1002/jnr.10368. [DOI] [PubMed] [Google Scholar]
- 32.Kang SH, Fukaya M, Yang JK, Rothstein JD, Bergles DE. NG2+ CNS Glial Progenitors Remain Committed to the Oligodendrocyte Lineage in Postnatal Life and following Neurodegeneration. Neuron. 2010;68:668–681. doi: 10.1016/j.neuron.2010.09.009. [DOI] [PMC free article] [PubMed] [Google Scholar]
- 33.Lee T-C, Threadgill DW. Generation and validation of mice carrying a conditional allele of the epidermal growth factor receptor. genesis. 2009;47:85–92. doi: 10.1002/dvg.20464. [DOI] [PMC free article] [PubMed] [Google Scholar]
- 34.Ment LR, VBAW, et al. CHange in cognitive function over time in very low-birth-weight infants. JAMA: The Journal of the American Medical Association. 2003;289:705–711. doi: 10.1001/jama.289.6.705. [DOI] [PubMed] [Google Scholar]
- 35.Ment LR, et al. Longitudinal Brain Volume Changes in Preterm and Term Control Subjects During Late Childhood and Adolescence. Pediatrics. 2009;123:503–511. doi: 10.1542/peds.2008-0025. [DOI] [PMC free article] [PubMed] [Google Scholar]
- 36.Raymond M, Li P, Mangin JM, Huntsman M, Gallo V. Chronic Perinatal Hypoxia Reduces Glutamate‚ÄìAspartate Transporter Function in Astrocytes through the Janus Kinase/Signal Transducer and Activator of Transcription Pathway. The Journal of Neuroscience. 2011;31:17864–17871. doi: 10.1523/JNEUROSCI.3179-11.2011. [DOI] [PMC free article] [PubMed] [Google Scholar]
- 37.Bi B, et al. Cortical Glial Fibrillary Acidic Protein-Positive Cells Generate Neurons after Perinatal Hypoxic Injury. The Journal of Neuroscience. 2011;31:9205–9221. doi: 10.1523/JNEUROSCI.0518-11.2011. [DOI] [PMC free article] [PubMed] [Google Scholar]
- 38.Jablonska B, et al. Oligodendrocyte Regeneration after Neonatal Hypoxia Requires FoxO1-Mediated p27Kip1 Expression. The Journal of Neuroscience. 2012;32:14775–14793. doi: 10.1523/JNEUROSCI.2060-12.2012. [DOI] [PMC free article] [PubMed] [Google Scholar]
- 39.Back SA, et al. Late Oligodendrocyte Progenitors Coincide with the Developmental Window of Vulnerability for Human Perinatal White Matter Injury. The Journal of Neuroscience. 2001;21:1302–1312. doi: 10.1523/JNEUROSCI.21-04-01302.2001. [DOI] [PMC free article] [PubMed] [Google Scholar]
- 40.Born J, et al. Sniffing neuropeptides: a transnasal approach to the human brain. Nat Neurosci. 2002;5:514–516. doi: 10.1038/nn849. [DOI] [PubMed] [Google Scholar]
- 41.Thorne RG, Pronk GJ, Padmanabhan V, Frey WH., II Delivery of insulin-like growth factor-I to the rat brain and spinal cord along olfactory and trigeminal pathways following intranasal administration. Neuroscience. 2004;127:481–496. doi: 10.1016/j.neuroscience.2004.05.029. http://dx.doi.org/10.1016/j.neuroscience.2004.05.029. [DOI] [PubMed] [Google Scholar]
- 42.Ross TM, et al. Intranasal administration of interferon beta bypasses the blood‚Äìbrain barrier to target the central nervous system and cervical lymph nodes: a non-invasive treatment strategy for multiple sclerosis. Journal of Neuroimmunology. 2004;151:66–77. doi: 10.1016/j.jneuroim.2004.02.011. http://dx.doi.org/10.1016/j.jneuroim.2004.02.011. [DOI] [PubMed] [Google Scholar]
- 43.Fletcher L, et al. Intranasal delivery of erythropoietin plus insulin-like growth factor‚ÄìI for acute neuroprotection in stroke. Journal of Neurosurgery. 2009;111:164–170. doi: 10.3171/2009.2.jns081199. [DOI] [PubMed] [Google Scholar]
- 44.Ishibashi N, et al. White Matter Protection in Congenital Heart Surgery/Clinical Perspective. Circulation. 2012;125:859–871. doi: 10.1161/CIRCULATIONAHA.111.048215. [DOI] [PMC free article] [PubMed] [Google Scholar]
- 45.Ritter J, et al. Neonatal Hyperoxia Exposure Disrupts Axon-Oligodendrocyte Integrity in the Subcortical White Matter. The Journal of Neuroscience. 2013;33:8990–9002. doi: 10.1523/jneurosci.5528-12.2013. [DOI] [PMC free article] [PubMed] [Google Scholar]
- 46.Whalen MJ, et al. Acute plasmalemma permeability and protracted clearance of injured cells after controlled cortical impact in mice. J Cereb Blood Flow Metab. 2007;28:490–505. doi: 10.1038/sj.jcbfm.9600544. [DOI] [PMC free article] [PubMed] [Google Scholar]
- 47.Aguirre A, Gallo V. Postnatal Neurogenesis and Gliogenesis in the Olfactory Bulb from NG2-Expressing Progenitors of the Subventricular Zone. The Journal of Neuroscience. 2004;24:10530–10541. doi: 10.1523/jneurosci.3572-04.2004. [DOI] [PMC free article] [PubMed] [Google Scholar]
- 48.Furusho M, Dupree JL, Nave K-A, Bansal R. Fibroblast Growth Factor Receptor Signaling in Oligodendrocytes Regulates Myelin Sheath Thickness. The Journal of Neuroscience. 2012;32:6631–6641. doi: 10.1523/jneurosci.6005-11.2012. [DOI] [PMC free article] [PubMed] [Google Scholar]
- 49.Zhou Y-X, Pannu R, Le TQ, Armstrong RC. Fibroblast growth factor 1 (FGFR1) modulation regulates repair capacity of oligodendrocyte progenitor cells following chronic demyelination. Neurobiology of Disease. 2012;45:196–205. doi: 10.1016/j.nbd.2011.08.004. [DOI] [PMC free article] [PubMed] [Google Scholar]
- 50.Liu J, et al. Impaired adult myelination in the prefrontal cortex of socially isolated mice. Nat Neurosci. 2012;15:1621–1623. doi: 10.1038/nn.3263. http://www.nature.com/neuro/journal/v15/n12/abs/nn.3263.html-supplementary-information. [DOI] [PMC free article] [PubMed] [Google Scholar]
- 51.Duque A, et al. Neuroanatomical changes in a mouse model of early life neglect. Brain Structure and Function. 2012;217:459–472. doi: 10.1007/s00429-011-0350-9. [DOI] [PMC free article] [PubMed] [Google Scholar]
- 52.Chahboune H, et al. Hypoxic Injury during Neonatal Development in Murine Brain: Correlation between In Vivo DTI Findings and Behavioral Assessment. Cerebral Cortex. 2009;19:2891–2901. doi: 10.1093/cercor/bhp068. [DOI] [PMC free article] [PubMed] [Google Scholar]
- 53.Crawford DK, Mangiardi M, Tiwari-Woodruff SK. Assaying the functional effects of demyelination and remyelination: Revisiting field potential recordings. Journal of Neuroscience Methods. 2009;182:25–33. doi: 10.1016/j.jneumeth.2009.05.013. http://dx.doi.org/10.1016/j.jneumeth.2009.05.013. [DOI] [PubMed] [Google Scholar]
- 54.Scafidi S, et al. Metabolism of acetyl-l-carnitine for energy and neurotransmitter synthesis in the immature rat brain. Journal of Neurochemistry. 2010;114:820–831. doi: 10.1111/j.1471-4159.2010.06807.x. [DOI] [PMC free article] [PubMed] [Google Scholar]
- 55.Schalomon PM, Wahlsten D. Wheel running behavior is impaired by both surgical section and genetic absence of the mouse corpus callosum. Brain Research Bulletin. 2002;57:27–33. doi: 10.1016/s0361-9230(01)00633-5. [DOI] [PubMed] [Google Scholar]
- 56.Liebetanz D, Merkler D. Effects of commissural de- and remyelination on motor skill behaviour in the cuprizone mouse model of multiple sclerosis. Experimental Neurology. 2006;202:217–224. doi: 10.1016/j.expneurol.2006.05.032. [DOI] [PubMed] [Google Scholar]
- 57.Hibbits N, Pannu R, John Wu T, Armstrong RC. Cuprizone demyelination of the corpus callosum in mice correlates with altered social interaction and impaired bilateral sensorimotor coordination. ASN NEURO. 2009;1 doi: 10.1042/AN20090032. [DOI] [PMC free article] [PubMed] [Google Scholar]
- 58.Carter RJ, Morton J, Dunnett SB. Current Protocols in Neuroscience. John Wiley & Sons, Inc; 2001. [DOI] [PubMed] [Google Scholar]
- 59.Brooks SP, Dunnett SB. Tests to assess motor phenotype in mice: a user’s guide. Nat Rev Neurosci. 2009;10:519–529. doi: 10.1038/nrn2652. http://www.nature.com/nrn/journal/v10/n7/suppinfo/nrn2652_S1.html. [DOI] [PubMed] [Google Scholar]


