Abstract
Cancer is seen today more often as a manageable chronic disease, resulting in changing workplace characteristics of the patient with cancer. A growing number of employees continue to work while being treated for cancer or return to work shortly after their cancer treatment is completed. To respond to these changes and the potential impact on the working patient's attitude, employers need updated, factual information related to this patient population. This type of information will support future benefit considerations by employers on employee contributions and future employee health and productivity. In 2005, Amgen launched a 3-year initiative to better understand cancer as a chronic disease, as well as the impact on the working patient with cancer and on the employer. The data from this initiative described in this article provide insights into cancer as a chronic and manageable disease in the workforce, and the broader implications to payers and employers.
Advances in the diagnosis and treatment of cancer in recent decades have dramatically improved the life expectancy, quality of life, and productivity of patients with cancer. Today, a growing number of employees remain in the workforce while they are being treated for cancer or return to work after their treatments are completed. Cancer is being seen as a chronic and manageable disease in the workforce, similar to diabetes or asthma. Henry and colleagues report that the most cited reasons why employees with cancer remain on the job either full-time or part-time are because they need to work, prefer to work, or feel well enough to work.1 In addition, working patients with cancer are taking on an increased burden for costs related to their cancer treatments through cost-shifting.2 In response to this cost-shifting environment and subsequent impact on employee cost burden and changing work patterns and productivity, it is imperative that employers and payers, like managed care organizations, work toward developing a better balance of benefit designs and employee contributions/copayments with employee health and productivity.
A 3-Year Collaborative Initiative
In 2005, Amgen launched the Working Patient with Cancer (WPWC) initiative, which was a 3-year program that encompassed several studies, to gain a better understanding of the implications of cancer as a chronic and manageable disease in the active workforce, and the relevance of these implications for payers and employers. This was a collaboration among industry, employers, and payers and involved working with the RAND Corporation and Milliman, Inc; employers, including Coca-Cola and Kodak; and payers, including WellPoint and UnitedHealthcare.
The WPWC initiative was designed to create a clearer profile of the working patient with cancer, identify these patients within the workforce, better understand cancer as a chronic disease, and understand patients' attitudes about working while receiving cancer treatment. The initiative also reviewed the healthcare spending trends of these working patients, as well as the pressures they encountered with care-related cost-shifting. Implementation of this initiative involved several key milestones, including:
Profiling the commercially insured working patient with cancer to better understand the impacts on productivity, relationships with coworkers, and how these resultant behaviors affected both employers and payers
Defining patients' attitudes about working while receiving cancer treatments and understanding their motivations, behaviors, and needs
Measuring the changing workplace patterns of the working patient with cancer, including turnover, short-term and long-term disability, replacement worker costs, and the cost of goods and overhead
Demonstrating the connection between cancer treatment, cost-shifting to employees, and the changing forces driving cancer care costs.
KEY POINTS
-
▸
Employers need factual information to better balance benefit designs and employee contributions/copayments with employee health and productivity. If working patients with cancer are adequately supported, they can remain productive while receiving cancer treatment.
-
▸
In recent years, out-of-pocket costs for health plan members increased more than 5 times faster than the cost of living.
-
▸
Recent trends show changing workplace attitudes among employees with cancer. Breast cancer was the most common cancer in employees who continue to work while receiving cancer treatment: 56% of breast cancer patients remained with the same employer 5 years after their initial diagnosis; 34% remained with the same employer for 9 years.
-
▸
Drug costs consistently represent 20% of the total costs across all cancer types. Costs are further increased when patients receive chemotherapy, or in the presence of 1 or more comorbidities.
-
▸
Total cancer healthcare costs are greatest during the first year of cancer diagnosis and treatment. Consequently, patient out-of-pocket costs are highest in that period.
Treating cancer patients who are working involves a continuum of interrelated direct costs—both medical and nonmedical. Included in the direct medical costs are medical testing, cancer treatment, and laboratory tests; included in the nonmedical costs are direct labor costs and replacement worker costs.
It is important to understand who high-utilizing patients are, increase awareness of their continued presence in the workforce, and create an appropriate benefit design that will have positive implications on better managing these patients. Thus, effective administrative management of the working patient with cancer, in addition to effective clinical management, should result in improved productivity and cost-savings to the payer and the employer.
Profile of the Working Patient with Cancer
In the study conducted by Henry and colleagues, among employees younger than 65 years, 46% cited financial need as their primary reason for continuing to work while receiving chemotherapy or radiation therapy.1 Although financial need was the most frequently cited reason, other important reasons for continuing to work included maintaining momentum toward potential advancement, being around coworkers and other people, and refusal to let cancer dominate their life or keep them from their routines.1
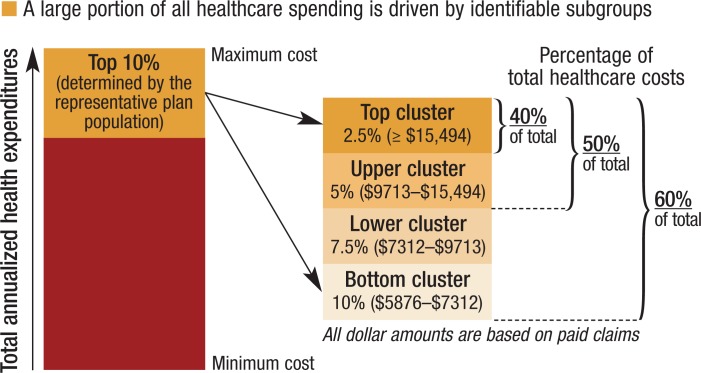
Analysis of HealthCore data showed that individuals in the top 10% of claim costs were responsible for 60% of all healthcare spending in the health plan (Figure 1).3 Furthermore, the top 2.5% of health plan members' medical costs were responsible for 40% of the total health plan expenditures.3,4 Based upon this data set of commercially insured individuals (aged 18–65 years), 69% of patients with cancer were the primary employee, versus the employee's spouse or dependent. Breast cancer was the most common type of cancer in the study, affecting 49.7% of patients, followed by gastrointestinal (GI) cancer, affecting 20.8% of patients. The majority of patients (58%) were 51 to 64 years old; however, a relatively high percentage (39%) were in the 31 to 50 age-group.3
Figure 1. “High-Cost Patient” Stratification: The Top 10%, by Claims Cost.
Source: HealthCore, 2002–2005 claims data set.
Drug costs for most cancer types studied, including costs for cancer treatment from inpatient and outpatient pharmacy claims, accounted for an estimated 21% of the total healthcare costs compared with 79% for other medical services. Medical service costs included non–drug-related costs, such as hospitalizations, office visits, and laboratory tests.3 In addition to the findings of higher medical service costs versus drug costs, there was a notable divergence in total expenditures for patients receiving chemotherapy versus patients not receiving chemotherapy.
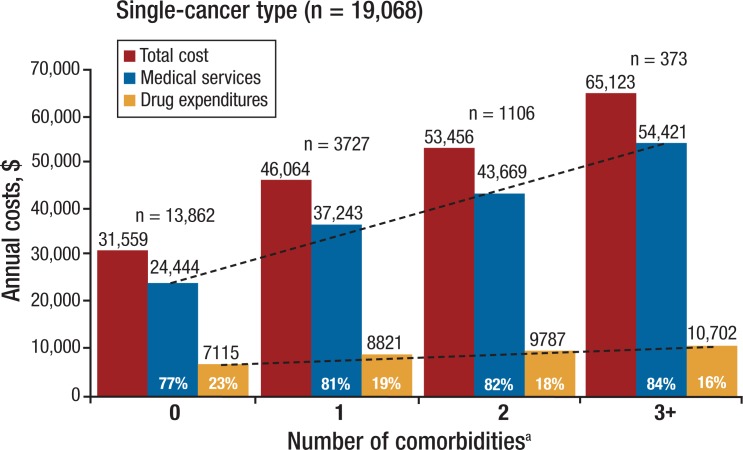
Based on paid claims data from HealthCore for the period 2002–2005, the combined total annual cost for working patients undergoing chemotherapy (n = 7693) was approximately $76,000 compared with approximately $21,000 for patients not receiving chemotherapy (n = 3101).3 Secondary analysis identified that the presence of comorbid conditions also drove up costs. Based on annualized health expenditures for patients with a single cancer type (n = 19,068), both the total costs and the medical service expenditures increased with each additional comorbidity (Figure 2).3 Medical costs for patients with 3 or more comorbidities are more than twice the costs associated with patients with no comorbidities. These data demonstrated that drug costs increased slightly with each additional comorbidity, but medical services costs, and subsequently total costs, increased at a far greater rate. When cancer is coupled with multiple overlapping chronic diseases, particularly complex conditions such as diabetes or chronic renal disease, the impact on cost increases considerably, especially among patients older than 50 years.4
Figure 2. Annualized Health Expenditures: Impact, by Degree of Comorbidity.
aComorbidity combinations: All patients have only 1 cancer diagnosis. Patients with 2 or more conditions have a combination of 1 cancer condition with 1 or more of the following conditions: rheumatoid arthritis, multiple sclerosis, hepatitis C, chronic kidney disease, cerebrovascular accident, coronary artery disease, chronic obstructive pulmonary disease, diabetes, or asthma. (This excludes multicancer patients, n = 1726.)
Source: HealthCore, 2002–2005 claims data set.
When measuring the cost of cancer there is no representative “average cancer patient,” after considering the wide variations in spending for different types of cancer, treatment variations, and comorbid conditions. It is important to be aware of the range beyond the average, to avoid making faulty decisions based upon a misleading value. When reviewing and making decisions, sub-analysis consideration must be given to the type of cancer and the presence or absence of additional chemotherapy regimens used. This more in-depth analysis should then be overlaid against secondary medical complications and comorbidities.
Workplace Impact and Productivity Patterns
The study by Henry and colleagues included nearly 64,000 employees of all ages with cancer, revealing that 43% of those receiving chemotherapy or radiation therapy reported working part-time or full-time during cancer treatment.1 Side effects associated with cancer and cancer treatment cannot be overlooked as an important factor in managing working patients with cancer. Because side effects can result in lost work time, it is important to build a benefit design that provides a flexible workplace schedule for patients who choose to work while receiving chemotherapy or radiation therapy. Some of the effects of chemotherapy may require patients to limit the number of hours they can work on a daily basis, particularly in cases of fatigue, nausea, and vomiting.
On average, working patients with cancer in this study missed 26 workdays because of chemotherapy or radiation therapy, and 18 days because of treatment of side effects.1 Patients with the greatest number of side effects missed significantly more workdays.1 Some employees assuming a supportive or caregiver role to a working patient with cancer may also miss time from work to accompany a spouse, a child, a friend, or a relative who is receiving active treatments. An estimated 77% of working patients with cancer indicated that they were accompanied by a caregiver on visits for active treatments.1
Oncology Healthcare Cost Drivers and Trends
Two studies were conducted with HealthCore claims data to determine the year-over-year overall healthcare cost trends among oncology patients, including medical and drug costs.5,6 A secondary objective was to determine the relative contribution of cancer treatment, including biologics used in therapeutic and supportive roles, to the overall cost of healthcare. HealthCore data were used because of the comprehensive availability of relevant medical and drug cost data, in both the inpatient and ambulatory settings, and sourcing utilization claims from 12 states. The commercially insured study cohort included 74,630 patients with cancer.5
Because cancer has become a longitudinal multiyear condition rather than an episodic incident, costs for working patients with cancer were measured within the “index year,” defined as the year of diagnosis, and typically the year of highest utilization. In addition, the complete cost history was reviewed, including all years of continuous enrollment in the plan for the working patient with cancer, beginning with the index year and through disenrollment.
Although medical costs can increase over a patient's history, the increase is typically much less in latter years than in the index year. The unique impact on out-of-pocket burden during the index year versus the “average” year can be seen in Figure 3.
Figure 3. Medical Services and Drug-Cost Trends.
Δx.x% indicates percent change over previous year.
Source: HealthCore, 2002–2006 paid claims. Data on file.
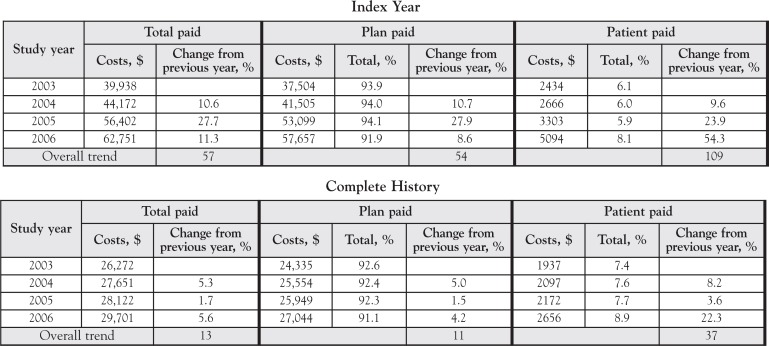
The “complete history” graph shows that the average annual cost for a working patient with cancer in 2006 was $20,701; assuming patient coinsurance of 10%, the patient would have paid $2070 in out-of-pocket obligations.
Looking at the “index year” graph, the patient's annual cost was $48,233. Here, with a 10% coinsurance, the patient would pay $4823 in out-of-pocket expenses, which is a substantial financial burden.5 Also, from 2003 to 2006 in the index year cases, medical costs exceeded drug cost increases in absolute dollars and in year-over-year percent increases, reflecting a changing landscape of reimbursement and utilization in both categories. During the index year period from 2003 to 2006, total healthcare costs increased by 57%, and patients' out-of-pocket costs increased by 109% (Figure 4).5 Medical costs, including diagnostic and laboratory tests, increased at the rate of nearly 49% during the same period, whereas drug costs increased by 52%.10 Notably, this was the same period in which higher copayments and deductibles were implemented.
Figure 4. Health Plan Paid versus Patient Out-of-Pocket.
Source: HealthCore, 2002–2006 paid claims. Data on file.
When out-of-pocket costs become too high for a patient, compliance has been shown to decrease, causing a ripple effect in the patient's overall health.7 When the patient's overall health suffers, there is potential for additional costs, including doctor visits, emergency room visits, and hospitalizations. The increasing financial burden for the working patient with cancer, particularly in the first year of diagnosis, requires payers to create flexible and affordable solutions that respond effectively to a changing healthcare environment.
Creating a “cap,” or maximum, of out-of-pocket expenses for routine and office services may also help limit patient financial burden, particularly in the first year. Employers who create more holistic benefit designs that are responsive to the working patient with cancer may reap the rewards of a stable, loyal workforce, and a lower rate of employee turnover.
Benefit Design for Working Patients with Cancer
As the healthcare marketplace evolves, there is a growing concern over cost-shifting to the employee, because household income levels are significantly lagging increasing copayments and insurance premiums. Between 2002 and 2004, using Milliman employer data, the domestic cost of living increased by nearly 5%, whereas health plan members' out-of-pocket costs increased by 29%—more than 5 times faster than the cost of living.8 Since 2004, these costs have continued to rise, and some patients are headed toward a point of maximum tolerance, where out-of-pocket healthcare costs are beginning to exceed their ability to pay.9 If out-of-pocket costs become prohibitive, employees may make inappropriate choices, resulting in unintended consequences that affect total healthcare costs and quality of care.
Individuals with the highest healthcare costs bear a disproportionate share of out-of-pocket costs, as has been shown by Willey and colleagues.10 Based on a household income of $48,000, working patients with cancer who are in the top 1% of the healthcare cost range incur out-of-pocket costs equivalent to 7.5% of their total income.10 Similarly, patients in the top 5% of the healthcare cost range incur out-of-pocket costs equivalent to 6.3% of their total household income.2
It is often wrongly believed that health plan member turnover is high among patients who are severely ill. Enrollment data for HealthCore members from 2002 to 2004 showed that 42% of severely ill health plan members remained continuously enrolled at 48 months, whereas only 4.3% of enrollments were lost due to death.3 Because patients with cancer younger than age 65 years have a higher rate of survival than the average patient with cancer older than age 65 years, many patients younger than 65 were shown to return to work after their cancer treatment was completed.3
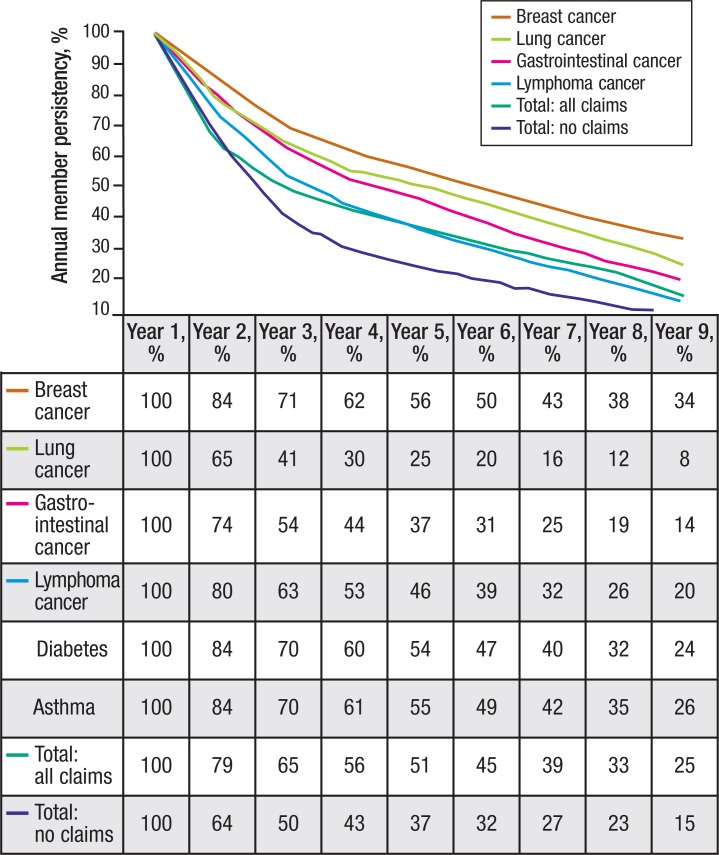
Results from employer research conducted by Milliman on annual employee persistency rates showed that 56% of patients with breast cancer were still on the job, with the same employer, 5 years after the initial diagnosis, and 34% of patients were with the same employer after 9 years (Figure 5).11 Specifically between years 3 and 9, patients with breast cancer had the highest persistency rate with the same employer compared with other types of cancer, diabetes, or asthma.11 Conversely, employees who had no claims and were assumed to be healthy had a 37% persistency rate with an employer at 5 years,11 suggesting that employees with chronic illnesses may actually be more likely to continue working with the same employer than healthy employees.11
Figure 5. Annual Employee Persistency Rates for Cancer and Various Medical Conditions.
Year 1 indicates base year.
Source: Milliman USA, 1996–2004 employer claims data set.
In addressing the multidimensional forces that can influence persistency with an employer, it is critical to remain clinically grounded when interpreting disparities in continuous employment rates based on factors such as aggressive cancer types, staging, and survivability. This study also showed that employees with lymphoma had a 46% persistency rate with the same employer at 5 years, and a 20% rate at 9 years.11 Those with GI cancer had a 37% persistency rate at 5 years, and 14% at 9 years; patients with lung cancer had a persistency rate of 25% at 5 years, and 8% at 9 years.11
Conclusion
Although a lack of consensus exists between the approach of the payer and the employer to burgeoning healthcare challenges, both the payer and the employer face long-term issues, and both seek long-term solutions for the working patient with cancer. Bridging common goals through improved transparency of information and data-driven benefit designs can more appropriately address the evolving role of working patients with cancer into a win-win strategy for bringing value to the employee, the employer, and the payer.
Biography

References
- 1.Henry DH, Viswanathan HN, Elkin EP, et al. Symptoms and treatment burden associated with cancer treatment: results from a cross-sectional national survey in the U.S. Support Care Center. 2008; 16: 791–801. Epub 2008 Jan 17. [DOI] [PubMed] [Google Scholar]
- 2.Milliman 2004 proprietary data for commercial static population. 2006 Statistical Abstract of the United States.
- 3.HealthCore, 2002–2005 claims data set. (HealthCore is a wholly owned subsidiary of WellPoint.)
- 4.Willey VJ, Pollack MF, Lednar WM, et al. Costs of severely ill members and specialty medication use in a commercially insured population. Health Aff (Millwood). 2008; 27: 824–834. [DOI] [PubMed] [Google Scholar]
- 5.HealthCore/WellPoint oncology patients identified from medical claims between January 1, 2002, and December 31, 2006.
- 6.Data presented as a peer-reviewed podium presentation at the 2008 annual meeting of the American Society of Clinical Oncology, May 30-June 3, 2008; Chicago, IL.
- 7.RAND Corporation. Redefining and reforming healthcare for the last years of life. 2006. www.rand.org/pubs/research_briefs/2006/RAND_RB9178.pdf. Accessed December 19, 2008.
- 8.Milliman 2002–2004 proprietary data for commercial static population. American Institute for Economic Research Cost-of-Living Calculator.
- 9.Goldman DP, Joyce GF, Lawless G, et al. Benefit design and specialty drug use. Health Aff (Millwood). 2006; 25: 1319–1331. [DOI] [PMC free article] [PubMed] [Google Scholar]
- 10.Willey VJ, Kopenski F, Lawless G. Beyond the myths: finding benefit design solutions that address the true costs of high healthcare use. Am J Manag Care. 2008; 14 (suppl): S252–S263. [PubMed] [Google Scholar]
- 11.Milliman USA, 1996–2004 employer claims data set.


