

Abstract
Citrate synthase (CS) activity is a validated biomarker for mitochondrial density in skeletal muscle. CS activity is also used as a biochemical marker of the skeletal muscle oxidative adaptation to a training intervention, and a relationship between changes in whole body aerobic capacity and changes in CS activity is often assumed. However, this relationship and absolute values of CS and maximal oxygen uptake (O2max) has never been assessed across different studies. A systematic PubMed search on literature published from 1983 to 2013 was performed. The search profile included: citrate, synthase, human, skeletal, muscle, training, not electrical stimulation, not in-vitro, not rats. Studies that reported changes in CS activity and O2max were included. Different training types and subject populations were analyzed independently to assess correlation between relative changes in O2max and CS activity. 70 publications with 97 intervention groups were included. There was a positive (r = 0.45) correlation (P < 0.001) between the relative change in O2max and the relative change in CS activity. All reported absolute values of CS and O2max did not correlate (r =- 0.07, n = 148, P = 0.4). Training induced changes in whole body oxidative capacity is matched by changes in muscle CS activity in a nearly 1:1 relationship. Absolute values of CS across different studies cannot be compared unless a standardized analytical method is used by all laboratories.
Keywords: Citrate synthase, endurance training, high-intensity interval training, human skeletal muscle, maximal oxygen uptake
Introduction
Cardiac output and not skeletal muscle enzymatic activity is the limiting factor to aerobic performance in healthy people [1]. Nevertheless, adequate muscle enzymatic activity in e.g. glycolysis and Krebs cycle is necessary for a high performance and maximal oxygen uptake (O2max). Enzymatic activity in human skeletal muscle, and in particular citrate synthase (CS) activity, has been used a marker of cellular oxidative capacity and mitochondrial density following a training regimen [2,3]. These enzyme activities are highly adaptable to aerobic training and during exercise a high enzymatic capacity is essential for optimal performance during aerobic exercise [4]. While these characteristics of oxidative enzymes have been known for decades, there is a lack of literature on the relationship between training induced changes in CS activity and whole body O2max. The relationship between O2max and CS activity may provide information on whether cardiovascular and local metabolic adaptations are coupled (i.e. do both systems adapt together), and in which subjects or training types does one change more than the other if one is more important to changes in O2max than the other?
A relationship between changes in O2max and changes in CS activity is assumed and often based on observations from classical endurance training (ET) studies with low intensity and long duration. Most of these studies have shown increased CS activity after training [5, 6] (Table 1), with seemingly similar effect in both genders (Coggan et al., 1992). In the last decade high-intensity interval training (HIIT) has received wide interest as a time-efficient training modality, using a very high intensity for a very short duration. HIIT has been shown to increase CS activity in most but not all studies [7-11].
Table 1.
Included studies
| Reference | Group characteristics | Intervention | Aerobic adaptations | |||||||||
|---|---|---|---|---|---|---|---|---|---|---|---|---|
|
| ||||||||||||
| Author | Year | Reference [##] | Group number | Group | Group characteristics | n | Gender | Training type | Total time trained (min) | Baseline O2max (ml·min-1·kg-1) | ΔCS activity (%) | ΔO2max (%) |
| Allenberg et al. | 1988 | [64] | 1 | DI | Patients with type 2 diabetes | 7 | Males | ET | 2232 | N/A | 36 | 7 |
| Bakkman et al. | 2007 | [66] | 2 | CON | Healthy young untrained | 8 | Mixed | ET | 480 | 45 | 21 | 40 |
| Bangsbo et al. | 2010 | [67] | 3 | CON | Untrained running group | 25 | Females | ET | 1920 | 33 | 11 | 15 |
| 4 | CON | Untrained football group | 25 | Females | ET | 1920 | 36 | 12 | 10 | |||
| Barnett et al. | 2004 | [51] | 5 | CON | Young healthy untrained | 16 | Males | HIT | 54 | N/A | 42 | 8 |
| Berthon et al. | 1995 | [68] | 6 | OLD | Healthy Elderly | 14 | Males | ET | 1440 | 35 | 46 | 6 |
| Blomstrand et al. | 2011 | [49] | 7 | CON | Healthy young sedentary | 5 | Mixed | ET | 1500 | 48 | 29 | 31 |
| 8 | CON | Healthy young sedentary | 4 | Mixed | HIT | 1080 | 48 | 7 | 26 | |||
| 9 | CON | Healthy young sedentary | 5 | Mixed | HIT | 1680 | 48 | 32 | 36 | |||
| Bruce et al. | 2004 | [5] | 10 | DI | T2DM patients | 6 | Males | ET | 1440 | 28 | 73 | 26 |
| 11 | CON | Healthy control | 7 | Males | ET | 1440 | 31 | 85 | 18 | |||
| Bruce et al. | 2006 | [69] | 12 | OB | Obese | 9 | Mixed | ET | 2400 | 24 | 68 | 26 |
| Brønstad et al. | 2012 | [108] | 13 | DI | COPD patients | 12 | Males | HIT | 288 | 20 | 28 | -1 |
| Burgomaster et al. | 2005 | [34] | 14 | CON | Healthy young recreationally active | 16 | Males | HIT | 198 | 49 | 11 | 6 |
| Burgomaster et al. | 2008 | [48] | 15 | CON | Healthy young recreationally active | 10 | Mixed | HIT | 45 | 41 | 16 | 7 |
| 16 | CON | Healthy young recreationally active | 10 | Mixed | ET | 1500 | 41 | 30 | 7 | |||
| Bylund et al. | 1977 | [4] | 17 | CON | Young healthy untrained | 20 | Males | ET | 5040 | N/A | 46 | 26 |
| Carter et al. | 2001 | [6] | 18 | CON | Healthy young active but untrained | 8 | Males | ET | 2100 | 42 | 40 | 17 |
| 19 | CON | Healthy young active but untrained | 8 | Females | ET | 2100 | 32 | 43 | 24 | |||
| Charifi et al. | 2003 | [65] | 20 | OLD | Elderly healthy untrained | 11 | Males | ET | 2520 | 29 | 33 | 14 |
| Coggan et al. | 1992 | [71] | 21 | OLD | Elderly healthy untrained | 12 | Males | ET | 6864 | 27 | 29 | 24 |
| 22 | OLD | Elderly healthy untrained | 11 | Males | ET | 6864 | 22 | 17 | 21 | |||
| Dawson et al. | 1998 | [9] | 23 | TR | Young fit | 9 | Males | HIT | N/A | 57 | -32 | 6 |
| Dubouchaud et al. | 2000 | [72] | 24 | CON | Healthy young sedentary | 9 | Males | ET | 3240 | 44 | 75 | 15 |
| Duscha et al. | 2012 | [43] | 25 | OLD | Obese healthy middle age/elderly | 40 | Mixed | ET | 32578 | 28 | 23 | 7 |
| 26 | OLD | Obese healthy middle age/elderly | 47 | Mixed | ET | 17784 | 29 | 39 | 11 | |||
| 27 | OLD | Obese healthy middle age/elderly | 41 | Mixed | ET | 33670 | 28 | 48 | 20 | |||
| Ferketich et al. | 1998 | [42] | 28 | OLD | Elderly | 24 | Females | ET | 1080 | 18 | 11 | 24 |
| Green et al. | 1992 | [103] | 29 | CON | Healthy young active but untrained | 9 | Males | ET | 720 | 55 | 5 | 2 |
| Green et al. | 1999 | [74] | 30 | CON | Yong healthy with low ΔO2max | 7 | Males | ET | 120 | 41 | 21 | 9 |
| Green et al. | 2000 | [75] | 31 | CON | Healthy young sedentary | 10 | Males | HIT | 96 | N/A | -2 | -2 |
| Green et al. | 2009 | [76] | 32 | CON | Young healthy | 9 | Males | ET | 600 | 48 | 14 | 4 |
| 33 | TR | Yong healthy with high ΔO2max | 7 | Males | ET | 120 | 51 | 30 | 2 | |||
| Gurd et al. | 2010 | [77] | 34 | CON | Healthy young active but untrained | 9 | Mixed | HIT | 720 | 45 | 31 | 11 |
| Harmer et al. | 2008 | [78] | 35 | DI | Young T1DM | 8 | Mixed | HIT | 56 | N/A | 11 | -9 |
| 36 | CON | Young healthy | 7 | Mixed | HIT | 56 | N/A | 42 | -3 | |||
| Heilbronn et al. | 2007 | [15] | 37 | OB | Insulin sensitive | 9 | Males | ET | 960 | 48 | 5 | 17 |
| 38 | DI | Insulin resistant | 9 | Males | ET | 960 | 48 | 5 | 11 | |||
| Hiatt et al. | 1996 | [59] | 39 | DI | Intermittent claudication | 10 | Males | ET | 2160 | 15 | 10 | 17 |
| Houmard et al. | 1993 | [61] | 40 | CON | Sedentary healthy middle aged | 13 | Males | ET | 2888 | 30 | 69 | 21 |
| Howarth et al. | 2004 | [79] | 41 | CON | Young healthy M | 8 | Males | ET | 2100 | N/A | 32 | 6 |
| Iaia et al. | 2009 | [50] | 42 | TR | Young healthy trained | 17 | Males | HIT | 68 | 55 | -5 | -2 |
| Irving et al. | 2011 | [80] | 43 | CON | T2DM offspring | 8 | Mixed | ET+HIT | 945 | 26 | 11 | 0 |
| 44 | CON | Healthy control | 8 | Mixed | ET+HIT | 945 | 27 | 23 | 0 | |||
| Jeppesen et al. | 2006 | [81] | 45 | DI | Patients with mtDNA mutations | 20 | Mixed | ET | 1500 | 26 | 66 | 27 |
| Jeppesen et al. | 2012 | [104] | 46 | CON | Healthy young sedentary | 8 | Males | ET | 1560 | 38 | 36 | 15 |
| 47 | CON | Healthy matched subjects | 11 | Mixed | ET | 1500 | 34 | 65 | 21 | |||
| Kohn et al. | 2011 | [10] | 48 | TR | Young well trained | 18 | Males | HIT | 194,4 | 67 | -4 | 3 |
| Lange et al. | 2000 | [82] | 49 | DI | Healthy elderly Women | 8 | Females | HIT | 2160 | 22 | 35 | 17 |
| LeBlanc et al. | 2004 | [107] | 50 | CON | Young healthy | 8 | Males | ET | 2400 | N/A | 40 | 15 |
| Linossier et al. | 1997 | [11] | 51 | CON | Healthy young recreationally active | 8 | Males | HIT | 1800 | 52 | 7 | 3 |
| Luden et al. | 2011 | [83] | 52 | CON | Active young | 6 | Mixed | ET | N/A | 50 | 66 | 9 |
| MacDougall et al. | 1998 | [84] | 53 | CON | Healthy young recreationally active | 9 | Males | HIT | 84 | 51 | 25 | 3 |
| Mandroukas et al. | 1984 | [105] | 54 | CON | Obese | 14 | Females | ET | 1800 | N/A | 27 | 19 |
| Martin III et al. | 1989 | [85] | 55 | CON | Healthy young sedentary | 6 | Males | ET+HIT | 2520 | 46 | 40 | 20 |
| Masuda et al. | 2001 | [86] | 56 | CON | Healthy young sedentary | 7 | Males | ET | 1680 | 45 | 28 | 16 |
| McKenzie et al. | 2000 | [45] | 57 | CON | Healthy young sedentary | 6 | Males | ET+HIT | 1500 | 46 | 34 | 12 |
| 58 | CON | Healthy young sedentary | 6 | Females | ET+HIT | 1500 | 38 | 27 | 18 | |||
| Messonier et al. | 2005 | [87] | 59 | CON | Untrained young | 8 | Mixed | ET | 2880 | 43 | 54 | 8 |
| Mogensen et al. | 2009 | [88] | 60 | DI | Type 2 diabetics | 12 | Males | ET | 625 | 27 | 58 | 11 |
| 61 | DI | Obese | 11 | Males | ET | 625 | 29 | 37 | 15 | |||
| Moore et al. | 1987 | [21] | 62 | CON | Healthy young sedentary | 4 | Mixed | ET | 2310 | 45 | 59 | 22 |
| 63 | CON | Trained healthy | 8 | Mixed | ET | 2310 | N/A | -13 | 1 | |||
| Murias et al. | 2011 | [53] | 64 | OLD | Active elderly | 7 | Males | ET | 1620 | 29 | 48 | 27 |
| 65 | CON | Active young | 7 | Males | ET | 1620 | 49 | 67 | 16 | |||
| Ngo et al. | 2012 | [23] | 66 | OLD | Healthy elderly | 5 | Males | HIT | 3360 | 38 | 43 | 9 |
| Perry et al. | 2008 | [81] | 67 | CON | Healthy young recreationally active | 8 | Mixed | HIT | 720 | 45 | 26 | 9 |
| Perry et al. | 2010 | [90] | 68 | CON | Healthy young recreationally active | 9 | Males | HIT | 420 | N/A | 28 | 12 |
| Putman et al. | 1998 | [91] | 69 | CON | Healthy young recreationally active | 7 | Males | ET | 840 | 45 | 5 | 3 |
| Randers et al. | 2010 | [60] | 70 | CON | Young healthy | 10 | Males | ET | 4992 | 40 | 18 | 8 |
| Rud et al. | 2012 | [92] | 71 | CON | Healthy young sedentary | 8 | Mixed | ET | 1960 | N/A | 14 | 6 |
| Schantz et al. | 1983 | [28] | 72 | TR | Trained | 6 | Males | ET | 15840 | 61 | 0 | 0 |
| Sjödin et al. | 1982 | 73 | CON | Healthy young sedentary | 8 | Males | ET | 280 | N/A | 11 | 2 | |
| Slivka et al. | 2013 | [93] | 74 | CON | Young trained | 10 | Males | ET | N/A | N/A | 11 | 2 |
| Stannard et al. | 2010 | [93] | 75 | CON | Young healthy untrained | 7 | Mixed | ET | 1000 | N/A | 18 | 5 |
| 76 | CON | Young healthy untrained | 7 | Mixed | ET | 1000 | N/A | 19 | 5 | |||
| Starritt et al. | 1999 | [95] | 77 | CON | Healthy young active but untrained | 7 | Mixed | ET | 600 | 44 | 26 | 9 |
| Svedenhag et al. | 1983 | [54] | 78 | CON | Healthy young sedentary | 8 | Males | ET | 1280 | 43 | 62 | 7 |
| Svedenhag et al. | 1983 | [96] | 79 | CON | Healthy young sedentary | 8 | Mixed | ET | 1280 | N/A | 75 | 7 |
| Talanian et al. | 2007 | [97] | 80 | CON | Recreational active | 8 | Females | HIT | 280 | 36 | 20 | 13 |
| Tarnopolsky et al. | 2007 | [44] | 81 | CON | Healthy young active but untrained | 5 | Males | ET | 2100 | 43 | 26 | 9 |
| 82 | CON | Healthy young active but untrained | 7 | Females | ET | 2100 | 37 | 3 | 13 | |||
| Tiidus et al. | 1996 | [52] | 83 | CON | Healthy young sedentary | 7 | Males | ET | 840 | 48 | 25 | 12 |
| 84 | CON | Healthy young sedentary | 6 | Females | ET | 840 | 37 | 50 | 22 | |||
| Tonkonogi et al. | 2000 | [98] | 85 | CON | Healthy young untrained | 8 | Mixed | ET | 960 | 39 | 47 | 24 |
| Trappe et al. | 2006 | [99] | 86 | CON | Recreational active | 7 | Mixed | ET | 5460 | 50 | 37 | 5 |
| Tynni-Lenné et al. | 1999 | [47] | 87 | DI | Patients with heart failure | 8 | Mixed | ET | 480 | 18 | 23 | 3 |
| 88 | DI | Patients with heart failure | 8 | Mixed | ET | 480 | 16 | 45 | 19 | |||
| Vogiatzis et al. | 2005 | [7] | 89 | DI | COPD patients | 10 | Mixed | HIT | 1350 | N/A | 43 | 9 |
| 90 | DI | COPD patients | 9 | Mixed | ET | 900 | N/A | 40 | 5 | |||
| Wibom et al. | 1992 | [100] | 91 | CON | Healthy young untrained | 9 | Males | ET | 864 | 44 | 43 | 10 |
| Yfanti et al. | 2010 | [101] | 92 | TR | Moderately trained | 10 | Males | ET+HIT | 5400 | 50 | 54 | 18 |
| 93 | TR | Moderately trained | 11 | Males | ET+HIT | 5400 | 51 | 50 | 22 | |||
| Zoll et al. | 2005 | [102] | 94 | TR | Young healthy trained | 9 | Males | ET | 2013 | 64 | 1 | 5 |
| 95 | TR | Young healthy trained | 6 | Males | ET | 2090 | 59 | -17 | 3 | |||
| Østergård et al. | 2005 | [106] | 96 | CON | Healthy untrained | 29 | Mixed | ET | 1350 | 38 | 25 | 14 |
| 97 | CON | Healthy untrained | 19 | Mixed | ET | 1350 | 41 | 25 | 15 | |||
All studies and intervention groups included from search. Group column describes categorization in Figure 5: CON; Young healthy sedentary subjects, DI; studies investigating training in patients with various diseases, TR; Endurance trained subjects at inclusion. Group characteristics column: The group as described by the authors. Training type column: ET; The subjects performed endurance training, HIIT; The subjects performed high-intense interval training. Inclusion O2max column: N/A; not reported clearly in the study. Baseline O2max: O2max reported before the intervention.
Lower CS activity has been reported in elderly compared to equally active young subjects [12]. This has also been observed in a cross-sectional study where CS activity was lower in both sedentary and active elderly subjects compared to young sedentary and active subjects matched for daily activity by the Baecke questionnaire [13] but with a lower O2max per kg fat free mass (FFM) in the elderly subjects [14].
CS activity have been shown to be lower in a group of obese, insulin resistant subjects compared to a group of obese insulin sensitive subjects matched for O2max per kg FFM, but in none of the groups an increase in CS activity was seen in response to 6 weeks aerobic endurance training despite increases in O2max per kg FFM [15]. Thus, the metabolic state of subject may challenge the relationship between training induced changes in CS activity and in O2max.
Analysis of CS in skeletal muscle requires relative small biopsy samples (approximately 15 mg w.w.) and the assay has a relatively low inter- and intra assay variation (below 5% in our laboratory), and the analysis can be done on frozen samples. However, methodological variations and differences in preparation of the biopsies between the different studies is a possible concern. CS activity is traditionally analyzed by the methods described by Lowry and Passonneau [16] or by Srere [17]. The latter is based on a reaction between the thiolgroup in acetyl-CoA which react with Ellman’s reagent (5, 5’-dithiobis-(2-nitrobenzoic acid (DTNB)), which is measured spectrophotometrically [17]. The method by Lowry and Passoneau is based on the conversion of malate to oxaloacetate by reduction of NAD+ to NADH, where the formation of NADH is linear to the CS activity [16]. In this method NADH may be measured both spectrophotometrically and fluorometrically. Different laboratories use these methods with various modifications, different reagents or temperatures (range: 25-37°C) resulting in possible differences in CS activity between laboratories. Furthermore, the analysis may either be done on untreated tissue (wet weight) or tissue that has been freeze-dried and dissected free of visible connective tissue, blood and adipose tissue (dry weight). Using dry weight ensures that the analysis is done primarily on muscle tissue, and not on adipose or connective tissue, which improves the validity of the result. In addition to the analytical considerations, the time from last exercise bout to the biopsy sampling is of importance. Tonkonogi and colleagues showed that CS activity is increased immediately after acute exercise (30 sec. after cessation of exercise) [18]. This finding was later confirmed in females, but surprisingly not in males [19], which is in contrast to another study including trained and untrained males [20].
In the present review we have collected and compared the previous studies in humans in which CS and O2max was measured before and after a training program with the purpose of characterizing the possible relationship between these two variables, and determine which factors that may influence this relationship. Such factors may include the training modality, age, gender, presence of metabolic or other diseases, initial fitness status, and methodological variations. Furthermore, the material allows for a direct comparison of absolute values of CS activity between the different studies with comparable study groups.
Methods
Data sources and search profile
A systematic search of literature on a bibliographical database PubMed published from 1983 to June 2013. We used the search profile: (citrate) AND synthase) AND human) AND skeletal) AND muscle) AND training) NOT electrical stimulation) NOT in-vitro) NOT rats.
Inclusion and exclusion
We included all available studies in which CS activity in skeletal muscle (vastus lateralis) was measured as a marker for improved skeletal muscle oxidative capacity. We limited the search to human studies that included measurements of whole body oxygen uptake (O2max) before and after a physical training intervention program. Studies were excluded if the subjects did not complete an incremental O2max test to exhaustion. Finally, cross-sectional studies and detraining studies were excluded (Table 1 and Figure 1).
Figure 1.
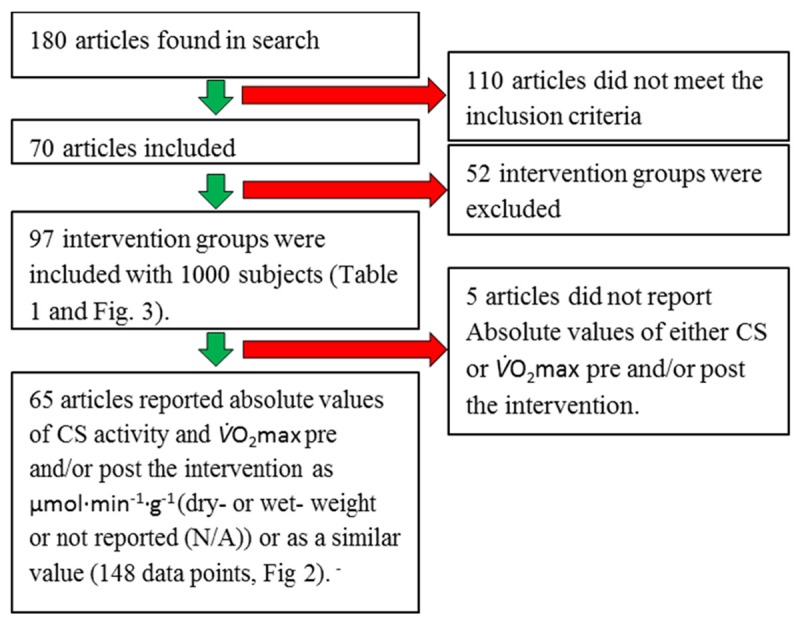
Flow chart. Flow chart of literature search and inclusion/exclusion process for Figures 2 and 3.
Data extraction
Two authors screened the retrieved articles and relevant studies were independently assessed. One author used a standardized form to extract data; a second author controlled the data for accuracy. Discrepancies were resolved by consensus or third-party adjudication. We constructed tables displaying: First authors, publication year, group characteristics, gender, number of subjects, O2max at inclusion, delta CS activity and delta O2max.
The subjects were characterized as described in the study and the groups were primarily stratified according to men/females, young/elderly, trained/sedentary, healthy/disease (Table 1). If not defined in the article we defined elderly as age above 60 years and trained as a O2max above 55 and 50 ml O2 min-1·kg-1 for men and women, respectively.
We wanted to study the isolated effect of HIIT and ET, therefore we excluded studies where detraining and resistance training was used [21-24], where spinal cord injuries were studied [25], electrical stimulation was used as stimulation [26], and studies where other muscles (deltoid or triceps brachii) were biopsied and analyzed [23,27,28].
Furthermore, we excluded a study if the main estimate for changes in aerobic capacity were Wattmax [29-32], a time trial [33-35] or time to exhaustion [36]. This was done to allow a comparison of the relative improvement in O2max by using the same units for endurance performance.
Some studies only reported pre values of citrate synthase activity and/or O2max and hence it was not possible to calculate a relative change [37-41]. Furthermore, 5 studies reported values of CS activity that were more than a factor 103 different from other studies, when the unit for CS activity was recalculated to the unit used in the present review, μmol·min-1.g-1. We assumed in those cases that the reported unit in the original article was erroneous, but accepted the reported value and included the data in Figure 2 [6,42-45]. 5 studies only reported relative changes, and no absolute values of either CS or O2max pre and/or post the intervention, and these studies were not included in Figure 2. Two studies [46,47] reported the same results from the same study and Gordon et al. was excluded.
Figure 2.
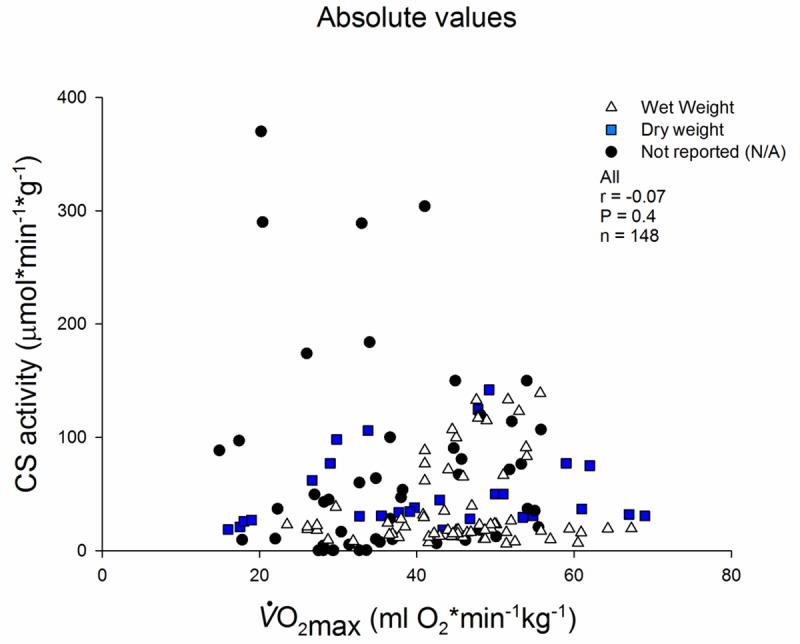
Absolute O2max and CS activity before and after interventions. 65 studies (n = 148 data points). The data points are divided by the sample preparation before analysis: wet (no preparation), dry (samples were freeze dried and dissected free of visible blood, fat and connective tissue) of not report (N/A, if the publication did not state clearly how the samples were prepared).
Various terms describing a HIIT training program is used in the included publications (i.e. High Intense Training (HIT), High Intense Interval Training (HIIT), High Intensity Intermittent Exercise (HIIE), and Sprint Training (SIT)). For the purpose of the present review, all of these are termed High Intense Interval Training (HIIT).
Statistics
All statistical analyses were performed in Sigma Plot 12.5 (Systat software, Inc., San Jose, USA). The level of significance was set at P < 0.05. For correlations between different variables Pearson’s product moment correlation coefficient (r) and corresponding P-value were obtained.
Results
Inclusion and exclusion
The literature search identified 180 articles. 110 articles did not meet the inclusion criteria and were excluded. In the remaining 70 articles 149 intervention groups were identified. But 52 intervention groups did not meet the inclusion criteria and were excluded. The main reasons for exclusion were: the groups performed strength training, studied other muscle groups or were control groups. A total of 97 intervention groups including 1000 subjects were included in this review (Table 1 and Figure 1).
Absolute CS activity values
There was no relationship between absolute measures of CS and O2max when we included all time points (n = 148) from studies (n = 65) that reported both CS activity as μmol· min-1·g (wet or dry weight)-1 and O2max kg-1 (r = - 0.07, P = 0.4, Figure 2). 12 studies including 28 study groups reported CS activity relative to dry weight (freeze dried and dissected free of visible connective tissue, lipids and blood). CS activity normalized to dry weight as an isolated factor did not correlate to O2max (r = 0.11, P = 0.60). Neither did the 33 studies with 68 groups that normalized CS activity to wet weight correlate to O2max when analysed alone (r = 0.18, P = 0.17). 20 studies (52 groups) did not report (N/A) clearly how the biopsies were treated prior to analysis, here there was no correlation between CS activity and O2max (r = - 0.14, P = 0.33, Figure 2).
Relative CS activity values
The relative changes in O2max and CS activity in response to a training intervention in 97 intervention groups (Table 1 and Figure 3) were significantly correlated (r = 0.45, P < 0.001). The equation for the trend line is: ΔCS = 1.1 ΔO2max + 16.8. The significant correlation was present also when all the included study groups were stratified according to training type (Figure 4 and Table 1): ET (r = 0.42, n = 69, P < 0.001), and combined ET and HIIT (r = 0.81, n = 7, P < 0.05), but not with HIIT alone (r = 0.24, n = 21, P = 0.29). Stratification according to inclusion background (Figure 5 and Table 1) showed significant correlations in young sedentary subjects (r = 0.35, n = 63, P < 0.05), endurance trained subjects (r = 0.79, n = 9, P < 0.05), and in patients with various diseases and complications (r = 0.67, n = 14, P < 0.05), but not in elderly subjects (r = 0.20, n = 10, P = 0.57). By stratification according to gender (Figure 6 and Table 1) only males correlated (r = 0.63, n = 52, P < 0.001). In studies using females alone (r = 0.57, n = 10, P = 0.08) or groups of mixed gender (r = 0.31, n = 35, P = 0.07), there was only a tendency towards a correlation.
Figure 3.
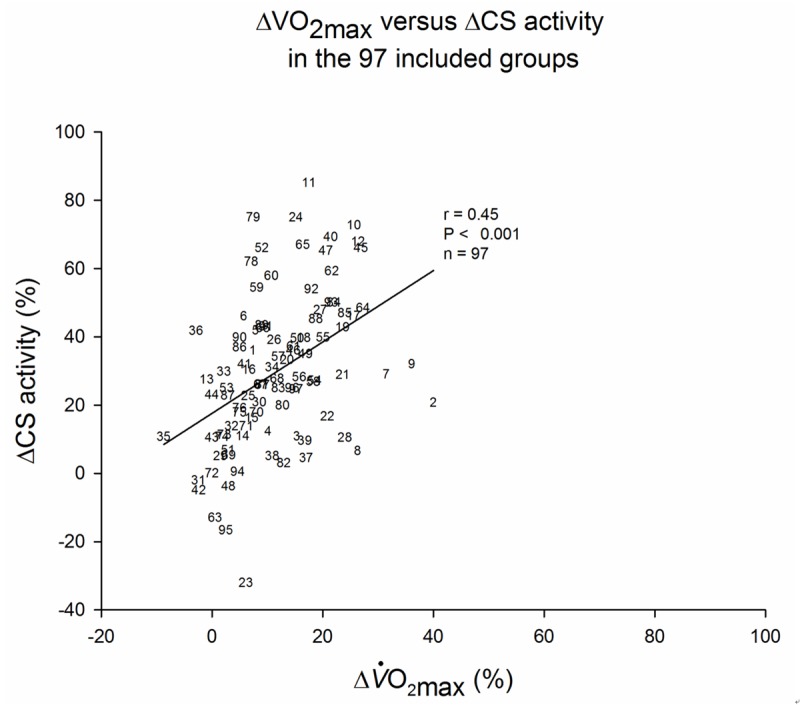
Relative changes in O2max and CS activity. The relative O2max and CS increase pre and post a training intervention in the 98 included groups. Number refers to the group number in Table 1.
Figure 4.

Type of training. All included groups from search expressed as the relative aerobic improvement and relative CS increase pre and post a training intervention divided by type of training used in the intervention: Endurance training, High-intensity interval training or a combination of Endurance training (ET) and High-intensity interval training (HIIT). The training type is divided by the description by the authors.
Figure 5.

Subject background. All included groups from search expressed as the relative aerobic improvement and relative CS increase pre and post a training intervention divided the subject background included in the study: Young sedentary subjects, patients with various diseases, see Table 1, Obese subjects, Elderly subjects or endurance trained subjects. The characteristics are listed as described by the authors and can be seen in Table 1.
Figure 6.

Gender. All included groups from search expressed as the relative aerobic improvement and relative CS increase pre and post a training intervention divided by the gender included in the study.
Discussion
There is a clear positive and significant correlation between the relative change in O2max and in CS activity in response to physical training (Figure 3). There was almost a 1:1 relationship between the relative change in CS activity and change in O2max. Thus, a ≈ 9% increase in CS activity may be expected from a 10% increase in O2max. It is noteworthy that this relationship was not present when the correlation analysis was constrained to HIIT training or in elderly subjects alone. Oppositely, the relationship was intact when considering young sedentary subjects, trained subjects, and males alone. Likewise, both endurance training studies and studies combining HIIT and endurance training displayed a significant correlation between changes in O2max and CS activity. Absolute values of O2max and CS activity did not correlate, indicating that absolute measures of CS activity cannot be compared across studies and hence not be used for characterization of subject groups between different studies.
Training type (ET and HIIT)
One purpose of this review was to collect and analyze previously published studies in order to determine magnitudes and interrelationships in changes of O2max and CS in response to ET and HIIT. We found a positive and significant correlation between improvements in O2max and increases in CS activity in response to endurance training. This finding was not unexpected, but in contrast to this is, the lack of relationship between improvement in O2max and CS activity in response to HIIT was unexpected. The two forms of training elicited similar average improvements in O2max (ET: ≈ 13% and HIIT: ≈ 8%) but ET (≈ 33%) lead to higher improvement in CS activity compared to HIIT (≈ 19%). This underlines the major importance of cardiac performance for maximal oxygen uptake. Since CS activity in skeletal muscle is well correlated with mitochondrial volume in skeletal muscle [2,3], the lower increase in CS activity with HIIT also indicate that mitochondrial biogenesis may not be stimulated at the same level as ET. In the studies where HIIT did not lead to an increase in CS activity, a significant increase in O2max was found in two [8,9] of these five studies [7,10,11]. The differences in the CS response may be due a large variation in total training time ranging from 45 min [48] to 3360 min [23] and intensity ranging from 75-95% HRmax [23] to 150 % ΔO2max [49] in the included HIIT studies. Another factor is that it is inherent in the nature of HIIT that the time spent training is less than that with endurance training (ET: ≈ 53 hr/study vs. HIIT: ≈ 12 hr/study in the included studies). The high intensity exercise for a short period may apparently be sufficient to elicit a cardiac adaptation (primarily an increase in maximal cardiac output), but not an adaptation of an important enzyme in the Krebs cycle in skeletal muscle.
On the other hand, the lack of significant relationship between ΔCS activity and ΔO2max in the collective HIIT studies may also be due to three distinct studies (no 8, 9, and 23 in Table 1; the 3 triangles in Figure 4 located most low-right) where disproportionate responses were seen. With exclusion of these three studies, a significant correlation is seen (r = 0.48, n = 18, P < 0.05).
Some HIIT studies have been used to induce improvements in endurance performance in already highly trained athletes, measured as time to exhaustion or time trial [10,50]. But these athletes did not have further increases in O2max or CS activity. It is possible that these athletes had already reached a plateau in the metabolic adaptations from the prior ET.
From the data it appears that a 8 wk. HIIT protocol with 3 training sessions per week each consisting of two to six 30 second sprint intervals was a highly time-efficient study [51]. This resulted in a 42% increase in CS activity with a total of 54 min. effective training [51]. Similar improvements in response to HIIT were shown in elderly subjects but after a longer HIIT training period [7]. The largest relative improvement (50-75%) in CS activity was seen in studies with endurance training [5,21,52-54]. These studies are all characterized by a high volume of total training and inclusion of subjects with a relatively low initial whole body O2max. Even though it is highly speculative, it is possible that the nature of HIIT interventions is too short or extreme to allow mitochondrial biogenesis.
Ageing
The expected relationship between in improvements in O2max and CS activity was not observed in the studies (n = 10) with elderly subjects (Figure 5). A 20 % decline in CS activity has been reported with age independent of lifestyle in some studies [14,55], while others are inconclusive [56]. In contrast, other mitochondrial oxidative enzyme activities, for example the activity of complex I-IV are unaltered [14,57]. Therefore, it is possible that adaptability in CS activity is altered with aging independently of changes in mitochondrial respiratory capacity, which has also been shown experimentally [57,58].
A recent study by Duscha and colleagues reports a discrepancy between the relative improvement in CS activity and O2max in 3 groups (40-65 years) that performed different amount and intensity (low amount moderate-intensity, low amount-high intensity or high amount-high intensity training) of aerobic training (group # 25-27, Table 1). Only in the group that performed high amount-high intensity training (r = 0.304, n = 41) a positive correlation between relative O2max and CS activity was seen (group # 27, Table 1) [43,58]. Thus, these findings indicate that in middle-aged and elderly a high amount-high intensity training program is necessary for improvement in both CS and ΔO2max.
Gender
We observed that only studies that included males alone showed significant correlation between O2max and CS activity. In studies (n = 10) including women alone the relationship was only nearly significant (P = 0.08), which is probably due to lack of statistical power. Is has been suggested [19] that transcriptional, translational, and/or post-translational regulation of CS is different between females and males at rest and immediately after acute exercise. However, this notion is not based on sound physiological considerations, and it remains to be proven.
Methodological differences: dry or wet weight?
There was no correlation between absolute values of O2max and CS activity in the included studies. The freeze-drying and dissection procedure of the muscle samples should have eliminated some variation due to contamination with non-muscle tissue/cells, but even in these samples, there was no correlation between the absolute values of O2max and CS. Although the measurements and analytical variation of O2max is well standardized across different laboratories, some day-to-day variation must be expected. Less standardized is the biochemical analysis CS activity. This analysis requires relatively small muscle biopsies, approximately 2-3 mg d.w. corresponding to 10-15 mg w.w. In the authors laboratory CS activity is measured spectrophotometrically as described by Srere [17] at 37°C. The assay has a low inter- and intra assay variation. We find an inter-assay variation of 4.2% in the low range (27 ± 1 (mean ± SD) μmol·min-1·g (d.w.)-1) and 0.8% in the high range (613 ± 5 μmol·min-1·g (d.w.)-1) and an intra-assay variation of 2.5% in the low range (28 ± 1 μmol·min-1·g (d.w.)-1) and 4.8% in the high range (589 ± 5 μmol·min-1·g protein (d.w.)-1) (unpublished data). These are lower than was has been reported for analyses in non-freeze dried and un-dissected tissue (4.9% [34], 5.4% [49] and 7.7% [6] in the low range of CS activity). This speaks for analyzing on dissected tissue. Another major factor for variation in absolute values of CS activity is the analytical temperature (usually 25-37°C), which is, unfortunately, not always reported. Increased activity with 37°C compared to 25°C must be expected. Finally, it would be possible to correct data for blood contamination with e.g. creatine correction or other methods, but this is very seldom reported.
Five studies recruited a non-training control group [43,50,59-61]. In these groups no statistical change in ΔO2max or ΔCS activity were reported. However, the ΔCS activity reported varies from 10% decrease (NS) [60] to 14% increase (NS) [61]. This indicates that some physiological time related variation should be expected when measuring.
Responders and non-responders
Despite a positive correlation between ΔO2max and ΔCS activity there is a considerable variation in the relationship (Figure 3). We have suggested that training regimes, subject background or methodological variation contributes to this. However, it has to be considered that there is a significant inter-subject variation in training induced adaptations in O2max, which increases the variation [62,63]. The molecular mechanisms underlying the variation in response to exercise training are still poorly understood, but it is possible that also adaptations in CS activity may be individual. A close inspection of Table 1 and Figure 3 reveals that group 23, 31, 42, 48, 63, and 95 reported a negative ΔCS activity.
Limitations
CS activity and O2max are not always reported both pre and post training. This excluded a large number of studies, and thus removes valuable information. Furthermore, we decided to remove measures of aerobic capacity that was not O2max, but measured as e.g. time trial or Wattmax. There is a large variation in how these tests are conducted, which increases the variation in the results between studies. Cross-sectional studies were not taken into consideration. Inclusion of the many cross-sectional studies in the literature may have provided additional information on the absolute values of CS activity across various studies (Figure 2). Finally, the lack of relationship in females and elderly subjects may be due to a low number of included studies studying these groups, which then may have provided a false negative result.
Conclusions
Most factors (young sedentary or trained subjects, males, ET and combined ET and HIIT) showed a positive and significant linear relationship between ΔO2max and ΔCS activity. This was not the case in publications studying HIIT, females and elderly subjects. CS activity as a marker of mitochondrial density should be used with care in studies using very short term HIIT. The lack of relationship in the females and maybe also in the elderly is most likely a statistical power problem. Finally, a large methodological variation in the analysis of CS activity between laboratories is probably the major reason for a lack of significant relationship in absolute values in O2max and CS activity.
Acknowledgements
Regitze Kraunsøe and Katrine Qvist for technical assistance. The financial support from The Nordea Foundation, The Novo Nordisk Foundation, Kathrine and Vigo Skovgaards Foundation and Aase and Ejnar Danielsens Foundation. This work is carried out as a part of the research program of the UNIK: Food, Fitness & Pharma for Health and Disease. The Danish Ministry of Science, Technology and Innovation supports the UNIK project.
Disclosure of conflict of interest
The authors declare that they have no conflict of interest.
References
- 1.Andersen P, Saltin B. Maximal perfusion of skeletal muscle in man. J Physiol. 1985;366:233–249. doi: 10.1113/jphysiol.1985.sp015794. [DOI] [PMC free article] [PubMed] [Google Scholar]
- 2.Larsen S, Nielsen J, Hansen CN, Nielsen LB, Wibrand F, Stride N, Schroder HD, Boushel R, Helge JW, Dela F, Hey-Mogensen M. Biomarkers of mitochondrial content in skeletal muscle of healthy young human subjects. J Physiol. 2012;590:3349–3360. doi: 10.1113/jphysiol.2012.230185. [DOI] [PMC free article] [PubMed] [Google Scholar]
- 3.Blomstrand E, Radegran G, Saltin B. Maximum rate of oxygen uptake by human skeletal muscle in relation to maximal activities of enzymes in the Krebs cycle. J Physiol. 1997;501:455–460. doi: 10.1111/j.1469-7793.1997.455bn.x. [DOI] [PMC free article] [PubMed] [Google Scholar]
- 4.Bylund AC, Bjuro T, Cederblad G, Holm J, Lundholm K, Sjostroom M, Angquist KA, Schersten T. Physical training in man. Skeletal muscle metabolism in relation to muscle morphology and running ability. Eur J Appl Physiol Occup Physiol. 1977;36:151–169. doi: 10.1007/BF00421747. [DOI] [PubMed] [Google Scholar]
- 5.Bruce CR, Kriketos AD, Cooney GJ, Hawley JA. Disassociation of muscle triglyceride content and insulin sensitivity after exercise training in patients with Type 2 diabetes. Diabetologia. 2004;47:23–30. doi: 10.1007/s00125-003-1265-7. [DOI] [PubMed] [Google Scholar]
- 6.Carter SL, Rennie CD, Hamilton SJ, Tarnopolsky Changes in skeletal muscle in males and females following endurance training. Can J Physiol Pharmacol. 2001;79:386–392. [PubMed] [Google Scholar]
- 7.Vogiatzis I, Terzis G, Nanas S, Stratakos G, Simoes DC, Georgiadou O, Zakynthinos S, Roussos C. Skeletal muscle adaptations to interval training in patients with advanced COPD. Chest. 2005;128:3838–3845. doi: 10.1378/chest.128.6.3838. [DOI] [PubMed] [Google Scholar]
- 8.Gorostiaga EM, Walter CB, Foster C, Hickson RC. Uniqueness of interval and continuous training at the same maintained exercise intensity. Eur J Appl Physiol Occup Physiol. 1991;63:101–107. doi: 10.1007/BF00235177. [DOI] [PubMed] [Google Scholar]
- 9.Dawson B, Fitzsimons M, Green S, Goodman C, Carey M, Cole K. Changes in performance, muscle metabolites, enzymes and fibre types after short sprint training. Eur J Appl Physiol Occup Physiol. 1998;78:163–169. doi: 10.1007/s004210050402. [DOI] [PubMed] [Google Scholar]
- 10.Kohn TA, Essen-Gustavsson B, Myburgh KH. Specific muscle adaptations in type II fibers after high-intensity interval training of well-trained runners. Scand J Med Sci Sports. 2011;21:765–772. doi: 10.1111/j.1600-0838.2010.01136.x. [DOI] [PubMed] [Google Scholar]
- 11.Linossier MT, Dormois D, Perier C, Frey J, Geyssant A, Denis C. Enzyme adaptations of human skeletal muscle during bicycle short-sprint training and detraining. Acta Physiol Scand. 1997;161:439–445. doi: 10.1046/j.1365-201X.1997.00244.x. [DOI] [PubMed] [Google Scholar]
- 12.Crane JD, Devries MC, Safdar A, Hamadeh MJ, Tarnopolsky MA. The effect of aging on human skeletal muscle mitochondrial and intramyocellular lipid ultrastructure. J Gerontol A Biol Sci Med Sci. 2010;65:119–128. doi: 10.1093/gerona/glp179. [DOI] [PubMed] [Google Scholar]
- 13.Baecke JA, Burema J, Frijters JE. A short questionnaire for the measurement of habitual physical activity in epidemiological studies. Am J Clin Nutr. 1982;36:936–942. doi: 10.1093/ajcn/36.5.936. [DOI] [PubMed] [Google Scholar]
- 14.Rimbert V, Boirie Y, Bedu M, Hocquette JF, Ritz P, Morio B. Muscle fat oxidative capacity is not impaired by age but by physical inactivity: association with insulin sensitivity. FASEB J. 2004;18:737–739. doi: 10.1096/fj.03-1104fje. [DOI] [PubMed] [Google Scholar]
- 15.Heilbronn LK, Gan SK, Turner N, Campbell LV, Chisholm DJ. Markers of mitochondrial biogenesis and metabolism are lower in overweight and obese insulin-resistant subjects. J Clin Endocrinol Metab. 2007;92:1467–1473. doi: 10.1210/jc.2006-2210. [DOI] [PubMed] [Google Scholar]
- 16.Lowry OH, Passonneau JV. A Flexible System of Enzymatic Analysis. 1972:1–291. [Google Scholar]
- 17.Srere P. Reactions on the cycle: citrate synthase. Biochemistry. 1969:3–5. [Google Scholar]
- 18.Tonkonogi M, Harris B, Sahlin K. Increased activity of citrate synthase in human skeletal muscle after a single bout of prolonged exercise. Acta Physiol Scand. 1997;161:435–436. doi: 10.1046/j.1365-201X.1997.00233.x. [DOI] [PubMed] [Google Scholar]
- 19.Roepstorff C, Schjerling P, Vistisen B, Madsen M, Steffensen CH, Rider MH, Kiens B. Regulation of oxidative enzyme activity and eukaryotic elongation factor 2 in human skeletal muscle: influence of gender and exercise. Acta Physiol Scand. 2005;184:215–224. doi: 10.1111/j.1365-201X.2005.01442.x. [DOI] [PubMed] [Google Scholar]
- 20.Leek BT, Mudaliar SR, Henry R, Mathieu-Costello O, Richardson RS. Effect of acute exercise on citrate synthase activity in untrained and trained human skeletal muscle. Am J Physiol Regul Integr Comp Physiol. 2001;280:R441–R447. doi: 10.1152/ajpregu.2001.280.2.R441. [DOI] [PubMed] [Google Scholar]
- 21.Moore RL, Thacker EM, Kelley GA, Musch TI, Sinoway LI, Foster VL, Dickinson AL. Effect of training/detraining on submaximal exercise responses in humans. J Appl Physiol. 1987;63:1719–1724. doi: 10.1152/jappl.1987.63.5.1719. [DOI] [PubMed] [Google Scholar]
- 22.Coyle EF, Martin WH III, Sinacore DR, Joyner MJ, Hagberg JM, Holloszy JO. Time course of loss of adaptations after stopping prolonged intense endurance training. J Appl Physiol Respir Environ Exerc Physiol. 1984;57:1857–1864. doi: 10.1152/jappl.1984.57.6.1857. [DOI] [PubMed] [Google Scholar]
- 23.Ngo KT, Denis C, Saafi MA, Feasson L, Verney J. Endurance but not resistance training increases intra-myocellular lipid content and beta-hydroxyacyl coenzyme A dehydrogenase activity in active elderly men. Acta Physiol (Oxf) 2012;205:133–144. doi: 10.1111/j.1748-1716.2011.02379.x. [DOI] [PubMed] [Google Scholar]
- 24.Tang JE, Hartman JW, Phillips SM. Increased muscle oxidative potential following resistance training induced fibre hypertrophy in young men. Appl Physiol Nutr Metab. 2006;31:495–501. doi: 10.1139/h06-026. [DOI] [PubMed] [Google Scholar]
- 25.Crameri RM, Weston A, Climstein M, Davis GM, Sutton JR. Effects of electrical stimulation-induced leg training on skeletal muscle adaptability in spinal cord injury. Scand J Med Sci Sports. 2002;12:316–322. doi: 10.1034/j.1600-0838.2002.20106.x. [DOI] [PubMed] [Google Scholar]
- 26.Kim CK, Takala TE, Seger J, Karpakka J. Training effects of electrically induced dynamic contractions in human quadriceps muscle. Aviat Space Environ Med. 1995;66:251–255. [PubMed] [Google Scholar]
- 27.Costill DL, Flynn MG, Kirwan JP, Houmard JA, Mitchell JB, Thomas R, Park SH. Effects of repeated days of intensified training on muscle glycogen and swimming performance. Med Sci Sports Exerc. 1988;20:249–254. doi: 10.1249/00005768-198806000-00006. [DOI] [PubMed] [Google Scholar]
- 28.Schantz P, Henriksson J, Jansson E. Adaptation of human skeletal muscle to endurance training of long duration. Clin Physiol. 1983;3:141–151. doi: 10.1111/j.1475-097x.1983.tb00685.x. [DOI] [PubMed] [Google Scholar]
- 29.Helge JW. Adaptation to a fat-rich diet: effects on endurance performance in humans. Sports Med. 2000;30:347–357. doi: 10.2165/00007256-200030050-00003. [DOI] [PubMed] [Google Scholar]
- 30.Akerstrom TC, Fischer CP, Plomgaard P, Thomsen C, van HG, Pedersen BK. Glucose ingestion during endurance training does not alter adaptation. J Appl Physiol. 2009;106:1771–1779. doi: 10.1152/japplphysiol.91534.2008. [DOI] [PubMed] [Google Scholar]
- 31.Little JP, Safdar A, Wilkin GP, Tarnopolsky MA, Gibala MJ. A practical model of low-volume high-intensity interval training induces mitochondrial biogenesis in human skeletal muscle: potential mechanisms. J Physiol. 2010;588:1011–1022. doi: 10.1113/jphysiol.2009.181743. [DOI] [PMC free article] [PubMed] [Google Scholar]
- 32.Parra J, Cadefau JA, Rodas G, Amigo N, Cusso R. The distribution of rest periods affects performance and adaptations of energy metabolism induced by high-intensity training in human muscle. Acta Physiol Scand. 2000;169:157–165. doi: 10.1046/j.1365-201x.2000.00730.x. [DOI] [PubMed] [Google Scholar]
- 33.Terzis G, Stattin B, Holmberg HC. Upper body training and the triceps brachii muscle of elite cross country skiers. Scand J Med Sci Sports. 2006;16:121–126. doi: 10.1111/j.1600-0838.2005.00463.x. [DOI] [PubMed] [Google Scholar]
- 34.Burgomaster KA, Hughes SC, Heigenhauser GJ, Bradwell SN, Gibala MJ. Six sessions of sprint interval training increases muscle oxidative potential and cycle endurance capacity in humans. J Appl Physiol. 2005;98:1985–1990. doi: 10.1152/japplphysiol.01095.2004. [DOI] [PubMed] [Google Scholar]
- 35.Gurd BJ, Yoshida Y, McFarlan JT, Holloway GP, Moyes CD, Heigenhauser GJ, Spriet L, Bonen A. Nuclear SIRT1 activity, but not protein content, regulates mitochondrial biogenesis in rat and human skeletal muscle. Am J Physiol Regul Integr Comp Physiol. 2011;301:R67–R75. doi: 10.1152/ajpregu.00417.2010. [DOI] [PubMed] [Google Scholar]
- 36.Pilegaard H, Saltin B, Neufer PD. Exercise induces transient transcriptional activation of the PGC-1alpha gene in human skeletal muscle. J Physiol. 2003;546:851–858. doi: 10.1113/jphysiol.2002.034850. [DOI] [PMC free article] [PubMed] [Google Scholar]
- 37.Kraniou GN, Cameron-Smith D, Hargreaves M. Effect of short-term training on GLUT-4 mRNA and protein expression in human skeletal muscle. Exp Physiol. 2004;89:559–563. doi: 10.1113/expphysiol.2004.027409. [DOI] [PubMed] [Google Scholar]
- 38.Horowitz JF, Leone TC, Feng W, Kelly DP, Klein S. Effect of endurance training on lipid metabolism in women: a potential role for PPARalpha in the metabolic response to training. Am J Physiol Endocrinol Metab. 2000;279:E348–E355. doi: 10.1152/ajpendo.2000.279.2.E348. [DOI] [PubMed] [Google Scholar]
- 39.Helge JW, Overgaard K, Damsgaard R, Sorensen K, Andersen JL, Dyrskog SE, Hermansen K, Saltin B, Wojtaszewski JF. Repeated prolonged whole-body low-intensity exercise: effects on insulin sensitivity and limb muscle adaptations. Metabolism. 2006;55:217–223. doi: 10.1016/j.metabol.2005.08.015. [DOI] [PubMed] [Google Scholar]
- 40.Little JP, Safdar A, Wilkin GP, Tarnopolsky MA, Gibala MJ. A practical model of low-volume high-intensity interval training induces mitochondrial biogenesis in human skeletal muscle: potential mechanisms. J Physiol. 2010;588:1011–1022. doi: 10.1113/jphysiol.2009.181743. [DOI] [PMC free article] [PubMed] [Google Scholar]
- 41.Daugaard JR, Nielsen JN, Kristiansen S, Andersen JL, Hargreaves M, Richter EA. Fiber type-specific expression of GLUT4 in human skeletal muscle: influence of exercise training. Diabetes. 2000;49:1092–1095. doi: 10.2337/diabetes.49.7.1092. [DOI] [PubMed] [Google Scholar]
- 42.Ferketich AK, Kirby TE, Alway SE. Cardiovascular and muscular adaptations to combined endurance and strength training in elderly women. Acta Physiol Scand. 1998;164:259–267. doi: 10.1046/j.1365-201X.1998.00428.x. [DOI] [PubMed] [Google Scholar]
- 43.Duscha BD, Annex BH, Johnson JL, Huffman K, Houmard J, Kraus WE. Exercise dose response in muscle. Int J Sports Med. 2012;33:218–223. doi: 10.1055/s-0031-1291323. [DOI] [PMC free article] [PubMed] [Google Scholar]
- 44.Tarnopolsky MA, Rennie C, Robertshaw HA, Fedak-Tarnopolsky SN, Devries MC, Hamadeh MJ. Influence of endurance exercise training and sex on intramyocellular lipid and mitochondrial ultrastructure, substrate use, and mitochondrial enzyme activity. Am J Physiol Regul Integr Comp Physiol. 2007;292:R1271–R1278. doi: 10.1152/ajpregu.00472.2006. [DOI] [PubMed] [Google Scholar]
- 45.McKenzie S, Phillips SM, Carter SL, Lowther S, Gibala MJ, Tarnopolsky MA. Endurance exercise training attenuates leucine oxidation and BCOAD activation during exercise in humans. Am J Physiol Endocrinol Metab. 2000;278:E580–E587. doi: 10.1152/ajpendo.2000.278.4.E580. [DOI] [PubMed] [Google Scholar]
- 46.Gordon A, Tyni-Lenne R, Jansson E, Jensen-Urstad M, Kaijser L. Beneficial effects of exercise training in heart failure patients with low cardiac output response to exercise - a comparison of two training models. J Intern Med. 1999;246:175–182. doi: 10.1046/j.1365-2796.1999.00555.x. [DOI] [PubMed] [Google Scholar]
- 47.Tyni-Lenne R, Gordon A, Jensen-Urstad M, Dencker K, Jansson E, Sylven C. Aerobic training involving a minor muscle mass shows greater efficiency than training involving a major muscle mass in chronic heart failure patients. J Card Fail. 1999;5:300–307. doi: 10.1016/s1071-9164(99)91334-9. [DOI] [PubMed] [Google Scholar]
- 48.Burgomaster KA, Howarth KR, Phillips SM, Rakobowchuk M, MacDonald MJ, McGee SL, Gibala MJ. Similar metabolic adaptations during exercise after low volume sprint interval and traditional endurance training in humans. J Physiol. 2008;586:151–160. doi: 10.1113/jphysiol.2007.142109. [DOI] [PMC free article] [PubMed] [Google Scholar]
- 49.Blomstrand E, Krustrup P, Sondergaard H, Radegran G, Calbet JA, Saltin B. Exercise training induces similar elevations in the activity of oxoglutarate dehydrogenase and peak oxygen uptake in the human quadriceps muscle. Pflugers Arch. 2011;462:257–265. doi: 10.1007/s00424-011-0978-6. [DOI] [PubMed] [Google Scholar]
- 50.Iaia FM, Hellsten Y, Nielsen JJ, Fernstrom M, Sahlin K, Bangsbo J. Four weeks of speed endurance training reduces energy expenditure during exercise and maintains muscle oxidative capacity despite a reduction in training volume. J Appl Physiol. 2009;106:73–80. doi: 10.1152/japplphysiol.90676.2008. [DOI] [PubMed] [Google Scholar]
- 51.Barnett C, Carey M, Proietto J, Cerin E, Febbraio MA, Jenkins D. Muscle metabolism during sprint exercise in man: influence of sprint training. J Sci Med Sport. 2004;7:314–322. doi: 10.1016/s1440-2440(04)80026-4. [DOI] [PubMed] [Google Scholar]
- 52.Tiidus PM, Pushkarenko J, Houston ME. Lack of antioxidant adaptation to short-term aerobic training in human muscle. Am J Physiol. 1996;271:R832–R836. doi: 10.1152/ajpregu.1996.271.4.R832. [DOI] [PubMed] [Google Scholar]
- 53.Murias JM, Kowalchuk JM, Ritchie D, Hepple RT, Doherty TJ, Paterson DH. Adaptations in capillarization and citrate synthase activity in response to endurance training in older and young men. J Gerontol A Biol Sci Med Sci. 2011;66:957–964. doi: 10.1093/gerona/glr096. [DOI] [PubMed] [Google Scholar]
- 54.Svedenhag J, Lithell H, Juhlin-Dannfelt A, Henriksson J. Increase in skeletal muscle lipoprotein lipase following endurance training in man. Atherosclerosis. 1983;49:203–207. doi: 10.1016/0021-9150(83)90198-3. [DOI] [PubMed] [Google Scholar]
- 55.Coggan AR, Abduljalil AM, Swanson SC, Earle MS, Farris JW, Mendenhall LA, Robitaille PM. Muscle metabolism during exercise in young and older untrained and endurance-trained men. J Appl Physiol. 1993;75:2125–2133. doi: 10.1152/jappl.1993.75.5.2125. [DOI] [PubMed] [Google Scholar]
- 56.Brierley EJ, Johnson MA, James OF, Turnbull DM. Effects of physical activity and age on mitochondrial function. QJM. 1996;89:251–258. doi: 10.1093/qjmed/89.4.251. [DOI] [PubMed] [Google Scholar]
- 57.Barrientos A, Casademont J, Rotig A, Miro O, Urbano-Marquez A, Rustin P, Cardellach F. Absence of relationship between the level of electron transport chain activities and aging in human skeletal muscle. Biochem Biophys Res Commun. 1996;229:536–539. doi: 10.1006/bbrc.1996.1839. [DOI] [PubMed] [Google Scholar]
- 58.Brierley EJ, Johnson MA, James OF, Turnbull DM. Mitochondrial involvement in the ageing process. Facts and controversies. Mol Cell Biochem. 1997;174:325–328. [PubMed] [Google Scholar]
- 59.Hiatt WR, Regensteiner JG, Wolfel EE, Carry MR, Brass EP. Effect of exercise training on skeletal muscle histology and metabolism in peripheral arterial disease. J Appl Physiol. 1996;81:780–788. doi: 10.1152/jappl.1996.81.2.780. [DOI] [PubMed] [Google Scholar]
- 60.Randers MB, Nielsen JJ, Krustrup BR, Sundstrup E, Jakobsen MD, Nybo L, Dvorak J, Bangsbo J, Krustrup P. Positive performance and health effects of a football training program over 12 weeks can be maintained over a 1-year period with reduced training frequency. Scand J Med Sci Sports. 2010;20(Suppl 1):80–89. doi: 10.1111/j.1600-0838.2010.01091.x. [DOI] [PubMed] [Google Scholar]
- 61.Houmard JA, Shinebarger MH, Dolan PL, Leggett-Frazier N, Bruner RK, McCammon MR, Israel RG, Dohm GL. Exercise training increases GLUT-4 protein concentration in previously sedentary middle-aged men. Am J Physiol. 1993;264:E896–E901. doi: 10.1152/ajpendo.1993.264.6.E896. [DOI] [PubMed] [Google Scholar]
- 62.Bouchard C, Rankinen T. Individual differences in response to regular physical activity. Med Sci Sports Exerc. 2001;33(Suppl 6):S446–S451. doi: 10.1097/00005768-200106001-00013. [DOI] [PubMed] [Google Scholar]
- 63.Bouchard C, Blair SN, Church TS, Earnest CP, Hagberg JM, Hakkinen K, Jenkins NT, Karavirta L, Kraus WE, Leon AS, Rao DC, Sarzynski MA, Skinner JS, Slentz CA, Rankinen T. Adverse metabolic response to regular exercise: is it a rare or common occurrence? PLoS One. 2012;7:e37887. doi: 10.1371/journal.pone.0037887. [DOI] [PMC free article] [PubMed] [Google Scholar]
- 64.Allenberg K, Johansen K, Saltin B. Skeletal muscle adaptations to physical training in type II (non-insulin-dependent) diabetes mellitus. Acta Med Scand. 1988;223:365–373. doi: 10.1111/j.0954-6820.1988.tb15886.x. [DOI] [PubMed] [Google Scholar]
- 65.Charifi N, Kadi F, Feasson L, Costes F, Geyssant A, Denis C. Enhancement of microvessel tortuosity in the vastus lateralis muscle of old men in response to endurance training. J Physiol. 2004;554:559–569. doi: 10.1113/jphysiol.2003.046953. [DOI] [PMC free article] [PubMed] [Google Scholar]
- 66.Bakkman L, Sahlin K, Holmberg HC, Tonkonogi M. Quantitative and qualitative adaptation of human skeletal muscle mitochondria to hypoxic compared with normoxic training at the same relative work rate. Acta Physiol (Oxf) 2007;190:243–251. doi: 10.1111/j.1748-1716.2007.01683.x. [DOI] [PubMed] [Google Scholar]
- 67.Bangsbo J, Nielsen JJ, Mohr M, Randers MB, Krustrup BR, Brito J, Nybo L, Krustrup P. Performance enhancements and muscular adaptations of a 16-week recreational football intervention for untrained women. Scand J Med Sci Sports. 2010;20(Suppl 1):24–30. doi: 10.1111/j.1600-0838.2009.01050.x. [DOI] [PubMed] [Google Scholar]
- 68.Berthon P, Freyssenet D, Chatard JC, Castells J, Mujika I, Geyssant A, Guezennec CY, Denis C. Mitochondrial ATP production rate in 55 to 73-year-old men: effect of endurance training. Acta Physiol Scand. 1995;154:269–274. doi: 10.1111/j.1748-1716.1995.tb09908.x. [DOI] [PubMed] [Google Scholar]
- 69.Bruce CR, Thrush AB, Mertz VA, Bezaire V, Chabowski A, Heigenhauser GJ, Dyck DJ. Endurance training in obese humans improves glucose tolerance and mitochondrial fatty acid oxidation and alters muscle lipid content. Am J Physiol Endocrinol Metab. 2006;291:E99–E107. doi: 10.1152/ajpendo.00587.2005. [DOI] [PubMed] [Google Scholar]
- 70.Burgomaster KA, Heigenhauser GJ, Gibala MJ. Effect of short-term sprint interval training on human skeletal muscle carbohydrate metabolism during exercise and time-trial performance. J Appl Physiol. 2006;100:2041–2047. doi: 10.1152/japplphysiol.01220.2005. [DOI] [PubMed] [Google Scholar]
- 71.Coggan AR, Spina RJ, King DS, Rogers MA, Brown M, Nemeth PM, Holloszy JO. Skeletal muscle adaptations to endurance training in 60- to 70-yr-old men and women. J Appl Physiol. 1992;72:1780–1786. doi: 10.1152/jappl.1992.72.5.1780. [DOI] [PubMed] [Google Scholar]
- 72.Dubouchaud H, Butterfield GE, Wolfel EE, Bergman BC, Brooks GA. Endurance training, expression, and physiology of LDH, MCT1, and MCT4 in human skeletal muscle. Am J Physiol Endocrinol Metab. 2000;278:E571–E579. doi: 10.1152/ajpendo.2000.278.4.E571. [DOI] [PubMed] [Google Scholar]
- 73.Gordon A, Tyni-Lenne R, Persson H, Kaijser L, Hultman E, Sylven C. Markedly improved skeletal muscle function with local muscle training in patients with chronic heart failure. Clin Cardiol. 1996;19:568–574. doi: 10.1002/clc.4960190709. [DOI] [PubMed] [Google Scholar]
- 74.Green H, Grant S, Bombardier E, Ranney D. Initial aerobic power does not alter muscle metabolic adaptations to short-term training. Am J Physiol. 1999;277:E39–E48. doi: 10.1152/ajpendo.1999.277.1.E39. [DOI] [PubMed] [Google Scholar]
- 75.Green H, Tupling R, Roy B, O’Toole D, Burnett M, Grant S. Adaptations in skeletal muscle exercise metabolism to a sustained session of heavy intermittent exercise. Am J Physiol Endocrinol Metab. 2000;278:E118–E126. doi: 10.1152/ajpendo.2000.278.1.E118. [DOI] [PubMed] [Google Scholar]
- 76.Green HJ, Bombardier E, Burnett ME, Smith IC, Tupling SM, Ranney DA. Time-dependent effects of short-term training on muscle metabolism during the early phase of exercise. Am J Physiol Regul Integr Comp Physiol. 2009;297:R1383–R1391. doi: 10.1152/ajpregu.00203.2009. [DOI] [PubMed] [Google Scholar]
- 77.Gurd BJ, Perry CG, Heigenhauser GJ, Spriet LL, Bonen A. High-intensity interval training increases SIRT1 activity in human skeletal muscle. Appl Physiol Nutr Metab. 2010;35:350–357. doi: 10.1139/H10-030. [DOI] [PubMed] [Google Scholar]
- 78.Harmer AR, Chisholm DJ, McKenna MJ, Hunter SK, Ruell PA, Naylor JM, Maxwell LJ, Flack JR. Sprint training increases muscle oxidative metabolism during high-intensity exercise in patients with type 1 diabetes. Diabetes Care. 2008;31:2097–2102. doi: 10.2337/dc08-0329. [DOI] [PMC free article] [PubMed] [Google Scholar]
- 79.Howarth KR, LeBlanc PJ, Heigenhauser GJ, Gibala MJ. Effect of endurance training on muscle TCA cycle metabolism during exercise in humans. J Appl Physiol. 2004;97:579–584. doi: 10.1152/japplphysiol.01344.2003. [DOI] [PubMed] [Google Scholar]
- 80.Irving BA, Short KR, Nair KS, Stump CS. Nine days of intensive exercise training improves mitochondrial function but not insulin action in adult offspring of mothers with type 2 diabetes. J Clin Endocrinol Metab. 2011;96:E1137–E1141. doi: 10.1210/jc.2010-2863. [DOI] [PMC free article] [PubMed] [Google Scholar]
- 81.Jeppesen TD, Schwartz M, Olsen DB, Wibrand F, Krag T, Duno M, Hauerslev S, Vissing J. Aerobic training is safe and improves exercise capacity in patients with mitochondrial myopathy. Brain. 2006;129:3402–3412. doi: 10.1093/brain/awl149. [DOI] [PubMed] [Google Scholar]
- 82.Lange KH, Isaksson F, Juul A, Rasmussen MH, Bulow J, Kjaer M. Growth hormone enhances effects of endurance training on oxidative muscle metabolism in elderly women. Am J Physiol Endocrinol Metab. 2000;279:E989–E996. doi: 10.1152/ajpendo.2000.279.5.E989. [DOI] [PubMed] [Google Scholar]
- 83.Luden N, Hayes E, Minchev K, Louis E, Raue U, Conley T, Trappe S. Skeletal muscle plasticity with marathon training in novice runners. Scand J Med Sci Sports. 2012;22:662–670. doi: 10.1111/j.1600-0838.2011.01305.x. [DOI] [PubMed] [Google Scholar]
- 84.MacDougall JD, Hicks AL, MacDonald JR, McKelvie RS, Green HJ, Smith KM. Muscle performance and enzymatic adaptations to sprint interval training. J Appl Physiol. 1998;84:2138–2142. doi: 10.1152/jappl.1998.84.6.2138. [DOI] [PubMed] [Google Scholar]
- 85.Martin WH III, Coggan AR, Spina RJ, Saffitz JE. Effects of fiber type and training on beta-adrenoceptor density in human skeletal muscle. Am J Physiol. 1989;257:E736–E742. doi: 10.1152/ajpendo.1989.257.5.E736. [DOI] [PubMed] [Google Scholar]
- 86.Masuda K, Okazaki K, Kuno S, Asano K, Shimojo H, Katsuta S. Endurance training under 2500-m hypoxia does not increase myoglobin content in human skeletal muscle. Eur J Appl Physiol. 2001;85:486–490. doi: 10.1007/s004210100471. [DOI] [PubMed] [Google Scholar]
- 87.Messonnier L, Denis C, Prieur F, Lacour JR. Are the effects of training on fat metabolism involved in the improvement of performance during high-intensity exercise? Eur J Appl Physiol. 2005;94:434–441. doi: 10.1007/s00421-005-1325-4. [DOI] [PubMed] [Google Scholar]
- 88.Mogensen M, Vind BF, Hojlund K, Beck-Nielsen H, Sahlin K. Maximal lipid oxidation in patients with type 2 diabetes is normal and shows an adequate increase in response to aerobic training. Diabetes Obes Metab. 2009;11:874–883. doi: 10.1111/j.1463-1326.2009.01063.x. [DOI] [PubMed] [Google Scholar]
- 89.Perry CG, Heigenhauser GJ, Bonen A, Spriet LL. High-intensity aerobic interval training increases fat and carbohydrate metabolic capacities in human skeletal muscle. Appl Physiol Nutr Metab. 2008;33:1112–1123. doi: 10.1139/H08-097. [DOI] [PubMed] [Google Scholar]
- 90.Perry CG, Lally J, Holloway GP, Heigenhauser GJ, Bonen A, Spriet LL. Repeated transient mRNA bursts precede increases in transcriptional and mitochondrial proteins during training in human skeletal muscle. J Physiol. 2010;588:4795–4810. doi: 10.1113/jphysiol.2010.199448. [DOI] [PMC free article] [PubMed] [Google Scholar]
- 91.Putman CT, Jones NL, Hultman E, Hollidge-Horvat MG, Bonen A, McConachie DR, Heigenhauser GJ. Effects of short-term submaximal training in humans on muscle metabolism in exercise. Am J Physiol. 1998;275:E132–E139. doi: 10.1152/ajpendo.1998.275.1.E132. [DOI] [PubMed] [Google Scholar]
- 92.Rud B, Foss O, Krustrup P, Secher NH, Hallen J. One-legged endurance training: leg blood flow and oxygen extraction during cycling exercise. Acta Physiol (Oxf) 2012;205:177–185. doi: 10.1111/j.1748-1716.2011.02383.x. [DOI] [PubMed] [Google Scholar]
- 93.Slivka DR, Dumke CL, Hailes WS, Cuddy JS, Ruby BC. Substrate use and biochemical response to a 3,211-km bicycle tour in trained cyclists. Eur J Appl Physiol. 2012;112:1621–1630. doi: 10.1007/s00421-011-2129-3. [DOI] [PubMed] [Google Scholar]
- 94.Stannard SR, Buckley AJ, Edge JA, Thompson MW. Adaptations to skeletal muscle with endurance exercise training in the acutely fed versus overnight-fasted state. J Sci Med Sport. 2010;13:465–469. doi: 10.1016/j.jsams.2010.03.002. [DOI] [PubMed] [Google Scholar]
- 95.Starritt EC, Angus D, Hargreaves M. Effect of short-term training on mitochondrial ATP production rate in human skeletal muscle. J Appl Physiol. 1999;86:450–454. doi: 10.1152/jappl.1999.86.2.450. [DOI] [PubMed] [Google Scholar]
- 96.Svedenhag J, Henriksson J, Sylven C. Dissociation of training effects on skeletal muscle mitochondrial enzymes and myoglobin in man. Acta Physiol Scand. 1983;117:213–218. doi: 10.1111/j.1748-1716.1983.tb07199.x. [DOI] [PubMed] [Google Scholar]
- 97.Talanian JL, Galloway SD, Heigenhauser GJ, Bonen A, Spriet LL. Two weeks of high-intensity aerobic interval training increases the capacity for fat oxidation during exercise in women. J Appl Physiol. 2007;102:1439–1447. doi: 10.1152/japplphysiol.01098.2006. [DOI] [PubMed] [Google Scholar]
- 98.Tonkonogi M, Walsh B, Svensson M, Sahlin K. Mitochondrial function and antioxidative defence in human muscle: effects of endurance training and oxidative stress. J Physiol. 2000;528:379–388. doi: 10.1111/j.1469-7793.2000.00379.x. [DOI] [PMC free article] [PubMed] [Google Scholar]
- 99.Trappe S, Harber M, Creer A, Gallagher P, Slivka D, Minchev K, Whitsett D. Single muscle fiber adaptations with marathon training. J Appl Physiol. 2006;101:721–727. doi: 10.1152/japplphysiol.01595.2005. [DOI] [PubMed] [Google Scholar]
- 100.Wibom R, Hultman E, Johansson M, Matherei K, Constantin-Teodosiu D, Schantz PG. Adaptation of mitochondrial ATP production in human skeletal muscle to endurance training and detraining. J Appl Physiol. 1992;73:2004–2010. doi: 10.1152/jappl.1992.73.5.2004. [DOI] [PubMed] [Google Scholar]
- 101.Yfanti C, Akerstrom T, Nielsen S, Nielsen AR, Mounier R, Mortensen OH, Lykkesfeldt J, Rose AJ, Fischer CP, Pedersen BK. Antioxidant supplementation does not alter endurance training adaptation. Med Sci Sports Exerc. 2010;42:1388–1395. doi: 10.1249/MSS.0b013e3181cd76be. [DOI] [PubMed] [Google Scholar]
- 102.Zoll J, Ponsot E, Dufour S, Doutreleau S, Ventura-Clapier R, Vogt M, Hoppeler H, Richard R, Fluck M. Exercise training in normobaric hypoxia in endurance runners. III. Muscular adjustments of selected gene transcripts. J Appl Physiol. 2006;100:1258–1266. doi: 10.1152/japplphysiol.00359.2005. [DOI] [PubMed] [Google Scholar]
- 103.Green HJ, Helyar R, Ball-Burnett M, Kowalchuk N, Symon S, Farrance B. Metabolic adaptations to training precede changes in muscle mitochondrial capacity. J Appl Physiol. 1992;72:484–491. doi: 10.1152/jappl.1992.72.2.484. [DOI] [PubMed] [Google Scholar]
- 104.Jeppesen J, Jordy AB, Sjoberg KA, Fullekrug J, Stahl A, Nybo L, Kiens B. Enhanced fatty acid oxidation and FATP4 protein expression after endurance exercise training in human skeletal muscle. PLoS One. 2012;7:e29391. doi: 10.1371/journal.pone.0029391. [DOI] [PMC free article] [PubMed] [Google Scholar]
- 105.Mandroukas K, Krotkiewski M, Hedberg M, Wroblewski Z, Bjorntorp P, Grimby G. Physical training in obese women. Effects of muscle morphology, biochemistry and function. Eur J Appl Physiol Occup Physiol. 1984;52:355–361. doi: 10.1007/BF00943363. [DOI] [PubMed] [Google Scholar]
- 106.Ostergard T, Andersen JL, Nyholm B, Lund S, Nair KS, Saltin B, Schmitz O. Impact of exercise training on insulin sensitivity, physical fitness, and muscle oxidative capacity in first-degree relatives of type 2 diabetic patients. Am J Physiol Endocrinol Metab. 2006;290:E998–1005. doi: 10.1152/ajpendo.00012.2005. [DOI] [PubMed] [Google Scholar]
- 107.LeBlanc PJ, Peters SJ, Tunstall RJ, Cameron-Smith D, Heigenhauser GJ. Effects of aerobic training on pyruvate dehydrogenase and pyruvate dehydrogenase kinase in human skeletal muscle. J Physiol. 2004;557:559–570. doi: 10.1113/jphysiol.2003.058263. [DOI] [PMC free article] [PubMed] [Google Scholar]
- 108.Bronstad E, Rognmo O, Tjonna AE, Dedichen HH, Kirkeby-Garstad I, Haberg AK, Bjork IC, Wisloff U, Steinshamn S. High-intensity knee extensor training restores skeletal muscle function in COPD patients. Eur Respir J. 2012;40:1130–1136. doi: 10.1183/09031936.00193411. [DOI] [PubMed] [Google Scholar]